

PPARα-independent actions of omega-3 PUFAs contribute to their beneficial effects on adiposity and glucose homeostasis
- PMID: 24986106
- PMCID: PMC4078310
- DOI: 10.1038/srep05538
PPARα-independent actions of omega-3 PUFAs contribute to their beneficial effects on adiposity and glucose homeostasis
Abstract
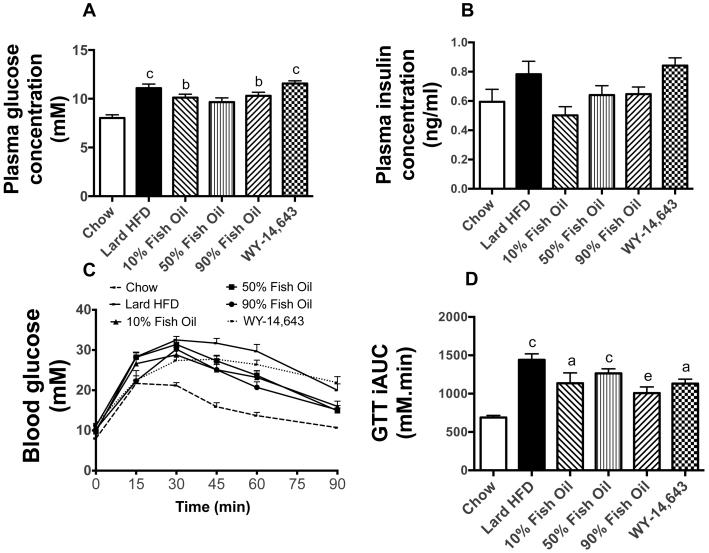
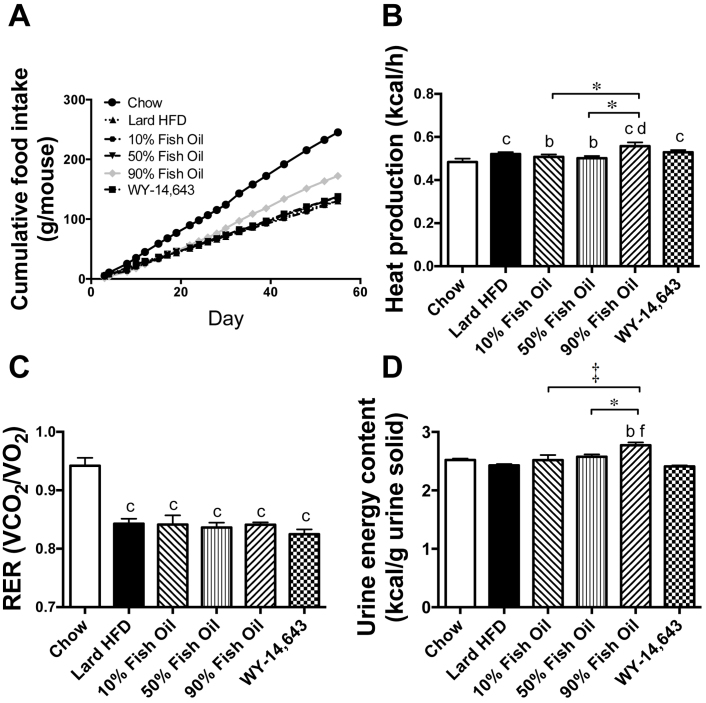
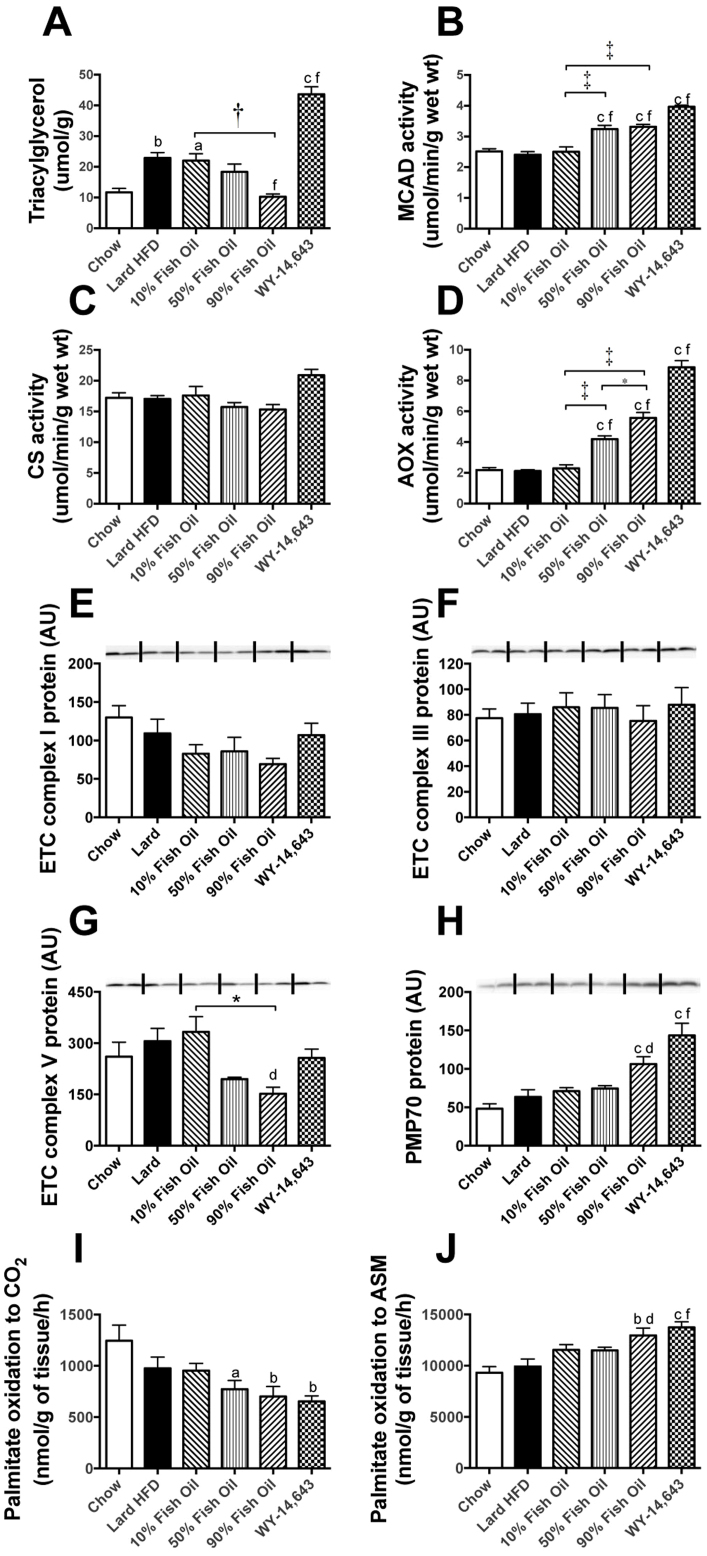
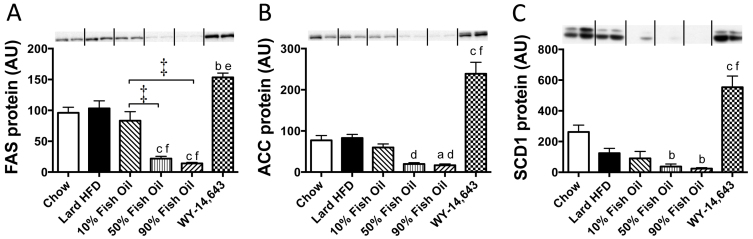
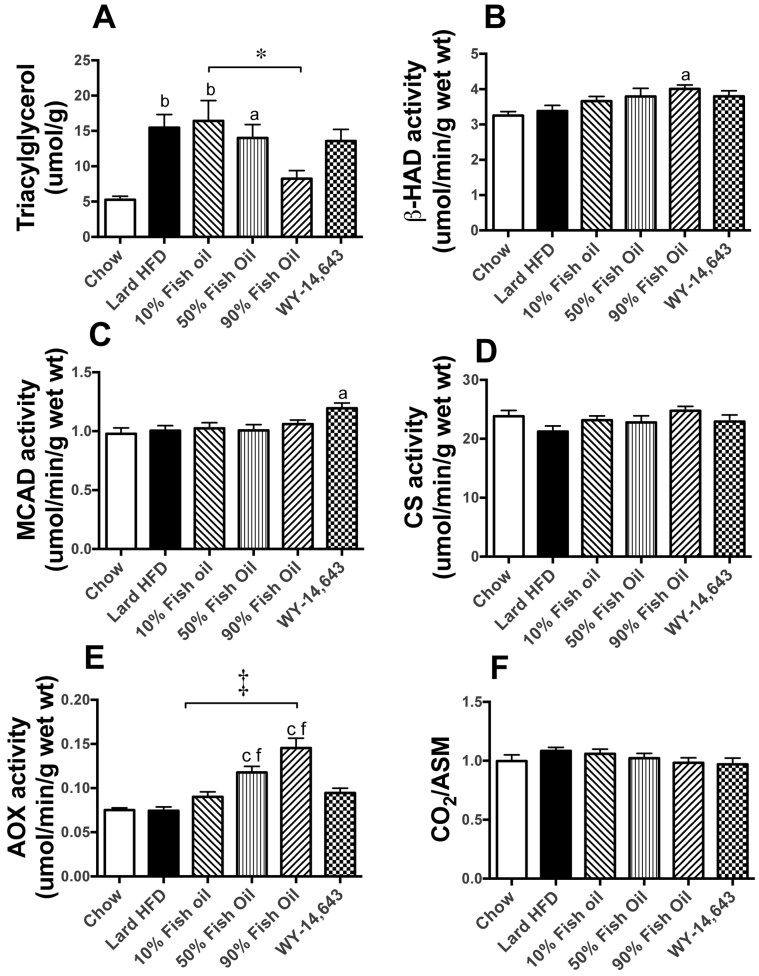
Excess dietary lipid generally leads to fat deposition and impaired glucose homeostasis, but consumption of fish oil (FO) alleviates many of these detrimental effects. The beneficial effects of FO are thought to be mediated largely via activation of the nuclear receptor peroxisomal-proliferator-activated receptor α (PPARα) by omega-3 polyunsaturated fatty acids and the resulting upregulation of lipid catabolism. However, pharmacological and genetic PPARα manipulations have yielded variable results. We have compared the metabolic effects of FO supplementation and the synthetic PPARα agonist Wy-14,643 (WY) in mice fed a lard-based high-fat diet. In contrast to FO, WY treatment resulted in little protection against diet-induced obesity and glucose intolerance, despite upregulating many lipid metabolic pathways. These differences were likely due to differential effects on hepatic lipid synthesis, with FO decreasing and WY amplifying hepatic lipid accumulation. Our results highlight that the beneficial metabolic effects of FO are likely mediated through multiple independent pathways.
Figures
Similar articles
-
Sex Differences in Early Programming by Maternal High Fat Diet Induced-Obesity and Fish Oil Supplementation in Mice.Nutrients. 2021 Oct 21;13(11):3703. doi: 10.3390/nu13113703. Nutrients. 2021. PMID: 34835957 Free PMC article.
-
Attenuation of obesity and insulin resistance by fish oil supplementation is associated with improved skeletal muscle mitochondrial function in mice fed a high-fat diet.J Nutr Biochem. 2018 May;55:76-88. doi: 10.1016/j.jnutbio.2017.11.012. Epub 2017 Dec 11. J Nutr Biochem. 2018. PMID: 29413492
-
Activation of peroxisome proliferator-activated receptor alpha by dietary fish oil attenuates steatosis, but does not prevent experimental steatohepatitis because of hepatic lipoperoxide accumulation.J Gastroenterol Hepatol. 2008 Feb;23(2):267-75. doi: 10.1111/j.1440-1746.2007.05157.x. Epub 2007 Sep 12. J Gastroenterol Hepatol. 2008. PMID: 17868330
-
Cellular and molecular effects of n-3 polyunsaturated fatty acids on adipose tissue biology and metabolism.Clin Sci (Lond). 2009 Jan;116(1):1-16. doi: 10.1042/CS20070456. Clin Sci (Lond). 2009. PMID: 19037880 Review.
-
Overview of the therapeutic efficacy of marine fish oil in managing obesity and associated metabolic disorders.Physiol Rep. 2024 Oct;12(19):e70019. doi: 10.14814/phy2.70019. Physiol Rep. 2024. PMID: 39358834 Free PMC article. Review.
Cited by
-
Fish oil mitigates myosteatosis and improves chemotherapy efficacy in a preclinical model of colon cancer.PLoS One. 2017 Aug 23;12(8):e0183576. doi: 10.1371/journal.pone.0183576. eCollection 2017. PLoS One. 2017. PMID: 28832677 Free PMC article.
-
Partial Replacement of Dietary Fat with Krill Oil or Coconut Oil Alleviates Dyslipidemia by Partly Modulating Lipid Metabolism in Lipopolysaccharide-Injected Rats on a High-Fat Diet.Int J Environ Res Public Health. 2022 Jan 12;19(2):843. doi: 10.3390/ijerph19020843. Int J Environ Res Public Health. 2022. PMID: 35055664 Free PMC article.
-
Association between omega-3 fatty acids consumption and the risk of type 2 diabetes: A meta-analysis of cohort studies.J Diabetes Investig. 2017 Jul;8(4):480-488. doi: 10.1111/jdi.12614. Epub 2017 Feb 3. J Diabetes Investig. 2017. PMID: 28032469 Free PMC article.
-
Macronutrient Determinants of Obesity, Insulin Resistance and Metabolic Health.Biology (Basel). 2021 Apr 16;10(4):336. doi: 10.3390/biology10040336. Biology (Basel). 2021. PMID: 33923531 Free PMC article. Review.
-
Eicosapentaenoic Acid (EPA) Alleviates LPS-Induced Oxidative Stress via the PPARα-NF-κB Axis.Oxid Med Cell Longev. 2025 Jun 10;2025:3509596. doi: 10.1155/omcl/3509596. eCollection 2025. Oxid Med Cell Longev. 2025. PMID: 40530326 Free PMC article.
References
-
- Kelly T., Yang W., Chen C. S., Reynolds K. & He J. Global burden of obesity in 2005 and projections to 2030. Int. J. Obes. 32, 1431–1437 (2008). - PubMed
-
- Chen L., Magliano D. J. & Zimmet P. Z. The worldwide epidemiology of type 2 diabetes mellitus-present and future perspectives. Nat. Rev. Endocrinol. 8, 228–236 (2012). - PubMed
-
- Storlien L. H. et al. Influence of dietary fat composition on development of insulin resistance in rats. Relationship to muscle triglyceride and omega-3 fatty acids in muscle phospholipid. Diabetes 40, 280–289 (1991). - PubMed
Publication types
MeSH terms
Substances
LinkOut - more resources
Full Text Sources
Other Literature Sources
Medical
