. 2014 Jul 15;74(14):3947-58.
doi: 10.1158/0008-5472.CAN-13-2923. Epub 2014 Jul 1.

CDK4/6 and IGF1 receptor inhibitors synergize to suppress the growth of p16INK4A-deficient pancreatic cancers

Affiliations

CDK4/6 and IGF1 receptor inhibitors synergize to suppress the growth of p16INK4A-deficient pancreatic cancers

Andreas M Heilmann et al. Cancer Res. .

Abstract

Loss-of-function mutations in p16(INK4A) (CDKN2A) occur in approximately 80% of sporadic pancreatic ductal adenocarcinoma (PDAC), contributing to its early progression. Although this loss activates the cell-cycle-dependent kinases CDK4/6, which have been considered as drug targets for many years, p16(INK4A)-deficient PDAC cells are inherently resistant to CDK4/6 inhibitors. This study searched for targeted therapies that might synergize with CDK4/6 inhibition in this setting. We report that the IGF1R/IR inhibitor BMS-754807 cooperated with the CDK4/6 inhibitor PD-0332991 to strongly block proliferation of p16(INK4A)-deficient PDAC cells in vitro and in vivo. Sensitivity to this drug combination correlated with reduced activity of the master cell growth regulator mTORC1. Accordingly, replacing the IGF1R/IR inhibitor with the rapalog inhibitor temsirolimus broadened the sensitivity of PDAC cells to CDK4/6 inhibition. Our results establish targeted therapy combinations with robust cytostatic activity in p16(INK4A)-deficient PDAC cells and possible implications for improving treatment of a broad spectrum of human cancers characterized by p16(INK4A) loss.


Conflict of interest statement

Conflict of interest: The authors disclose no potential conflicts of interest.

Figures

Figure 1
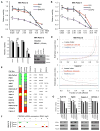
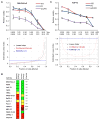
Figure 1. CDK4/6 and IGF1R/IR inhibitors synergize to reduce viability of PDAC cells with CDKN2A deletion
(A) MIA-PaCa-2 cells were treated with BMS-754807 (BMS), PD-0332991 (PD) or their fixed-ratio (1:10) combination (BMS/PD) over a concentration range (μM) for 72 h and cell viability was measured relative to DMSO treated controls. (B) Relative viability of MIA-PaCa-2 cells treated with OSI-906 (OSI), PD-0332991 or their fixed-ratio (1:1) combination (OSI/PD). (C) Relative viability of MIA-PaCa-2 cells treated with 125 nM BMS-754807 or DMSO after knockdown of CDK4 and/or CDK6 (siscbl, control siRNA). Data are means from at least two independent replicates and error bars indicate s.e.m. for (A) through (C) (** p<0.01 and *p<0.05, one-tailed t test). (D) Synergy plots for MIA-PaCa-2 or Capan-2 cells treated with BMS-754807, PD-0332991 or their fixed-ratio combination show Loewe indices per fraction of cells affected by the combination treatment: <1 indicates synergism, =1 indicates additivity (blue line) and >1 indicates antagonism with 95% confidence (red dashed lines) (N=2). (E) Synergy analysis summary for the indicated PDAC cell lines treated with the BMS-754807/PD-0332991 or OSI-906/PD-0332991 combination. Green squares represent significant synergy over a broad effect range, yellow squares indicate significant synergy over less than 50% of the effect range and red squares show lack of significant synergy. Mutational status of cancer genes mutated in at least three of the tested cell lines are reported (Sanger COSMIC Cell Lines Project v65; ND not determined). (F) CDKN2A mRNA expression (Broad-Novartis Cancer Cell Line Enzyclopedia database) in PDAC cell lines with broad (green), partial (yellow) or no (red) synergy of BMS-754807 and PD-0332991. (G) Viability (mean +/- s.d., relative to siscbl control) of HuP-T3, YAPC, Capan-2, and CFPAC-1 cells 6 days after transfection with CDK4 and/or CDK6 siRNA.
Figure 2
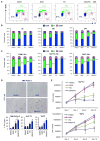
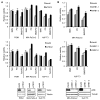
Figure 2. The combination of PD-0332991 and BMS-754807 enhances G1 arrest and senescence
(A) Bivariate flow cytometry analyses of MIA-PaCa-2 cells treated 24 h with 50 nM BMS-754807 (BMS), 500 nM PD-0332991 (PD), their combination (BMS/PD, 50 nM/500 nM) or DMSO. The x-axis denotes DNA content as detected with PI, the y-axis shows cells undergoing active S-phase as indicated by BrdU labeling. Inset values show percent cells in G1/0, S, and G2/M phase. (B) MIA-PaCa-2 cells were treated for 8 h, 16 h, and 24 h as described in (A). Bar graphs show percent cells in G1/0, S, and G2/M phase as determined by BrdU/PI staining (N=2, * p<0.05, two-tailed t test). (C) PSN1, HuP-T3, and YAPC cells were treated for 24 h and analyzed as in (A) and (B). (D) Senescence-associated β-galactosidase (SA-β-gal) staining of MIA-PaCa-2, HuP-T3, and YAPC cells treated for 72 h as described in (A). Images are representative of the MIA-PaCa-2 staining. Bar graphs show mean percentage of SA-β-gal positive cells (* p<0.05, two-tailed t test). (E) Population doubling of HuP-T3 and YAPC cells that were continuously cultured for 12 days in BMS-754807, PD-0332991, their combination or DMSO and counted every four days. Data are from two independent replicate assays and error bars represent s.d. for all experiments.
Figure 3
Figure 3. Concurrent treatment with PD-0332991 and BMS-754807 is synergistic in vivo
(A) YAPC xenografts were treated with 15 mg/kg BMS-754807 (BMS) (N=5), 75 mg/kg PD-0332991 (PD) (N=6), their combination (BMS/PD) (N=5) or vehicle (N=5) on days 8, 10, 12, 14, 17, 19, and 21 after subcutaneous tumor implant and tumor volumes (mean +/- s.e.m) were measured every three days from day 7. p values were calculated by two-tailed t test for BMS/PD versus the other groups (* p<0.05) and the single agent treatments versus the vehicle group (not significant). (B) Tumors were lysed following completion of the treatment study and analyzed by Western blotting with the indicated antibodies; a representative of at least two independent experiments is shown.
Figure 4
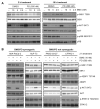
Figure 4. The drug combination inhibits S6K1 in the sensitive PDAC cell lines
(A) PSN1 cells were treated for 2 h and 16 h with BMS-754807 (BMS) doses ranging from 2.5 to 10 nM in the presence of 500 nM PD-0332991 (PD) or DMSO, and the cell lysates were analyzed by Western blotting. (B) The sensitive PDAC cell lines MIA-PaCa-2 and HuP-T3 and the insensitive cell lines PANC-03-27 and CFPAC-1 were treated for 2 h with 10 nM BMS-754807, 500 nM PD-0332991, their combination or DMSO, and cell lysates were probed with the indicated antibodies.
Figure 5
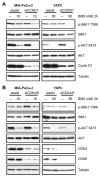
Figure 5. Knockdown of Cylin D1 or CDK4/6 sensitizes PDAC cells to S6K1 inhibition by BMS-754807
(A) MIA-PaCa-2 and YAPC cells were transfected with siRNA targeting Cyclin D1 (siCCND1), or control siRNA (siscbl). After 72 h, the cells were treated for 2 h with BMS-754807 (BMS) or DMSO control, and cell lysates were analyzed for the indicated proteins. (B) CDK4/6 were depleted with siRNA (siCDK4/6) for 72 h, followed by 2 h treatment with BMS-754807 or DMSO and Western blotting.
Figure 6
Figure 6. PD-0332991 synergizes with mTOR inhibitors to inhibit the growth of PDAC cell lines
(A) Relative viability (mean +/- s.e.m.) of MIA-PaCa-2 cells treated for 72 h with temsirolimus (Tem), PD-0332991 (PD) or their fixed-ratio (1:1) combination (Tem/PD) over a concentration range (μM). Synergy plot shows Loewe indices per fraction of cells affected by the combination treatment: <1 indicates synergism, =1 indicates additivity (blue line) and >1 indicates antagonism with 95% confidence (red dashed lines). (B) Synergy analysis summary for the indicated PDAC cell lines and the temsirolimus/PD-0332991 combination (N=2): Green squares represent significant Loewe synergy over a broad effect range, yellow squares indicate significant synergy over less than 50% of the effect range and red squares show lack of significant synergy. BMS-754807/PD-0332991 synergy analysis from Figure 1E was included for comparison. (C) Relative viability (mean +/- s.e.m.) of HuP-T3 cells treated with AZD-8055 (AZD), PD-0332991 or their fixed-ratio (1:50) combination (AZD/PD). Synergy plot shows Loewe indices per fraction of cells affected by the combination treatment.
Figure 7
Figure 7. TSC2 or pRB depletion restores growth in the presence of CDK4/6 and IGF1R/IR inhibitors
(A) Relative viability of PSN1, MIA-PaCa-2, or HuP-T3 cells treated with 0.25 μM BMS-754807 (BMS), 2.5 μM temsirolimus (Tem), 2.5 μM PD-0332991 (PD), or their combinations (BMS/PD and Tem/PD) after knockdown of TSC2 (siscbl, control siRNA). (B) MIA-PaCa-2 and HuP-T3 cells were infected with two different short hairpin RNAs targeting RB1 (shRB1-1, shRB1-2) or control shRNA (shscbl). After puromycin selection, cells were treated for 72 h with 0.25 μM BMS-754807, 2.5 μM PD-0332991, or their combination. Error bars represent s.e.m. for all experiments.

References

    1. Burkhart DL, Sage J. Cellular mechanisms of tumour suppression by the retinoblastoma gene. Nat Rev Cancer. 2008;8:671–82. - PMC - PubMed
    1. Weinberg Ra. The retinoblastoma protein and cell cycle control. Cell. 1995;81:323–30. - PubMed
    1. Bignell GR, Greenman CD, Davies H, Butler AP, Edkins S, Andrews JM, et al. Signatures of mutation and selection in the cancer genome. Nature. 2010;463:893–8. - PMC - PubMed
    1. Serrano M, Lin AW, Mccurrach ME, Beach D, Lowe SW. Oncogenic ras Provokes Premature Cell Senescence Associated with Accumulation of p53 and p16 INK4a. Cell. 1997;88:593–602. - PubMed
    1. Anders L, Ke N, Hydbring P, Choi YJ, Widlund HR, Chick JM, et al. A systematic screen for CDK4/6 substrates links FOXM1 phosphorylation to senescence suppression in cancer cells. Cancer Cell. 2011;20:620–34. - PMC - PubMed

Publication types

MeSH terms

Substances