

Phenotypic bistability in Escherichia coli's central carbon metabolism
- PMID: 24987115
- PMCID: PMC4299493
- DOI: 10.15252/msb.20135022
Phenotypic bistability in Escherichia coli's central carbon metabolism
Abstract
Fluctuations in intracellular molecule abundance can lead to distinct, coexisting phenotypes in isogenic populations. Although metabolism continuously adapts to unpredictable environmental changes, and although bistability was found in certain substrate-uptake pathways, central carbon metabolism is thought to operate deterministically. Here, we combine experiment and theory to demonstrate that a clonal Escherichia coli population splits into two stochastically generated phenotypic subpopulations after glucose-gluconeogenic substrate shifts. Most cells refrain from growth, entering a dormant persister state that manifests as a lag phase in the population growth curve. The subpopulation-generating mechanism resides at the metabolic core, overarches the metabolic and transcriptional networks, and only allows the growth of cells initially achieving sufficiently high gluconeogenic flux. Thus, central metabolism does not ensure the gluconeogenic growth of individual cells, but uses a population-level adaptation resulting in responsive diversification upon nutrient changes.
Keywords: bistability; flux sensing; metabolism; noise; persisters.
© 2014 The Authors. Published under the terms of the CC BY 4.0 license.
Figures
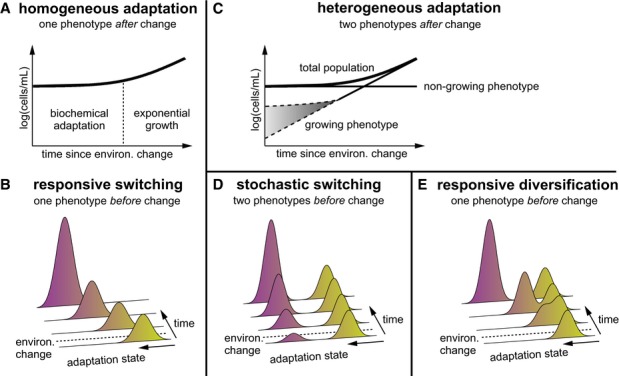
A, B According to the classical hypothesis, a bacterial population adapts homogeneously in response to environmental change, and considerable time is required before growth resumes.
C According to our subpopulation hypothesis, only an initially small subpopulation of cells resumes growth. Growth could immediately be at maximal rate (lower dashed line) or could increase over time (upper dashed line).
D, E The two phenotypes can either already exist before the environmental change due to stochastically switching cells (D) or are generated from a homogeneous population in response to environmental change (responsive diversification) (E).
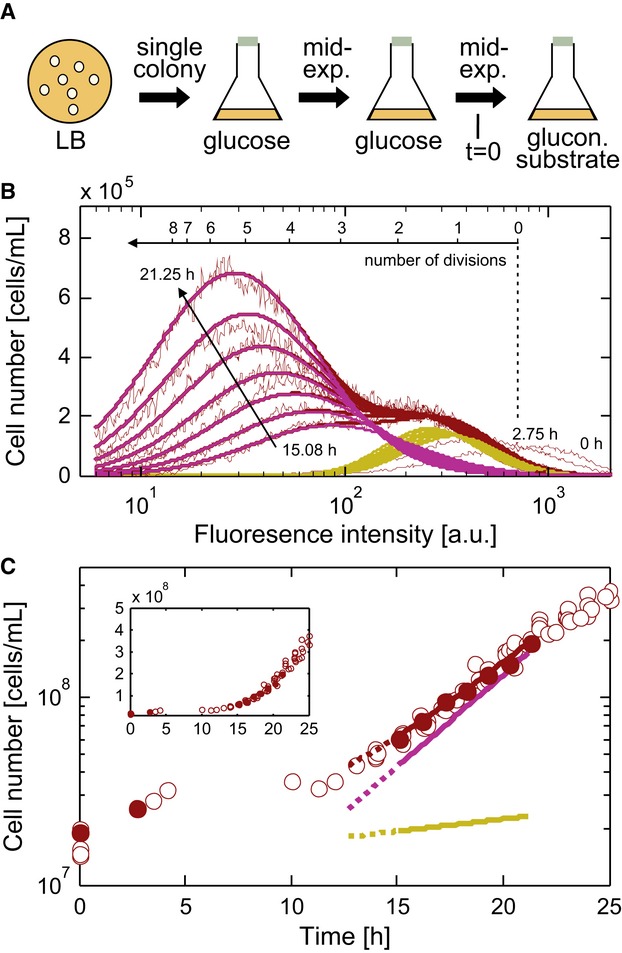
Outline of the cultivation and carbon source shift procedure.
The distribution of fluorescence intensity at multiple time points after a shift to 0.75 g l−1 acetate. A bi-Gaussian fit (purple, growing subpopulation; yellow, non-growing subpopulation; red, total population) reproduces the experimental data (thin lines). A fraction of non-growing cells undergoes a reductive cell division (Nystrom, 2004) causing the initial fluorescence intensity decrease; respective fluorescence distributions were not included in the fit. See Supplementary Fig S2 for validation of the staining experiment.
Cell count for the total population (red circles) after a shift to 0.75 g l−1 acetate and deduced growth curves for the total population (red line), the growing subpopulation (purple line), and the non-growing subpopulation (yellow line). Yellow and purple lines represent the values of the deconvolved data shown in (B). Filled red circles indicate the time points for flow cytometric data shown in (B). The inset shows the same data with a linear y-axis.
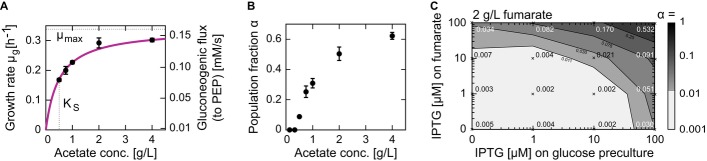
Dependence of the growing subpopulation's growth rate, μg, on the acetate concentration is hyperbolic, with a maximal growth rate (μmax) of 0.34 h and Monod constant (KS) of 0.5 g l−1. The acetate concentrations used in these experiments are comparable to the concentrations obtained in typical glucose batch cultures (Luli & Strohl, 1990).
Population fraction α increases with acetate concentration and levels off at approximately 0.6. Error bars indicate standard deviations based on at least three replicates.
Population fraction α can be influenced by modulating the abundance of the fumarate transporter DctA when switching from glucose to 2 g l−1 fumarate. Plasmid-based expression was induced in the wild-type strain using IPTG at different concentrations (0, 1, 10, 100 μM) on glucose (before shift), fumarate (after shift), or both. Crosses indicate conditions of individual experiments with the respective switching population fraction, α, indicated. The steady-state fumarate uptake rates at the different induction levels 0, 1, 10, and 100 μM were 1.8, 2.1, 2.6, and 3.7 × 10⁻⁶ nmol cell−1 h−1 (see Supplementary Fig S6), respectively, demonstrating that the different induction levels modulate the fumarate uptake rate.
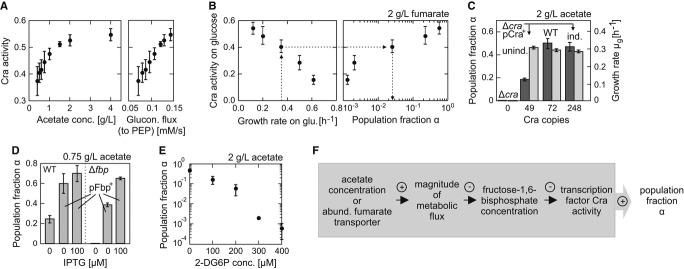
The fraction of time during which Cra occupied the pykF promoter (‘Cra activity’) increased with increasing acetate concentration and thus the steady-state gluconeogenic flux to phosphoenolpyruvate (PEP). The steady-state growth rates on different acetate concentrations (see Fig3A) and a stoichiometric metabolic network model developed by Schuetz et al (2007) were used to estimate the fluxes to PEP using an optimization approach (‘minimization of flux’ objective, see the same paper for methodology).
Growth rate on glucose, likely via Cra activity (left panel), influenced population fraction α (right panel) and lag phase (Supplementary Fig S7) when switching to 2 g l−1 fumarate. The data point with the highest growth rate was from a glucose batch culture, all others are from glucose-limited chemostat cultures, in which the growth rate was controlled by the dilution rate.
Perturbations in the abundance of transcription factor Cra, through knockout or overexpression, affected α (dark gray bars), but not μg (light gray bars).
The population fraction increased above wild-type levels, in both wild-type (left set of bars) and Δfbp (right set of bars), when fructose-1,6-bisphosphatase (Fbp) was overexpressed from an inducible plasmid.
The population fraction α decreased with an increasing concentration of 2-deoxyglucose-6-phosphate (2-DG6P), a non-metabolized glucose-6-phosphate analogue that inhibits the enzyme Fbp (see Supplementary Materials and Methods).
Summary of the critical interactions that determine population fraction α. A plus or minus indicates a positive or negative relationship of the interaction.
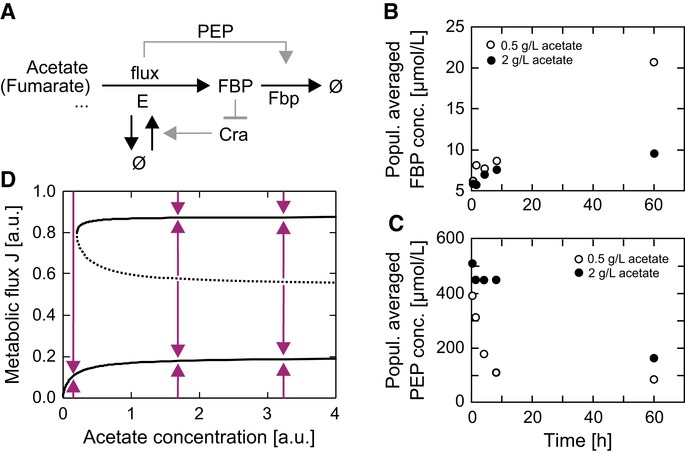
A Model of the bistability-generating circuit. E denotes a fictitious super-enzyme catalyzing combined reactions. The enzyme fructose-1,6-bisphosphatase (Fbp) is activated in a flux-dependent manner. The metabolite fructose-1,6-bisphosphate (FBP) represses E production by inhibiting E's transcriptional activator Cra. PEP, phosphoenolpyruvate.
B, C Population-averaged metabolite levels after a switch from glucose to acetate (0.5 g l−1, open symbols; 2 g l−1 closed symbols) showed that at the higher acetate concentration—and thus at the higher gluconeogenic flux condition—FBP levels are lower (B), while the level of the strong allosteric activator of the Fbp enzyme, phosphoenolpyruvate (PEP), is significantly higher at increased fluxes, accomplishing a flux-dependent feed-forward activation of the Fbp enzyme (C).
D Bifurcation diagram of metabolic steady-state fluxes J as a function of the extracellular acetate concentration. The system is capable of expressing two stable steady-state fluxes (bold lines) and one unstable steady-state flux (dashed line), which acts as a watershed separating the convergence regions of the high (growing) and low (non-growing) stable steady states. Arrows show the direction of system dynamics.
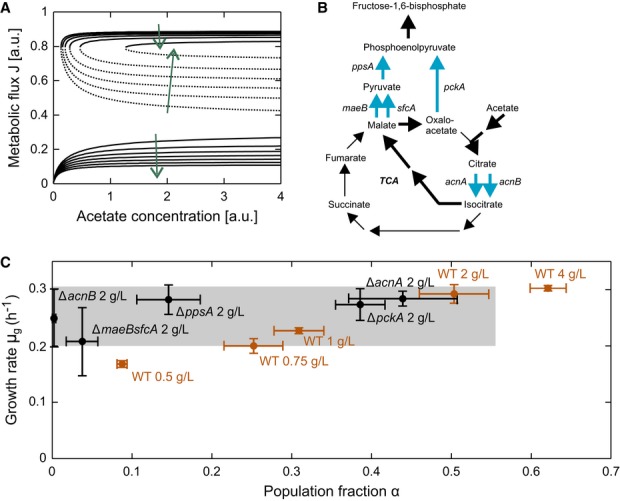
Bifurcation diagrams for different super-enzyme E production rates. Arrows indicate the direction of decreasing E production rates with which the convergence region of the growing phenotype gradually decreases and that of the non-growing phenotype increases (and α decreases), and steady-state flux J and the growth rate of the growing phenotype basically remain stable.
Reactions catalyzed by super-enzyme E. Bold arrows indicate the route of major carbon flux from acetate to FBP. Thin arrows complete the citric acid cycle. Blue arrows highlight isoenzymes and parallel pathways that are knockout targets for experimentally introduced different E production rates.
Growing population fraction α and its growth rate μg for different strains when switching to acetate with the indicated concentrations. Orange data points indicate wild-type behavior in which both α and μg increase with increasing acetate concentration. Black points indicate the behavior of knockout mutants with potential different E production rates. In the ΔacnB, ΔppsA, and ΔmaeBsfcA deletion strains, α is markedly reduced, whereas the ΔacnA and ΔpckA mutants exhibit nearly wild-type behavior. Error bars indicate standard deviations based on at least three replicates.
Comment in
-
Implications of initial physiological conditions for bacterial adaptation to changing environments.Mol Syst Biol. 2020 Sep;16(9):e9965. doi: 10.15252/msb.20209965. Mol Syst Biol. 2020. PMID: 32965749 Free PMC article.
References
-
- Acar M, Becskei A, van Oudenaarden A. Enhancement of cellular memory by reducing stochastic transitions. Nature. 2005;435:228–232. - PubMed
-
- Acar M, Mett JT, van Oudenaarden A. Stochastic switching as a survival strategy in fluctuating environments. Nat Genet. 2008;40:471–475. - PubMed
-
- Balaban NQ, Merrin J, Chait R, Kowalik L, Leibler S. Bacterial persistence as a phenotypic switch. Science. 2004;305:1622–1625. - PubMed
Publication types
MeSH terms
Substances
LinkOut - more resources
Full Text Sources
Other Literature Sources
