

Minimal metabolic pathway structure is consistent with associated biomolecular interactions
- PMID: 24987116
- PMCID: PMC4299494
- DOI: 10.15252/msb.20145243
Minimal metabolic pathway structure is consistent with associated biomolecular interactions
Abstract
Pathways are a universal paradigm for functionally describing cellular processes. Even though advances in high-throughput data generation have transformed biology, the core of our biological understanding, and hence data interpretation, is still predicated on human-defined pathways. Here, we introduce an unbiased, pathway structure for genome-scale metabolic networks defined based on principles of parsimony that do not mimic canonical human-defined textbook pathways. Instead, these minimal pathways better describe multiple independent pathway-associated biomolecular interaction datasets suggesting a functional organization for metabolism based on parsimonious use of cellular components. We use the inherent predictive capability of these pathways to experimentally discover novel transcriptional regulatory interactions in Escherichia coli metabolism for three transcription factors, effectively doubling the known regulatory roles for Nac and MntR. This study suggests an underlying and fundamental principle in the evolutionary selection of pathway structures; namely, that pathways may be minimal, independent, and segregated.
Keywords: constraint‐based modeling; genetic interactions; pathway analysis; protein‐protein interactions; transcriptional regulatory networks.
© 2014 The Authors. Published under the terms of the CC BY 4.0 license.
Figures
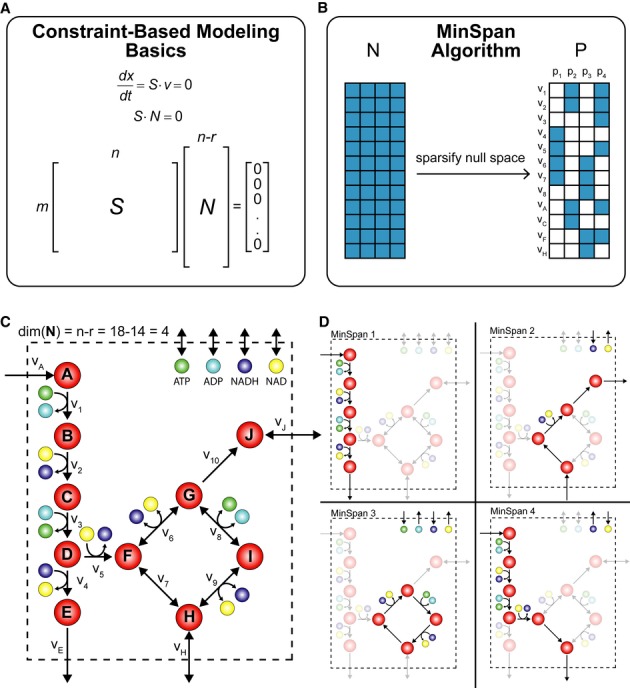
A metabolic network is mathematically represented as a stoichiometric matrix (S). Reactions fluxes (v) are determined assuming steady state. All potential flux states lie in the null space (N).
The MinSpan algorithm determines the shortest, independent pathways of the metabolic network by decomposing the null space of the stoichiometric matrix to form the sparsest basis.
A simplified model for glycolysis and TCA cycle is presented with 14 metabolites, 18 reactions, and a 4-dimensional null space. Reversible reactions are shown.
The four pathways calculated by MinSpan for the simplified model are presented, two of which recapitulate glycolysis and the TCA cycle, while the other two represent other possible metabolic pathways. The flux directions of a pathway through reversible reactions are shown as irreversible reactions.
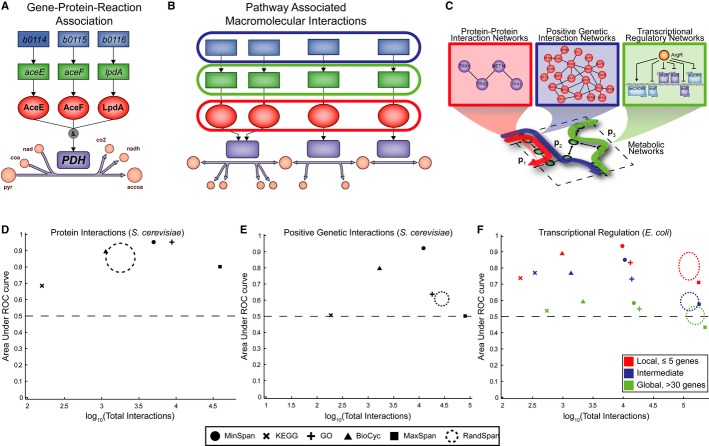
A “Gene-protein-reaction” (GPR) associations describe the necessary genes and proteins required for the catalysis of a metabolic reaction. Pyruvate dehydrogenase in Escherichia coli is shown as an example.
B We grouped genes and proteins in the GPRs for each MinSpan pathway to check consistency with datasets on pathway-associated biomolecular interactions.
C–F Correlation analysis (C) of the gene and protein sets shows MinSpan pathways are biologically consistent with three different biomolecular interaction networks: (D) protein-protein interactions in S. cerevisiae (yeast two-hybrid data), (E) positive genetic interactions in S. cerevisiae (P < 0.05 and ε > 0.16 as defined by Costanzo et al2010), and (F) transcriptional regulation in E. coli. MinSpan pathways are more consistent with data-driven protein interaction, genetic interaction, and transcriptional regulatory networks than human-defined pathways (KEGG, BioCyc, and GO), a least sparse null space (MaxSpan), and randomly generated null spaces (RandSpan). Accuracy (y-axis) is determined by the area under the curve (AUC) of the receiver operating characteristic (ROC) curve. Coverage (x-axis) is determined by the number of interactions the method made a prediction for. The dotted circle for RandSpan represents the mean plus one standard deviation of the 100 random null spaces. x- and y-axes values are in the Supplementary Information.
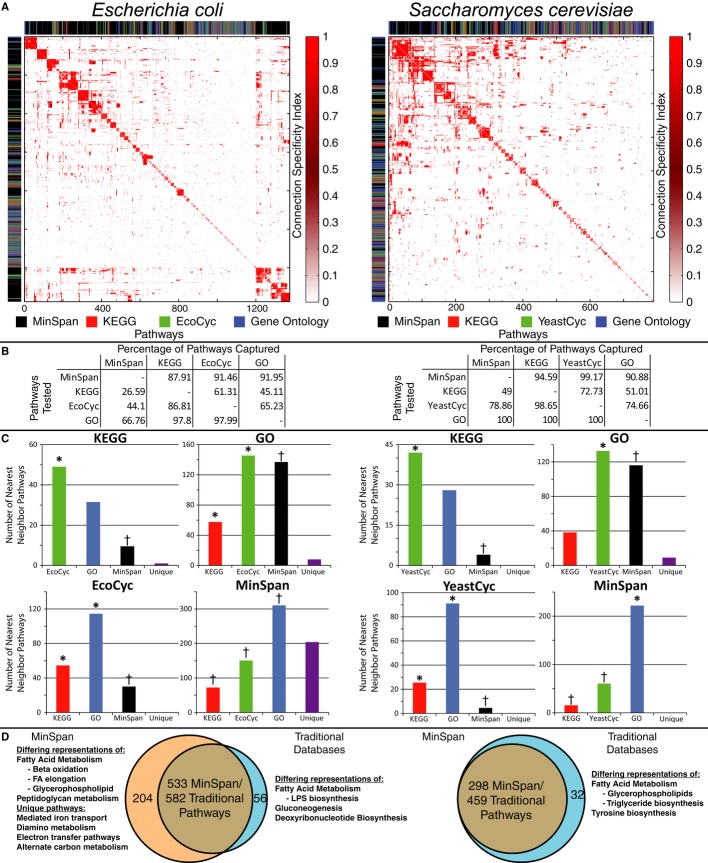
The pairwise connection specificity index (CSI) was calculated for all pathway definitions (from four sources: MinSpan, KEGG, BioCyc, and Gene Ontology) for Escherichia coli and Saccharomyces cerevisiae as a measure of pathway similarity. The CSI matrix was hierarchically clustered and the database that the pathway originates from is color-coded to the left and above the heatmap to illustrate the clustering.
The percentage of pathways that share a high CSI value (top 15% of interactions) between pathway databases is presented. For example, MinSpan pathways are similar to and capture roughly 88% of all pathways in KEGG for E. coli. Conversely, KEGG is much smaller and only captures 26% of MinSpan pathways.
A K-nearest neighbor search was done to see how pathways classify into other databases. KEGG and BioCyc pathways have the closest resemblance with Gene Ontology being the next similar. MinSpan is significantly different than human-defined pathways. (*Significant enrichment, †Significant depletion).
533 MinSpan pathways are similar to 582 traditional pathways. There is not a one-to-one mapping as similar pathways may exist in multiple human-defined databases. For E. coli¸ there are 204 unique MinSpan pathways. In S. cerevisiae, there are none as Gene Ontology captures all the pathways from the metabolic model.
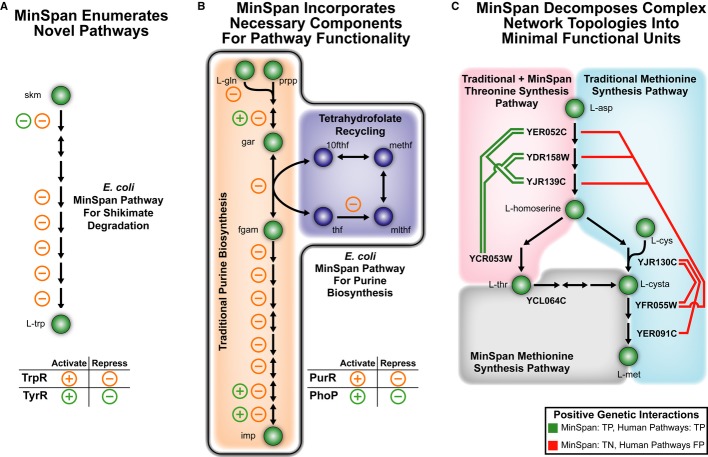
MinSpan automates the enumeration of biologically relevant pathways.
MinSpan includes all required components of a pathway to be independent. The additional pathway components not found in human-defined pathways, such as THF recycling, are often co-regulated and thus a part of a coherent pathway functioning as a “module” in a network.
MinSpan decomposes complex topology into the simplest representation. For example, there is a shorter route to
l -methionine production throughl -threonine than froml -aspartate. Note: For MinSpan pathways, only the representative genes of the pathway are shown. 10fthf: 10-formyltetrahydrofolate; 2obut: 2-oxobutanoate; gar: glycinamide ribonucleotide;l -cysta:l -cystathionine; methf: 5,10-methenyltetrahydrofolate; mlthf: 5,10-methylenetetrahydrofolate; prpp: phosphoribosyl pyrophosphate; skm: shikimate; thf: tetrahydrofolate.
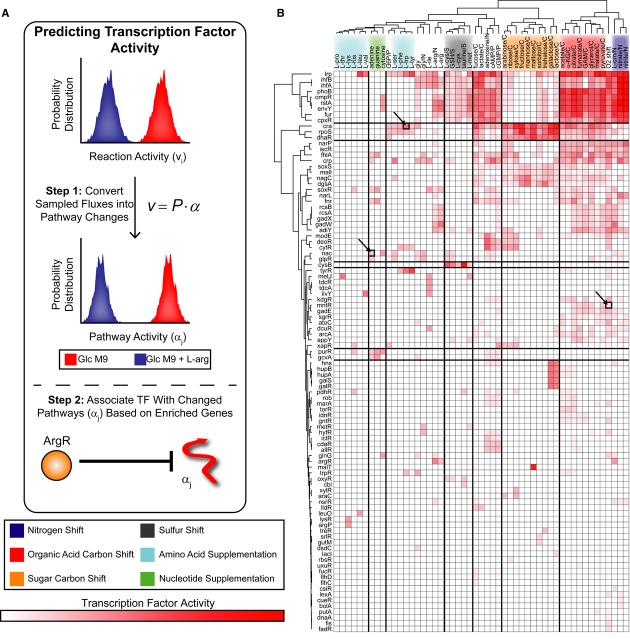
Constraint-based models can determine reaction activity, or flux states (v), using Monte Carlo sampling. Decomposing sampled flux states into linear weightings of MinSpan pathways (α) allows prediction of TF activity. For example, metabolic reaction fluxes are sampled under glucose minimal media and glucose minimal media +
l -arginine supplementation. Typical analysis would yield a list of reactions (including vi) that are significantly changed. With MinSpan pathways, the flux distributions can be converted into significant changes in pathway activity (including αj). TFs are associated with pathways based on enrichment of regulated genes. Predicting TF activity is based on which TFs are associated with the significantly changed pathways; in this case, αj is associated with ArgR.The TF activity of 51 nutrient shifts was predicted and can be hierarchically clustered by nutrient shift type. TF activity for the heatmap is defined as the percentage of differential MinSpan pathways that are associated with that TF. 36% of the TF–environment associations predicted are not known, providing numerous predictions for experimentation. Experimentally tested TF–environment associations are highlighted.
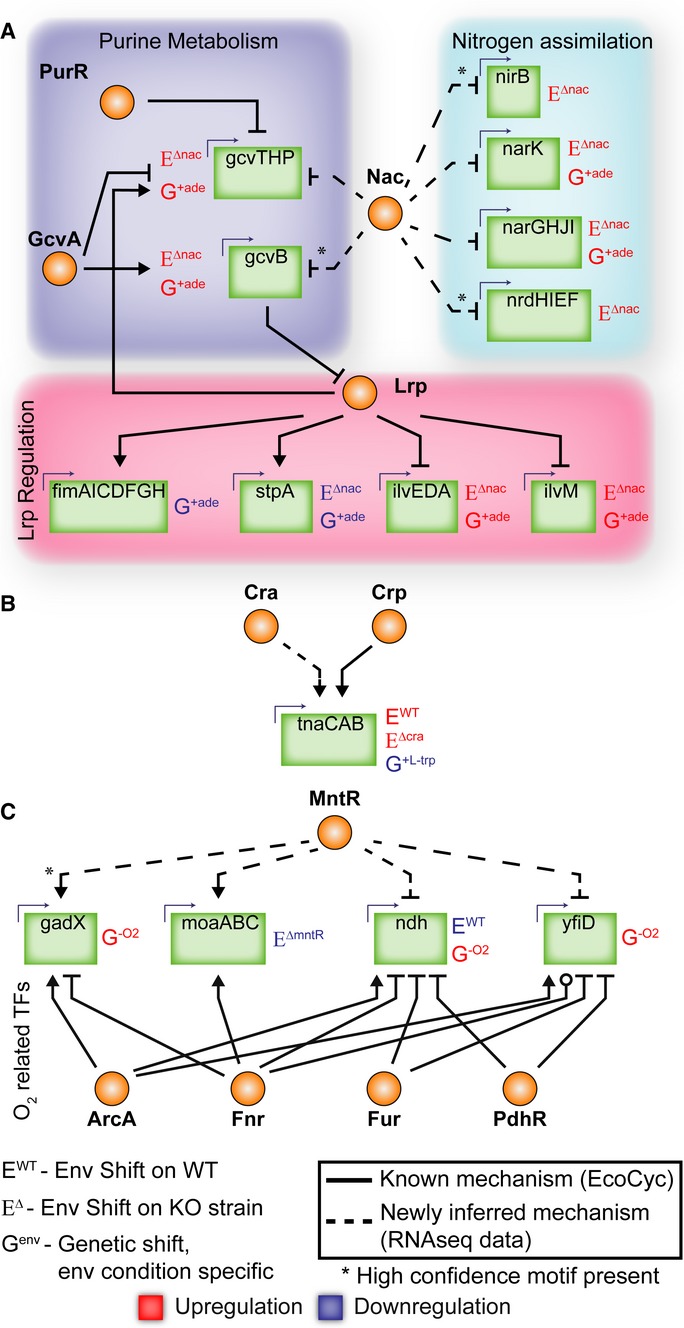
Nac plays a role in purine metabolism and a larger role in nitrogen metabolism than previously known. Nac also regulates Lrp through gcvB.
Cra regulates tnaCAB, which is also subject to Crp regulation.
MntR plays a regulatory role for four genes that are heavily regulated by ArcA/Fnr/Fur/PdhR and are utilized during anaerobic conditions.
References
-
- Ashburner M, Ball CA, Blake JA, Botstein D, Butler H, Cherry JM, Davis AP, Dolinski K, Dwight SS, Eppig JT, Harris MA, Hill DP, Issel-Tarver L, Kasarskis A, Lewis S, Matese JC, Richardson JE, Ringwald M, Rubin GM, Sherlock G. Gene ontology: tool for the unification of biology The Gene Ontology Consortium. Nat Genet. 2000;25:25–29. - PMC - PubMed
Publication types
MeSH terms
Substances
Associated data
- Actions
Grants and funding
LinkOut - more resources
Full Text Sources
Other Literature Sources
Molecular Biology Databases
