Review
. 2014 Jun 17:8:161.
doi: 10.3389/fncel.2014.00161. eCollection 2014.

Structure, function, and plasticity of GABA transporters

Affiliations
Review

Structure, function, and plasticity of GABA transporters

Annalisa Scimemi. Front Cell Neurosci. .

Abstract

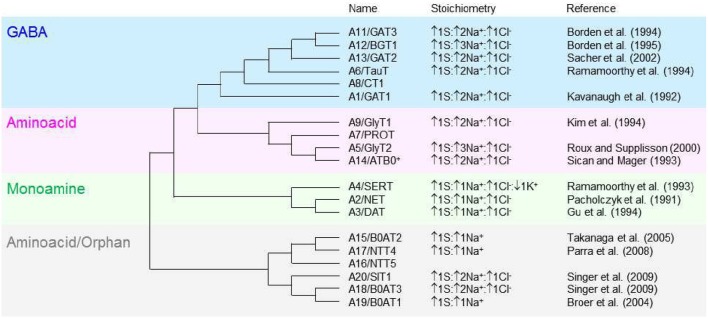
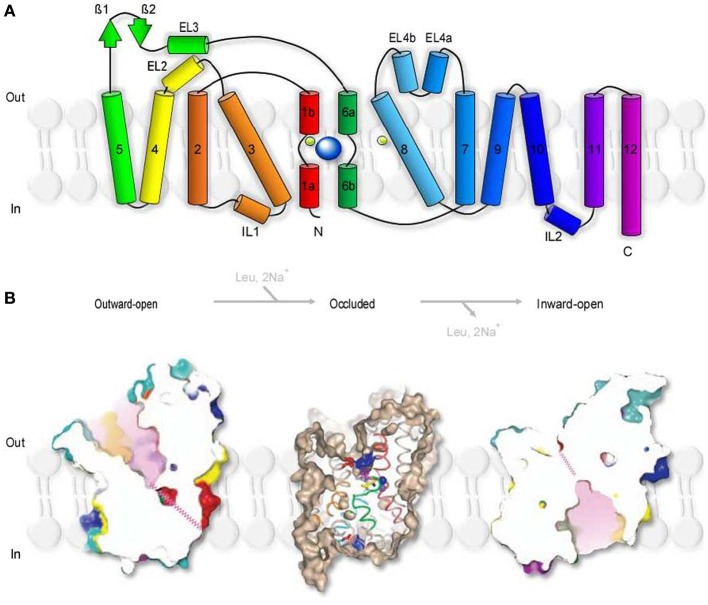
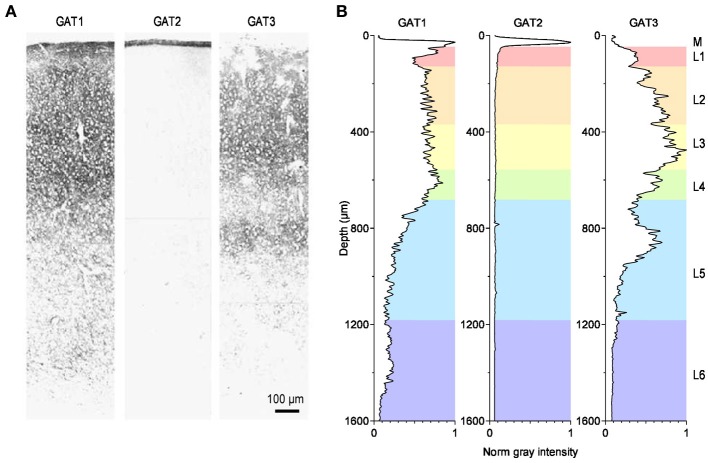
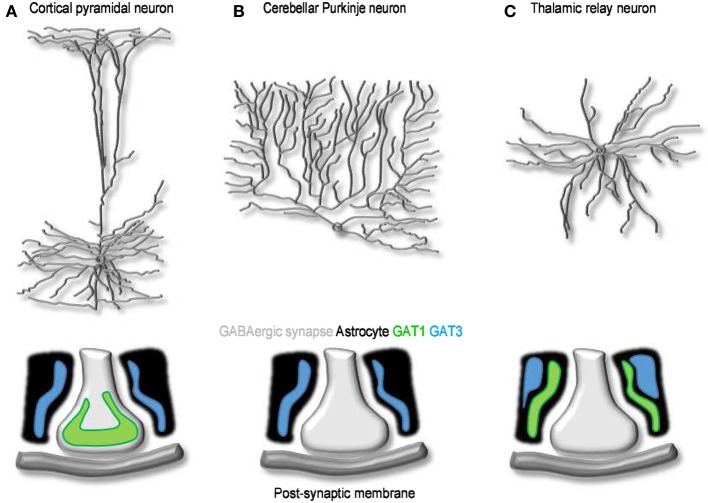
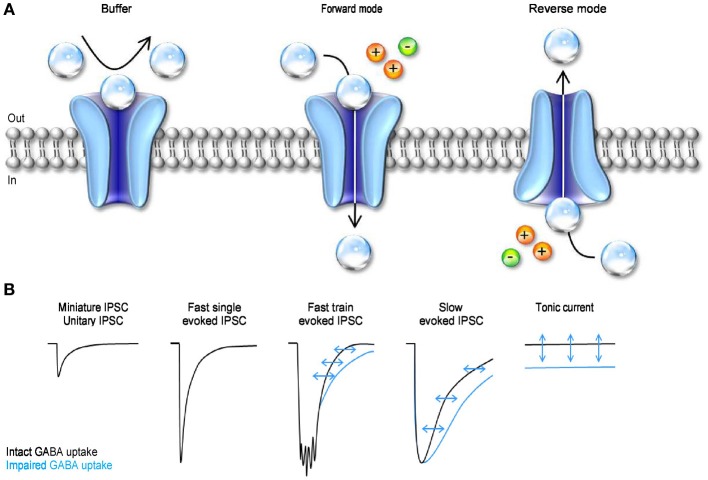
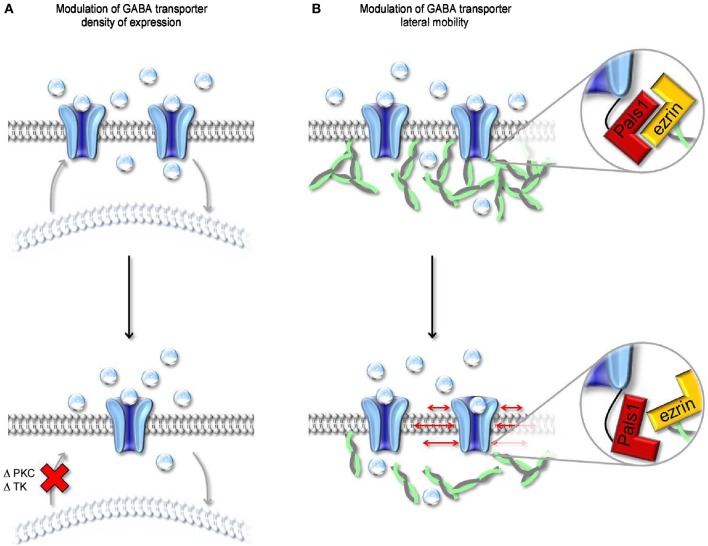
GABA transporters belong to a large family of neurotransmitter:sodium symporters. They are widely expressed throughout the brain, with different levels of expression in different brain regions. GABA transporters are present in neurons and in astrocytes and their activity is crucial to regulate the extracellular concentration of GABA under basal conditions and during ongoing synaptic events. Numerous efforts have been devoted to determine the structural and functional properties of GABA transporters. There is also evidence that the expression of GABA transporters on the cell membrane and their lateral mobility can be modulated by different intracellular signaling cascades. The strength of individual synaptic contacts and the activity of entire neuronal networks may be finely tuned by altering the density, distribution and diffusion rate of GABA transporters within the cell membrane. These findings are intriguing because they suggest the existence of complex regulatory systems that control the plasticity of GABAergic transmission in the brain. Here we review the current knowledge on the structural and functional properties of GABA transporters and highlight the molecular mechanisms that alter the expression and mobility of GABA transporters at central synapses.

Keywords: GABA; GABA transporters; GAT1; GAT3; SLC6; synaptic plasticity; synaptic transmission; uptake.


Figures

Figure 1
Figure 1
Molecular phylogenetic analysis of the SLC6 neurotransmitter transporter family in Homo sapiens. The SLC6 family is divided into four groups, including the GABA (blue), aminoacid (pink), monoamine (green) and aminoacid/orphan transporters (gray). The evolutionary history is inferred by using the maximum likelihood method based on the JTT matrix-based model (Jones et al., 1992). The initial tree for the heuristic search is obtained automatically by applying neighbor-join and BioNJ algorithms to a matrix of pairwise distances estimated using a JTT model, and then selecting the topology with superior log likelihood value. The analysis is performed on 19 aminoacid sequences because the gene encoding the SLC6A10 transporter is thought to be a pseudogene (Kristensen et al., 2011). All positions containing gaps and missing data were eliminated. There is a total of 372 positions in the final dataset. The evolutionary analysis is obtained with MEGA5 (Tamura et al., 2011). The tree is not drawn to scale; it includes the SLC and the commonly used neurotransmitter transporter nomenclature. The stoichiometry and direction of the transport cycle are included, when known, together with the corresponding reference.
Figure 2
Figure 2
Secondary structure and surface representation of LeuTAa. (A) Topology of Aquifex aeolicus LeuTAa. The transporter is composed of 12 trans-membrane regions (TM1-12), with cytoplasmic N- and C-terminal domains. TM1 and TM6 are oriented antiparallel to one another and have breaks in their helical structure approximately halfway across the membrane bilayer. The transporter has two extracellular β-strands (green arrows), four extracellular (EL2, 3, 4a, 4b) and two intracellular helices (IL1, 2). The co-transported Na+ are depicted as two light green spheres. The substrate molecule (Leu), is depicted as a bigger blue sphere that binds to unwound regions in TM1 and TM6. Modified from (Yamashita et al., 2005). (B) Slice through the surface representation of LeuTAa in the Leu-free, Na+-bound outward-open conformation (left), in the occluded conformation where the Leu- and Na+-binding sites are occluded from solution in the extracellular and cytoplasmic sides (middle) and in the inward-open conformation (right). The zig-zag pink lines indicate closed intracellular pathways. Modified from (Yamashita et al., 2005) and (Krishnamurthy and Gouaux, 2012).
Figure 3
Figure 3
Distribution of GABA transporters in the rat somato-sensory cortex. (A) Immunohistochemical labeling for the GABA transporters GAT1 (left), GAT2 (middle) and GAT3 (right) in the primary somato-sensory cortex of the adult rat. Modified from (Conti et al., 2004). (B) Image analysis of the immunohistochemical labeling for GAT1-3. The diagrams provide a measure of the normalized, average gray value distribution measured over the entire area of the images shown in panel A. The data are normalized by the maximum gray value measured in each image. Therefore, the darkest areas, with the most intense labeling, have a normalized gray intensity value of 1. The letters on the right hand side of the figure indicate the meningeal (M) and the six cortical layers (L1–6). The gray value analysis was done using the Fiji image processing package (Schindelin et al., 2012). The rest of the analysis was performed using custom-made routines written in Igor Pro (Wavemetrics).
Figure 4
Figure 4
The cellular and sub-cellular distribution of GABA transporters. (A) Schematized morphology of cortical pyramidal neuron (top) and of the distribution of GAT1 (green) and GAT3 (blue) at synaptic contacts onto these cells (bottom). (B,C) As in A, for Purkinje (B) and thalamic relay neurons (C). At GABAergic synapses onto cortical neurons, GAT1 and GAT3 are expressed mainly in pre-synaptic terminals and in neighboring astrocytic processes, respectively. Purkinje neurons lack neuronal GABA transporters; Bergmann glia cells express GAT3. GABA uptake at synaptic contacts onto thalamic relay neurons is mediated by GAT1 and GAT3. Both transporters are located in astrocytes: GAT1 is located closer to the synapse and clears GABA released during phasic events; GAT3 is located further away and regulates the basal, tonic GABA concentration in the extracellular space (Beenhakker and Huguenard, 2010).
Figure 5
Figure 5
The mode of action and functional effect of GABA transporters on synaptic transmission. (A) Schematic representation of the three different modes of action of GABA transporters. GABA molecules (transparent spheres) can be rapidly bound by GABA transporters. Not all the GABA molecules that are bound by the transporters are also translocated across the cell membrane. Under these conditions, the transporters act as buffers (left). GABA uptake is coupled to the movement of Na+ (orange sphere) and Cl (green sphere) across the membrane. In forward mode, GABA transporters remove GABA from the extracellular space (middle). GABA transporters can operate in revered mode (i.e. release GABA in the extracellular space) if the driving force for Na+/Cl favors the movement of these ions outside the cell, and if the intracellular concentration of GABA is sufficiently high to be bound by the transporters (right). (B) Schematic representation of the effects of GABA uptake on small, fast, coincident and tonic GABAergic currents. The black traces represent currents recorded in control conditions, with GABA uptake intact. The blue traces represent currents recorded when GABA transporters are blocked.
Figure 6
Figure 6
Modulation of surface expression and lateral mobility of GABA transporters. (A) Schematic representation of changes in cell surface expression of GABA transporters evoked by altering the activity of PKC and/or tyrosine kinase (TK). Both kinases regulate the trafficking of GABA transporters from intracellular organelles (light, curved lipid bilayer) to the cell membrane (dark, flat lipid bilayer). A reduction in the rate of cell membrane insertion (bottom) leads to a decrease in the cell surface expression of GABA transporters. (B) Schematic representation of the molecular interactions mediating anchoring of GABA transporters to the actin cytoskeleton. The MAGUK protein Pals1 mediates the interaction between the C-terminal of GABA transporters and ezrin, an adaptor protein that interacts with actin. Disruption of the interaction between Pals1 and ezrin leads to an increased lateral mobility of GABA transporters in the cell membrane.

References

    1. Abramson J., Wright E. M. (2009). Structure and function of Na(+)-symporters with inverted repeats. Curr. Opin. Struct. Biol. 19, 425–432 10.1016/j.sbi.2009.06.002 - DOI - PMC - PubMed
    1. Akam T., Kullmann D. M. (2010). Oscillations and filtering networks support flexible routing of information. Neuron 67, 308–320 10.1016/j.neuron.2010.06.019 - DOI - PMC - PubMed
    1. Alger B. E., Nicoll R. A. (1982). Pharmacological evidence for two kinds of GABA receptor on rat hippocampal pyramidal cells studied in vitro. J. Physiol. 328, 125–141 - PMC - PubMed
    1. Allen N. J., Rossi D. J., Attwell D. (2004). Sequential release of GABA by exocytosis and reversed uptake leads to neuronal swelling in simulated ischemia of hippocampal slices. J. Neurosci. 24, 3837–3849 10.1523/JNEUROSCI.5539-03.2004 - DOI - PMC - PubMed
    1. Androutsellis-Theotokis A., Goldberg N. R., Ueda K., Beppu T., Beckman M. L., Das S., et al. (2003). Characterization of a functional bacterial homologue of sodium-dependent neurotransmitter transporters. J. Biol. Chem. 278, 12703–12709 10.1074/jbc.M206563200 - DOI - PubMed