. 2014 Jun 17:5:225.
doi: 10.3389/fphys.2014.00225. eCollection 2014.

The impact of flow-induced forces on the morphogenesis of the outflow tract

Affiliations

The impact of flow-induced forces on the morphogenesis of the outflow tract

Stefanie V Biechler et al. Front Physiol. .

Abstract

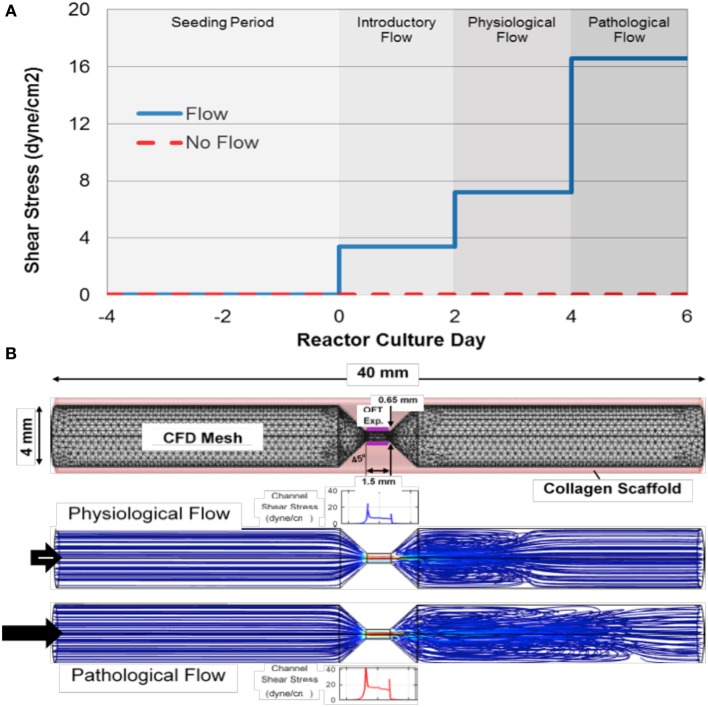
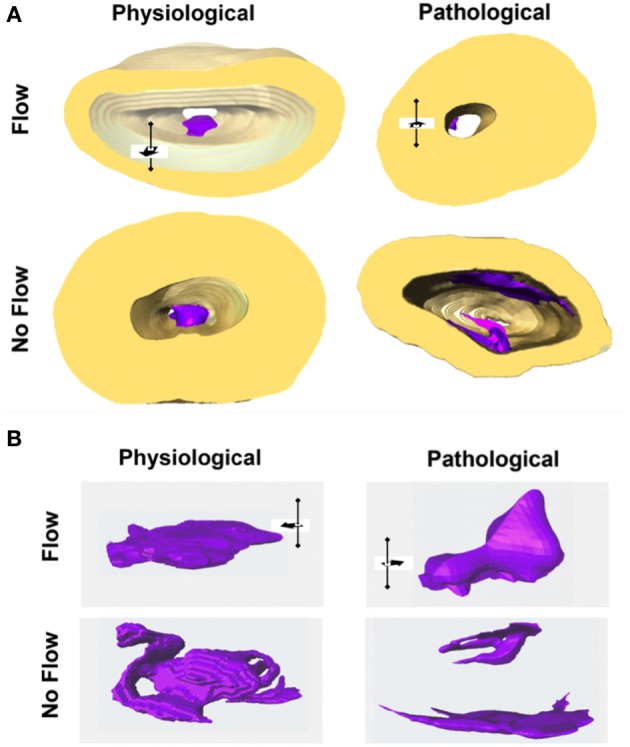
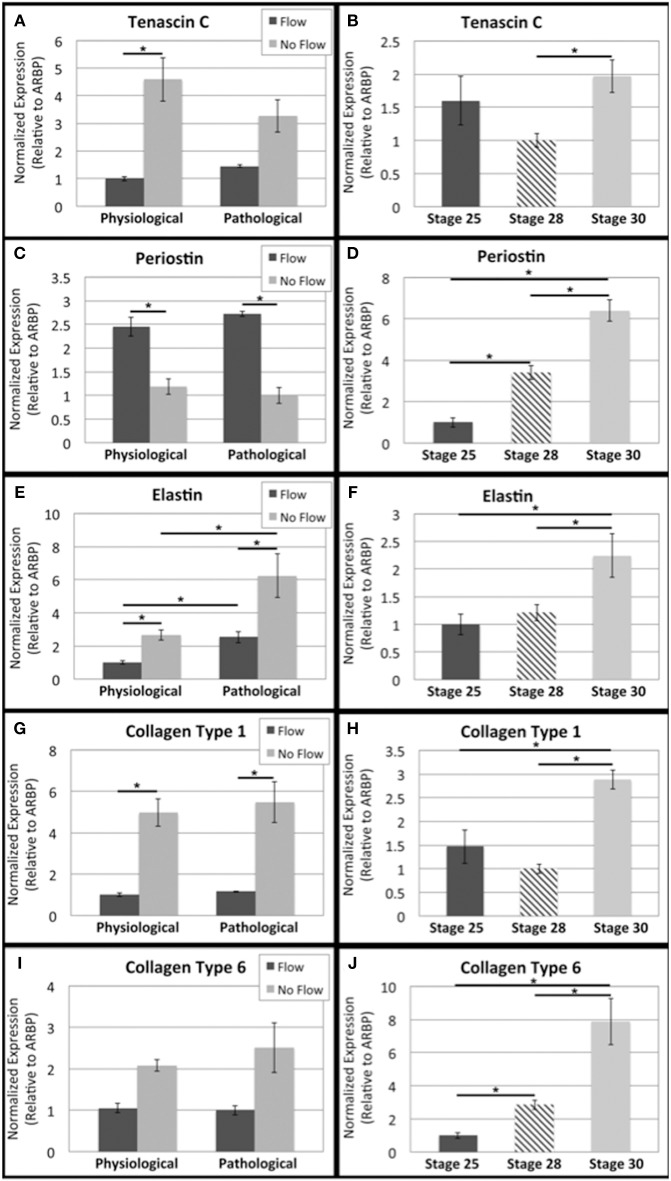
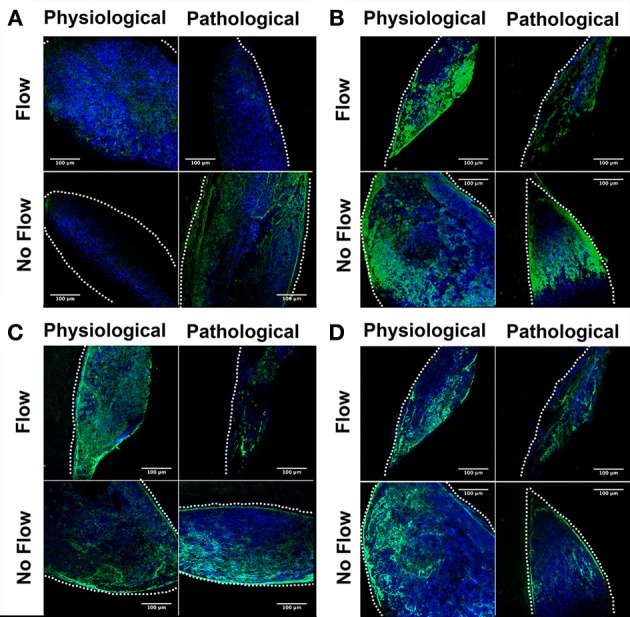
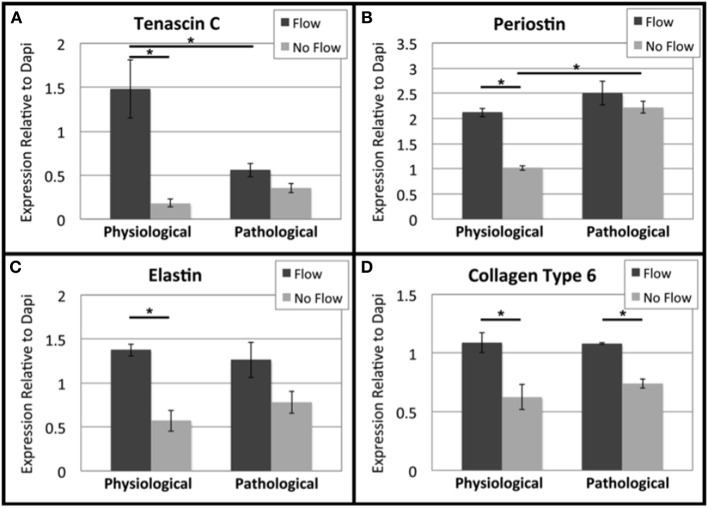
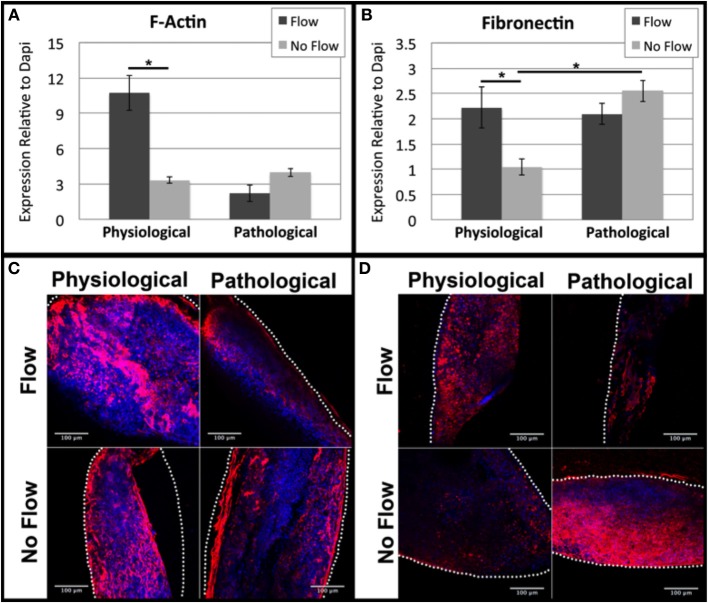
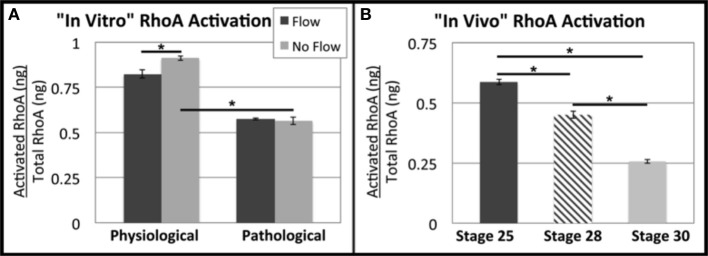
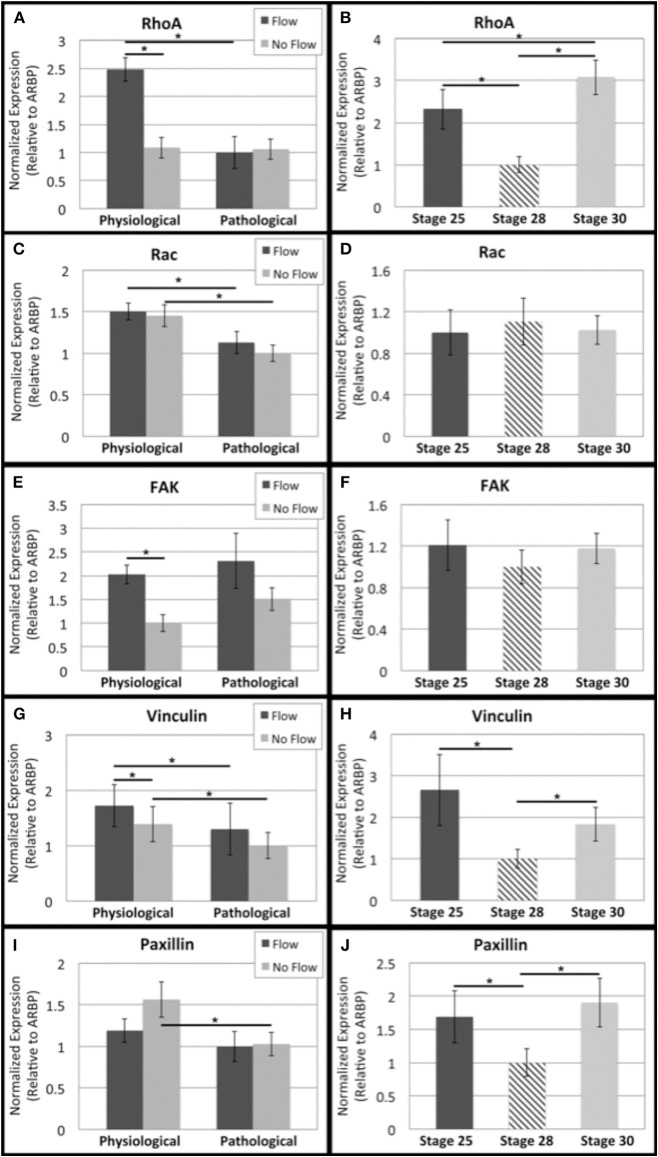
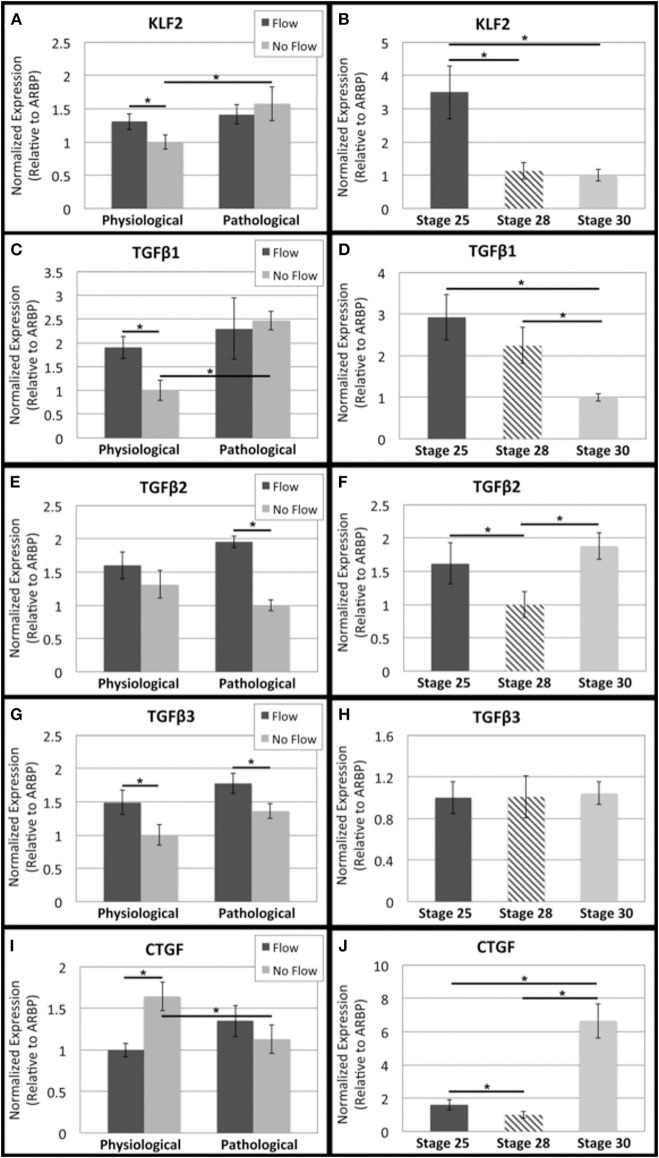
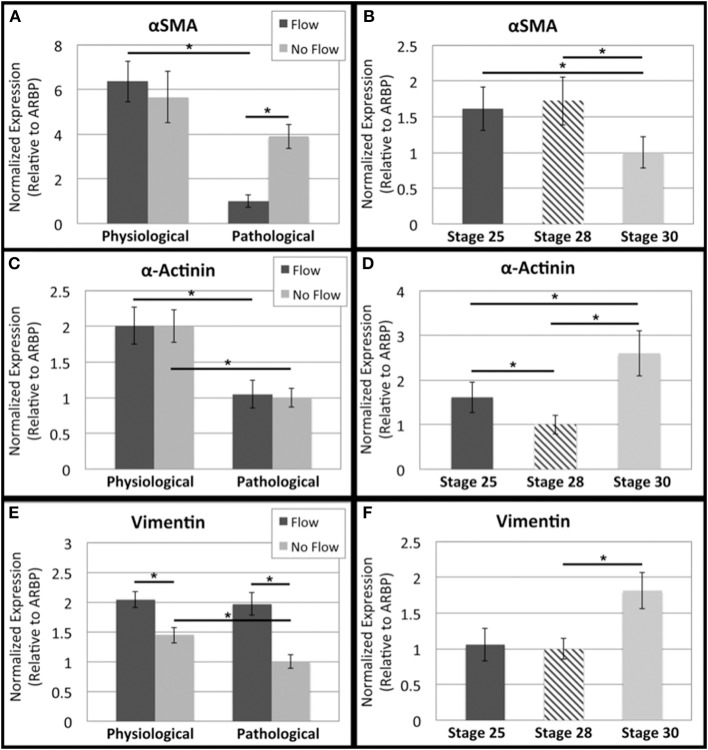
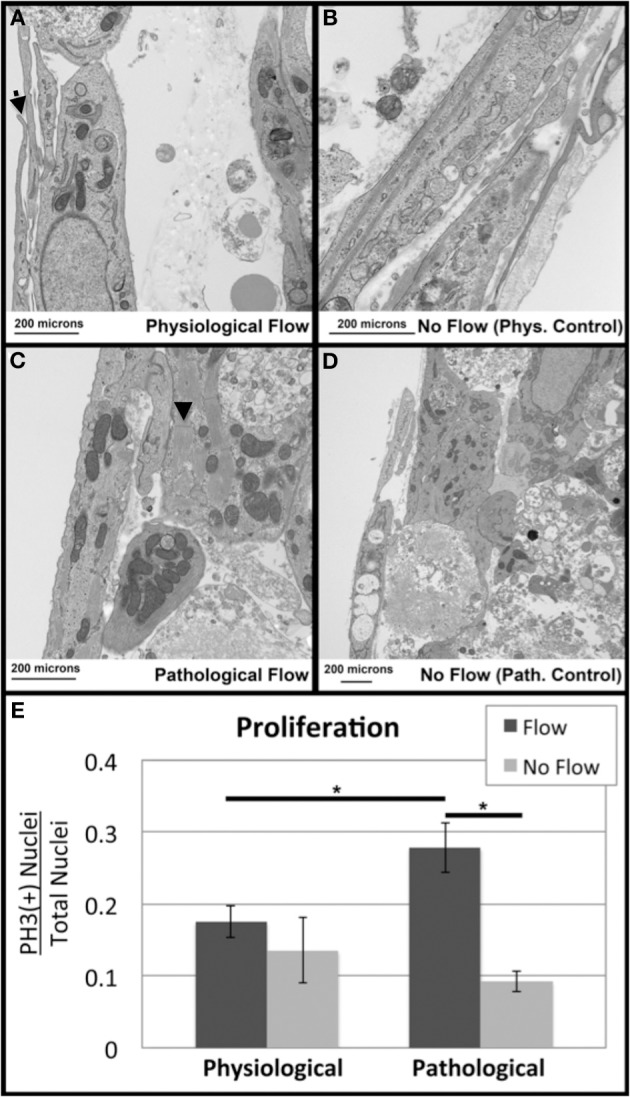
One percent of infants are born with congenital heart disease (CHD), which commonly involves outflow tract (OFT) defects. These infants often require complex surgeries, which are associated with long term adverse remodeling effects, and receive replacement valves with limited strength, biocompatibility, and growth capability. To address these problematic issues, researchers have carried out investigations in valve development and valve mechanics. A longstanding hypothesis is that flow-induced forces regulate fibrous valve development, however, the specific mechanisms behind this mechanotransduction remain unclear. The purpose of this study was to implement an in vitro system of outflow tract development to test the response of embryonic OFT tissues to fluid flow. A dynamic, three-dimensional bioreactor system was used to culture embryonic OFT tissue under different levels of flow as well as the absence of flow. In the absence of flow, OFT tissues took on a more primitive phenotype that is characteristic of early OFT cushion development where widely dispersed mesenchymal cells are surrounded by a sparse, disorganized extracellular matrix (ECM). Whereas OFT tissues subjected to physiologically matched flow formed compact mounds of cells, initated, fibrous ECM development, while prolonged supraphysiological flow resulted in abnormal tissue remodeling. This study indicates that both the timing and magnitude of flow alter cellular processes that determine if OFT precursor tissue undergoes normal or pathological development. Specifically, these experiments showed that flow-generated forces regulate the deposition and localization of fibrous ECM proteins, indicating that mechanosensitive signaling pathways are capable of driving pathological OFT development if flows are not ideal.

Keywords: bioreactor; fibrotic development; hemodynamics; mechanotransduction; outflow tract.


Figures

Figure 1
Figure 1
Experimental design for flow-cultured outflow tract explants in molded scaffolds. (A) The total outflow tract (OFT) explant culture period (from time of dissection) was 8 days in the physiological case and 10 days in the pathological case. After the 4 day seeding period, a 2 day introductory flow period was used before flow was ramped to sub-physiological. After the 2 day introductory period, some flow groups and no flow controls were removed and some remained on for an additional 2 days under physiological levels of flow. These final flow groups, and no flow controls, were then removed. (B) To determine the flow needed to achieve physiological or pathological levels wall shear stress at the center of the channel for outflow tract (OFT) explants (Purple), a 3-dimensional computational fluid dynamics (CFD) model was generated with precise geometry. Note the high fluid velocity in the seeding channel (red streamlines) and eddy formation downstream of the channel.
Figure 2
Figure 2
Flow affects outflow tract explant morphology. (A) All outflow tract (OFT) sample groups were three-dimensionally reconstructed with labeled scaffold (gold) and explant tissue (purple). (B) Physiological flow groups exhibited a mound shape while pathological flow groups exhibited a smaller, leaflet morphology. In the case of no flow, tissue formed a loose network and occluded the lumen of the flow channel (comparisons are not to scale). Flow direction is indicated by the black arrow in three dimensional space.
Figure 3
Figure 3
Flow affects fibrous extracellular matrix protein transcript levels in outflow tract. Quantitative Real Time PCR was performed on the four culture groups and on freshly dissected outflow cushions (OFCs) at three stages in development (HH stage 25, 28, and 30). (A,B) Tenascin C transcript level was higher in the absence of flow and increases between HH stage 28 and 30. (C,D) Periostin transcript level was higher in the presence of flow and appears to steadily increase from HH stage 25 to 30. (E,F) Elastin transcript level was higher in the absence of flow and in pathological groups and transcript level appears to increase between HH stage 28 and 30. (G,H) Type 1 collagen (Col1) transcript level was higher in the absence of flow with no difference between physiological and pathological groups. Col1 transcript appears to increase at HH stage 30. (I,J) Type 6 collagen (Col6) followed a similar trend to Col1 but with no statistical significance and Col6 transcript levels appear to steady increase from HH stage 25 to 30. (*P < 0.05).
Figure 4
Figure 4
Flow affects fibrous extracellular matrix protein localization in outflow tract. Outflow tract (OFT) explant samples were stained with Dapi (blue) or for several hallmark extracellular matrix (ECM) proteins (green): (A) Tenascin C (B) Periostin (C) Elastin (D) Type 6 Collagen (Col6). In all no flow controls, ECM staining was throughout the tissue network, with a greater staining concentration at the scaffold interface. In each case of flow, tenascin C, periostin, and Col6 were localized toward the inlet side of the cushion (A,B,D) while elastin staining presented throughout the cushions with greater concentration on the outlet side. Scale bars are all 100 μm. The dotted lines indicate the scaffold wall.
Figure 5
Figure 5
Flow affects fibrous extracellular matrix protein expression in outflow tract. Confocal microscopy was performed for outflow tract (OFT) explants at the same settings and the mean fluorescence intensity of each fibrous extracellular matrix (ECM) protein was analyzed relative to Dapi staining. Expression quantifications were averaged for each of the four culture groups. (A) Tenascin C was upregulated under physiological flow compared to the no flow control and pathological flow. (B) Periostin was upregulated under physiological flow compared to the no flow control. The extended no flow culture period also appeared to upregulate periostin. (C) Elastin was upregulated under physiological flow compared to the no flow control and no differences were seen between physiological and pathological groups. (D) Col6 followed a similar trend to elastin. (*P < 0.05).
Figure 6
Figure 6
Flow affects cytoskeletal actin and extracellular fibronectin in OFT cells. Mean fluorescence intensity relative to Dapi was quantified from confocal imaging under the same setting for each outflow tract (OFT) explant culture group. (A) F-actin expression was upregulated under physiological flow compared to no flow controls. (B) Fibronectin expression was upregulated under physiological flow compared to no flow controls and extended no flow culture time appeared to upregulate expression. (C) F-Actin and (D) fibronectin expression both exhibited diffuse staining in all sample groups with increased concentration at the scaffold-tissue interface. Scale bars are all 100 μm. The dotted lines indicate the scaffold wall. (*P < 0.05).
Figure 7
Figure 7
Flow alters RhoA activation in outflow tract explants. Total RhoA and active (GTP-bound) RhoA ELISAs were performed to quantify the ratio of active vs. total RhoA. (A) In the physiological group, more RhoA appeared to be activated in the absence of flow (no flow control), and RhoA activation was decreased in the pathological groups. (B) RhoA activity appears to decrease steadily from HH stage 25 to 30. (*P < 0.05).
Figure 8
Figure 8
Flow affects adhesion signaling transcript levels in outflow tract. Quantitative Real Time PCR was performed on the four culture groups and on freshly dissected outflow cushions (OFCs) at three stages in development (HH stage 25, 28, and 30). (A,B) RhoA transcript level was higher under physiological levels of flow and appears to decrease from HH stage 25 to 28 and increase from HH stage 28 to 30. (C,D) Rac transcript level was higher in the physiological sample groups (flow and no flow control) and no significant differences were seen from HH stage 25 to 30. (E,F) FAK transcript level was higher in the case of flow and no significant differences were seen from HH stage 25 to 30. (G,H) Vinculin transcript level was higher for each flow case compared to no flow controls and transcript was greater in the physiological groups compared to the pathological groups. Transcript appears to, like RhoA, decrease from HH stage 25 to 28 and increase from HH stage 28 to 30. (I,J) Paxillin transcript level decreased with no flow culture time and appears to follow the same trend as RhoA and vinculin from HH stage 25 to 30. (*P < 0.05).
Figure 9
Figure 9
Flow affects shear-responsive signaling transcript levels in outflow tract. Quantitative Real Time PCR was performed on the four culture groups and on freshly dissected outflow cushions (OFCs) at three stages in development (HH stage 25, 28, and 30). (A,B) KLF2 transcript level was higher in the absence of flow and increased with increased static culture time. Transcript appears to decrease between HH stage 25 and 28. (C,D) TGFβ1 transcript level was higher in the presence of physiological flow compared to the no flow control. TGFβ1 transcript steadily decreases from HH stage 25 to 30. (E,F) TGFβ2 transcript level was higher in the presence of flow and appears to decrease from HH stage 25 to 28 and then increase from HH stage 28 and 30. (G,H) TGFβ3 transcript level was higher in the presence of flow with no difference between physiological and pathological groups. Transcript amount does not appear to change from HH stage 25 to 30. (I,J) CTGF transcript level was highest in the physiological no flow control group and appears to increase from HH stage 28 to 30. (*P < 0.05).
Figure 10
Figure 10
Flow affects cytoskeleton remodeling transcript levels in outflow tract. Quantitative Real Time PCR was performed on the four culture groups and on freshly dissected outflow cushions (OFCs) at three stages in development (HH stage 25, 28, and 30). (A,B) αSMA transcript level was highest in the presence of physiological flow and appears to decrease between HH stage 28 and 30. (C,D) α-Actinin transcript level was the same between flow groups and their controls, but transcript was greater in the physiological groups. Transcript appears decrease from HH stage 25 to 28 and increase from HH stage 28 to 30. (E,F) Vimentin transcript level was higher in the presence of flow and appears to increase from HH stage 28 to 30. (*P < 0.05).
Figure 11
Figure 11
Flow alters outflow tract explant cell death and proliferation. Transmission Electron Microscopy was performed to investigate subcellular architecture. All samples contained myocyte cells as indicated by the presence of sarcomeres (arrowheads) and centrally located nuclei (A) Samples subjected to physiological flow exhibited an endothelial layer lining the flow side of the cushion, as well as ECM deposition and membranous protrusions (arrow). (B) Physiological no flow controls had some dead cell debris beneath the luminal cell layer. (C) Pathological flow groups did not show a luminal endothelial layer but showed MCs surrounded by ECM and cell debris. (D) Pathological no flow controls were similar to physiological no flow controls. Scale bars are all 200 μm. (E) Confocal microscopy was performed on sample groups for P-Histone H3 as a proliferative marker. P-Histone H3 (+) nuclei relative to total nuclei (Dapi) were quantified and indicated increase proliferation in the case of pathological flow. (*P < 0.05).

Similar articles

Cited by

References

    1. Armstrong E. J., Bischoff J. (2004). Heart valve development: endothelial cell signaling and differentiation. Circ. Res. 95, 459–470 10.1161/01.RES.0000141146.95728.da - DOI - PMC - PubMed
    1. Asparuhova M. B., Gelman L., Chiquet M. (2009). Role of the actin cytoskeleton in tuning cellular responses to external mechanical stress. Scand. J. Med. Sci. Sports 19, 490–499 10.1111/j.1600-0838.2009.00928.x - DOI - PubMed
    1. Combs M. D., Yutzey K. E. (2009). Heart valve development: regulatory networks in development and disease. Circ. Res. 105, 408–421 10.1161/CIRCRESAHA.109.201566 - DOI - PMC - PubMed
    1. de Vlaming A., Sauls K., Hajdu Z., Visconti R. P., Mehesz A. N., Levine R. A., et al. (2012). Atrioventricular valve development: new perspectives on an old theme. Differentiation 84, 103–116 10.1016/j.diff.2012.04.001 - DOI - PMC - PubMed
    1. Egorova A. D., Khedoe P. P., Goumans M. J., Yoder B. K., Nauli S. M., ten Dijke P., et al. (2011). Lack of primary cilia primes shear-induced endothelial-to-mesenchymal transition. Circ. Res. 108, 1093–1101 10.1161/CIRCRESAHA.110.231860 - DOI - PMC - PubMed

LinkOut - more resources