. 2014 May 28:6:30.
doi: 10.1186/1758-2946-6-30. eCollection 2014.

Estimation of diffusion coefficients from voltammetric signals by support vector and gaussian process regression

Affiliations

Estimation of diffusion coefficients from voltammetric signals by support vector and gaussian process regression

Martin Bogdan et al. J Cheminform. .

Abstract

Background: Support vector regression (SVR) and Gaussian process regression (GPR) were used for the analysis of electroanalytical experimental data to estimate diffusion coefficients.

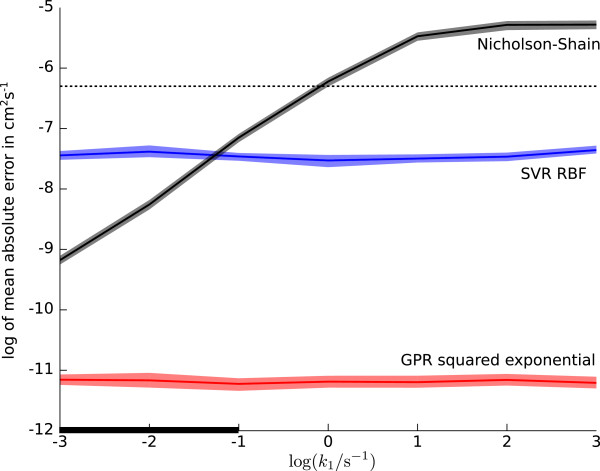
Results: For simulated cyclic voltammograms based on the EC, Eqr, and EqrC mechanisms these regression algorithms in combination with nonlinear kernel/covariance functions yielded diffusion coefficients with higher accuracy as compared to the standard approach of calculating diffusion coefficients relying on the Nicholson-Shain equation. The level of accuracy achieved by SVR and GPR is virtually independent of the rate constants governing the respective reaction steps. Further, the reduction of high-dimensional voltammetric signals by manual selection of typical voltammetric peak features decreased the performance of both regression algorithms compared to a reduction by downsampling or principal component analysis. After training on simulated data sets, diffusion coefficients were estimated by the regression algorithms for experimental data comprising voltammetric signals for three organometallic complexes.

Conclusions: Estimated diffusion coefficients closely matched the values determined by the parameter fitting method, but reduced the required computational time considerably for one of the reaction mechanisms. The automated processing of voltammograms according to the regression algorithms yields better results than the conventional analysis of peak-related data.

Keywords: Diffusion coefficient; Gaussian process regression; Principal component analysis; Reaction mechanism; Support vector regression; Voltammetry.


Figures

Figure 1
Figure 1
Loss functions.A: Quadratic loss. B: ε-insensitive linear loss. C: ε-insensitive quadratic loss.
Figure 2
Figure 2
Example cyclic voltammogram. The forward peak, half peak, and reverse peak potentials (Epfor, Ep/2, Eprev), and currents (ipfor, ip/2, iprev), which are used to calculate the manually extracted features are indicated.
Figure 3
Figure 3
Variation of the dimensionless peak currentπχp with the dimensionless rate constantκ1 for the EC reaction mechanism. The dimensionless peak current πχp is constant only for very small (log(κ1) < −3) and very large (log(κ1) > 4) values of the rate constant. In the former case, the limiting value of 0.4463 is approached; for an explanation of the black bar on the abscissa, see text, Section “EC mechanism — dependence on k1”.
Figure 4
Figure 4
Distributions of absolute errors on a logarithmic scale for estimated diffusion coefficients in cm2 s-1 on the test data sets for simulations for EC, Eqr, and EqrC mechanisms. Black horizontal bars indicate the mean of the error distributions. The SVR and GPR algorithms used PCA preprocessing.
Figure 5
Figure 5
Distributions of absolute errors on a logarithmic scale for diffusion coefficients in cm2 s-1 estimated on the test data sets for simulated mechanisms EC, Eqr, and EqrC. Black horizontal bars indicate the mean of the error distributions.
Figure 6
Figure 6
Mean of the absolute error, on a logarithmic scale, for diffusion coefficients determined by SVR with RBF kernel, GPR with squared exponential covariance function, and the Nicholson-Shain equation approach for the EC mechanism depending on the rate constantk1. Shading around curves indicates 95% confidence intervals for the mean. The dotted line indicates the spacing used for the diffusion coefficients in the simulated data; PCA preprocessing was used for predicting coefficients with SVR and GPR.
Figure 7
Figure 7
Mean of the absolute error, on a logarithmic scale, for diffusion coefficients determined by SVR with RBF kernel, GPR with squared exponential covariance function and the Nicholson-Shain equation for the Eqr mechanism depending on the rate constantks. Shading around curves represent 95% confidence intervals for the mean. The dotted line indicates the spacing used for the diffusion coefficients in the simulated data; PCA preprocessing was used for predicting coefficients with SVR and GPR.
Figure 8
Figure 8
Contour plots showing the dependence the average absolute error on the rate constantsk1 andks (EqrC mechanism) on a logarithmic scale in cm2 s-1. The average absolute error is calculated between estimated and true diffusion coefficients.
Figure 9
Figure 9
Chemical structures of compounds 1, 2a, and 2b for which data were analyzed in this work.
Figure 10
Figure 10
Experimental cyclic voltammograms for complexes 1, 2a, 2b (from left to right), indicated by solid lines, for a scan rate of 0.5 V s-1 and initial concentrations of 0.2, 0.4, 0.6, 0.8 mM. Electroactive area: A=0.064 cm 2; potential values vs. a Ag/Ag + reference electrode [22,54]; the simulated cyclic voltammograms which are the result of the parameter fitting process are indicated by dashed lines.
Figure 11
Figure 11
CPU time in minutes required by the parameter fitting method, and the regression algorithms for the three organometallic complexes 1, 2a, and 2b. Hatched bars indicate the portion of time required by the SVR and GPR algorithm without the simulations. All measurements were made on an INTEL®; XEON®; 5150 processor with 2.66 GHz and 8 GB of main memory.

References

    1. Nicholson RS, Shain I. Theory of stationary electrode polarography. Single scan and cyclic methods applied to reversible, irreversible, and kinetic systems. 1964. pp. 706–723.
    1. Heinze J. Cyclovoltammetrie — die “Spektroskopie” des Elektrochemikers. Angew Chem. 1984;96:823–840. Cyclic Voltammetry — the “Spectroscopy” of the Electrochemist. Angew Chem Int Ed Engl 1984, 23:831–847.
    1. Economou A, Bolis SD, Efstathiou CE, Volikakis GJ. A “virtual” electroanalytical instrument for square wave voltammetry. Anal Chim Acta. 2002;467:179–188.
    1. Speiser B. In: Encyclopedia of Electrochemistry, Vol. 8 Organic Electrochemistry, Chap. 1. Bard AJ, Stratmann M, Schäfer HJ, editor. Weinheim: Wiley-VCH; 2004. Methods to investigate mechanisms of electroorganic reactions; pp. 1–23.
    1. Venton BJ, Wightman RM. Psychoanalytical electrochemistry: Dopamine and behavior. Anal Chem. 2003;75:414A–421A.

LinkOut - more resources