. 2014 Jul 1:3:7.
doi: 10.1186/2046-2530-3-7. eCollection 2014.

Loss of primary cilia occurs early in breast cancer development

Affiliations

Loss of primary cilia occurs early in breast cancer development

Ina Menzl et al. Cilia. .

Abstract

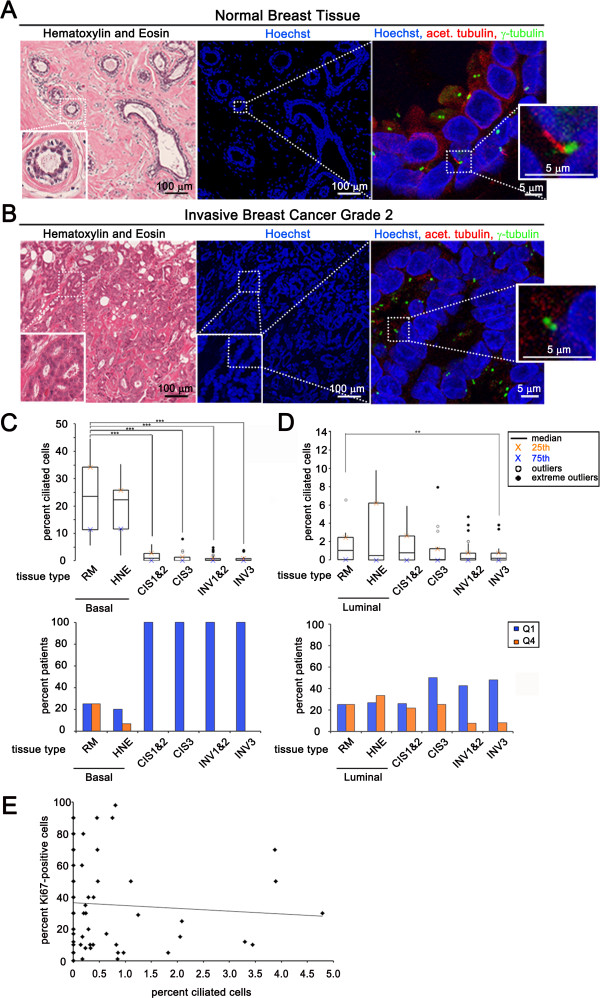
Background: Primary cilia are microtubule-based organelles that protrude from the cell surface. Primary cilia play a critical role in development and disease through regulation of signaling pathways including the Hedgehog pathway. Recent mouse models have also linked ciliary dysfunction to cancer. However, little is known about the role of primary cilia in breast cancer development. Primary cilia expression was characterized in cancer cells as well as their surrounding stromal cells from 86 breast cancer patients by counting cilia and measuring cilia length. In addition, we examined cilia expression in normal epithelial and stromal cells from reduction mammoplasties as well as histologically normal adjacent tissue for comparison.

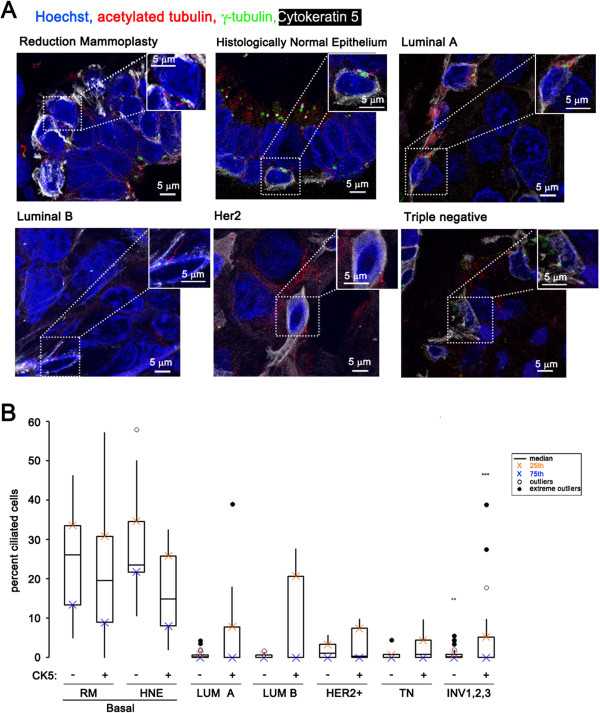
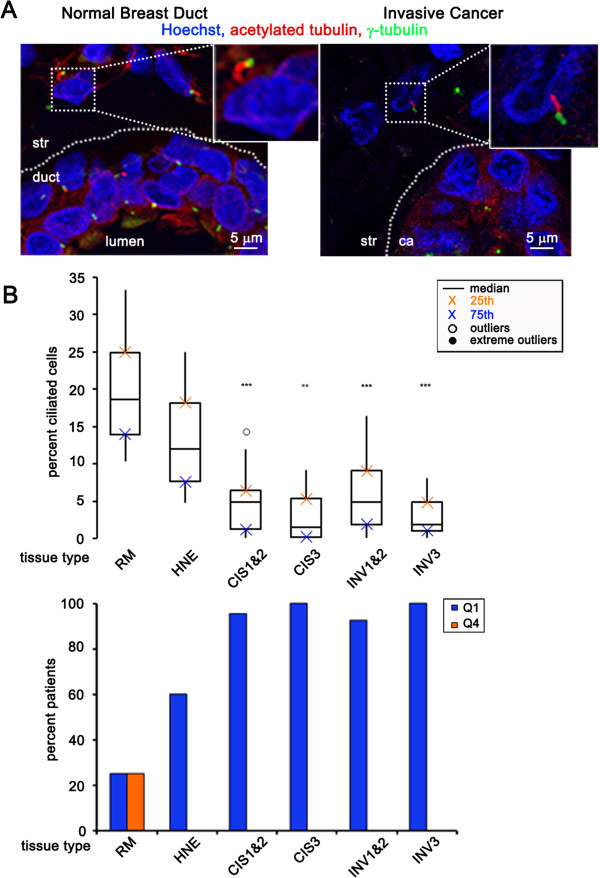
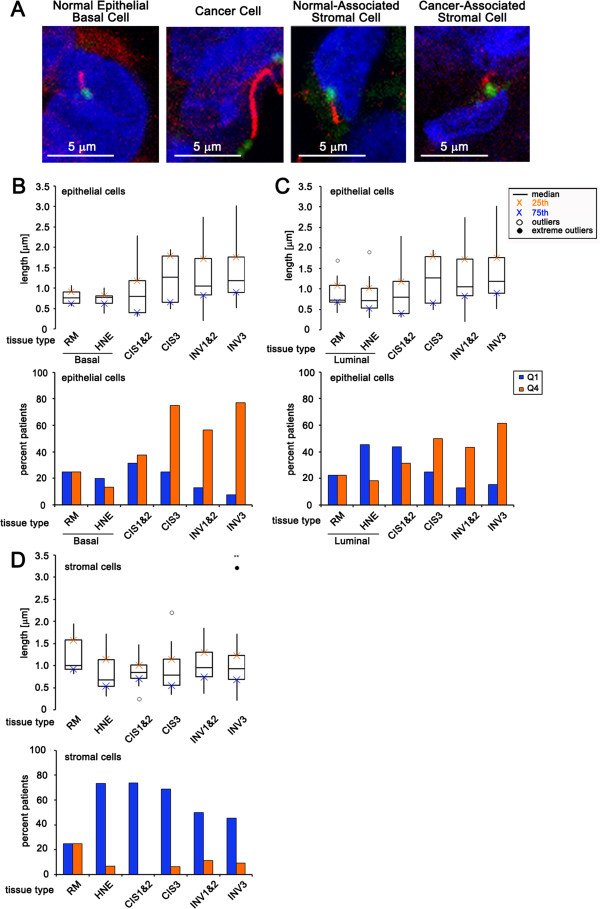
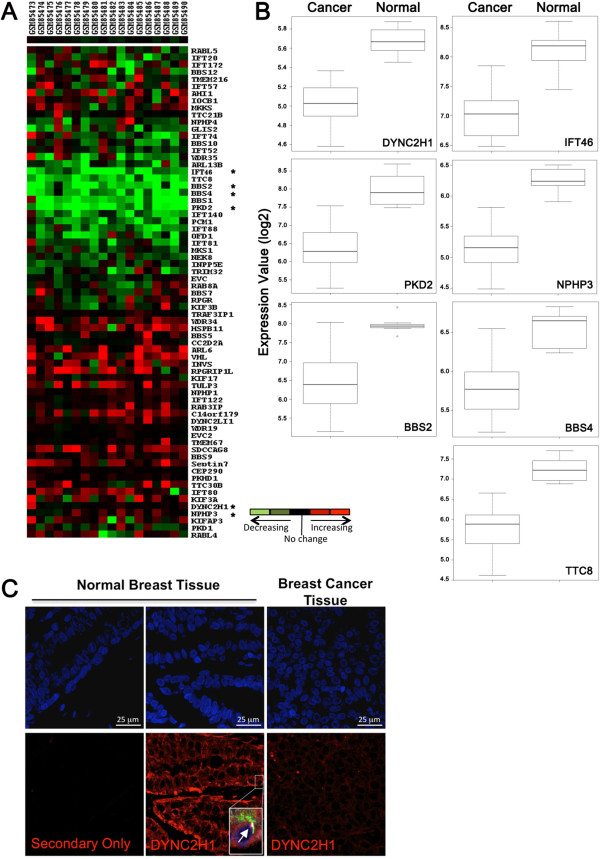
Results: We observed a statistically significant decrease in the percentage of ciliated cells on both premalignant lesions as well as in invasive cancers. This loss of cilia does not correlate with increased proliferative index (Ki67-positive cells). However, we did detect rare ciliated cancer cells present in patients with invasive breast cancer and found that these express a marker of basaloid cancers that is associated with poor prognosis (Cytokeratin 5). Interestingly, the percentage of ciliated stromal cells associated with both premalignant and invasive cancers decreased when compared to stromal cells associated with normal tissue. To understand how cilia may be lost during cancer development we analyzed the expression of genes required for ciliogenesis and/or ciliary function and compared their expression in normal versus breast cancer samples. We found that expression of ciliary genes were frequently downregulated in human breast cancers.

Conclusions: These data suggest that primary cilia are lost early in breast cancer development on both the cancer cells and their surrounding stromal cells.

Keywords: Cancer-associated stroma; Carcinoma in situ; Cilia length; Ciliogenesis; Invasive breast cancer; Primary cilia.


Figures

Figure 1
Figure 1
Primary cilia expression lost early in breast cancer development. Serial sections of normal breast reduction mammoplasties (A) and invasive breast cancer tissue (B). (A, B) Left: Tissue stained with hematoxylin and eosin (H&E). Inset shows a cross-section of a normal duct. Middle: low magnification image showing nuclear staining (Hoechst). Dashed box indicates area of higher magnification represented in the adjacent panel. Right: high magnification image showing tissue stained for cilia (acetylated tubulin, red) and centrosomes (γ-tubulin, green). Insets show a magnified cilium (red) and its associated centrosome (green) in normal tissue (top panel) and the lack of a cilium in cancer (bottom panel). (C, D) Boxplot represents percent ciliated cells in the following breast tissue types: basal epithelial cells of normal breast reduction mammoplasties (RM Basal, n = 12), luminal epithelial cells of normal breast reduction mammoplasties (RM Luminal, n = 12), basal cells in histologically normal epithelium adjacent to cancer (HNE Basal, n = 15), luminal cells in histologically normal epithelium adjacent to cancer (HNE Basal, n = 15), cancer cells in carcinoma in situ lesions grades 1 and 2 combined (CIS 1&2, n = 23), cancer cells in carcinoma in situ grade 3 (CIS3, n = 16), cancer cells in invasive cancers grades 1 and 2 combined (INV 1&2, n = 40), cancer cells in invasive cancer grade 3 (INV3, n = 25). The bar graph represents the percent of patients that have an abnormally low percentage of ciliated cells (blue bars: quartile 1 (Q1), less than or equal to the 75th percentile for normal tissue) or an abnormally high percentage of ciliated cells (orange bars: quartile 4 (Q4), greater than or equal to the 25th percentile for normal tissue). (E) Percent of Ki67 positive invasive cancer cells per patient (y-axis) versus percent ciliated cancer cells for the same patient (x-axis). Statistical significance (** = P <0.01, *** = P <0.001) was determined by performing logistic regression.
Figure 2
Figure 2
Rare cilia-positive cancer cells are positive for Cytokeratin 5. (A) Images show nuclei (blue), cytokeratin 5 (white), cilia (red), and centrosomes (green) in cells from the following tissue: reduction mammoplasties (RM) and histologically normal epithelium (HNE) adjacent to cancer and invasive cancers of four different cancer subtypes: luminal A and luminal B, Her2-positive, and triple negative. Insets show a magnified ciliated CK5-positive cell. (B) Boxplot represents median percent of cilia expressed on CK5-negative and CK5-positive cells in the following breast tissue types: basal epithelial cells of normal breast reduction mammoplasties (RM Basal, n = 12), luminal epithelial cells of normal breast reduction mammoplasties (RM Luminal, n = 12), basal cells in histologically normal epithelium adjacent to cancer (HNE Basal, n = 15), luminal cells in histologically normal epithelium adjacent to cancer (HNE Basal, n = 15), cancer cells in invasive cancers of the four breast cancer subtypes (Luminal A (LUM A, n = 37), Luminal B (LUM B, n = 10), Her2-positive (Her2+, n = 6), and Triple Negative (TN, n = 12)). Statistical significance (** = P <0.01, *** = P <0.001) was determined by performing logistic regression compared to normal RM.
Figure 3
Figure 3
Fraction of ciliated stromal cells decrease as breast cancer develops. (A) Image showing stromal cells (str) next to a normal duct (left) or next to a cancer (ca) structure (right). Insets show cilia (acetylated tubulin, red) and their associated centrosomes (γ-tubulin, green) on stromal cells. (B) Boxplot represents percent of ciliated stromal cells in the following breast tissue types: normal breast reduction mammoplasties (RM, n = 12), histologically normal epithelium adjacent to cancer (HNE, n = 15), carcinoma in situ lesions grades 1 and 2 combined (CIS 1&2, n = 23), carcinoma in situ grade 3 (CIS3, n = 16), invasive cancers grades 1 and 2 combined (INV 1&2, n = 40), invasive cancer grade 3 (INV3, n = 25). The bar graph represents the percent of patients that have an abnormally low percentage of ciliated stromal cells (blue bars: Quartile 1 (Q1), less than or equal to the 75th percentile for normal tissue) or an abnormally high percentage of ciliated stromal cells (orange bars: quartile 4 (Q4), greater than or equal to the 25th percentile for normal tissue). Statistical significance (** = P <0.01, *** = P <0.001) was determined by performing logistic regression compared to normal RM.
Figure 4
Figure 4
Cilia length abnormalities associated with breast cancer and their stromal cells. (A) Images of cilia representing typical lengths on basal epithelial cell in normal breast reduction mammoplasties, on invasive cancer cells, on stromal cells associated with normal breast reduction mammoplasties, and stromal cells associated with invasive cancers. (B, C) Boxplot represents median length of cilia expressed on cells in the following breast tissue types: basal epithelial cells of normal breast reduction mammoplasties (RM Basal, n = 12), luminal epithelial cells of normal breast reduction mammoplasties (RM Luminal, n = 12), basal cells in histologically normal epithelium adjacent to cancer (HNE Basal, n = 15), luminal cells in histologically normal epithelium adjacent to cancer (HNE Basal, n = 15), cancer cells in carcinoma in situ lesions grades 1 and 2 combined (CIS 1&2, n = 23), cancer cells in carcinoma in situ grade 3 (CIS3, n = 16), cancer cells in invasive cancers grades 1 and 2 combined (INV 1&2, n = 40), cancer cells in invasive cancer grade 3 (INV3, n = 25). (D) Boxplot represents the median length of cilia on stromal cells in the following breast tissue types: normal breast reduction mammoplasties (RM, n = 12), histologically normal epithelium adjacent to cancer (HNE, n = 15), carcinoma in situ lesions grades 1 and 2 combined (CIS 1&2, n = 23), carcinoma in situ grade 3 (CIS3, n = 16), invasive cancers grades 1 and 2 combined (INV 1&2, n = 40), invasive cancer grade 3 (INV3, n = 25). (B-D) The bar graph represents the percent of patients that have an abnormally low percentage of ciliated cells (blue bars: quartile 1 (Q1), less than or equal to the 75th percentile for normal tissue) or an abnormally high percentage of ciliated cells (orange bars: quartile 4 (Q4), greater than or equal to the 25th percentile for normal tissue). (** = P <0.01) was determined by performing logistic regression compared to normal RM.
Figure 5
Figure 5
Characterization of human breast cancer samples for expression of ciliogenesis genes. (A) Heat map displays the relative gene expression change seen in basal-like cancer samples compared to normal breast tissue. Each column represents a breast cancer tissue sample (sample name listed on top) and each row represents the relative expression results of a different ciliary gene (gene names are to the right). Overexpression is depicted in red, and underexpression is depicted in green. (B) The boxplots represent distribution of expression values for individual genes comparing breast cancer tissue samples to the normal tissues samples. The ciliary-associated genes shown in boxplots are those that were found to be statistically significant by ANOVA (Analysis of Variance) between normal and basal-like cancer samples with adjusted *P value <0.05. The log odds that the gene is differentially expressed are provided by B-statistics and B >3.0 was used as a cutoff for significantly changing genes. (C) Images show staining of normal breast reduction mammoplaties or breast cancer tissue with secondary antibody alone or with an antibody recognizing DYNC2H1 (red). Inset in normal breast tissue shows that tissue was also co-stained for antibodies to identify cilia (acetylated tubulin, green; γ-tubulin, white) and analyzed for co-localization in the same cell. The arrow points to a cilium with a pool of DYNC2H1 at the base.

References

    1. Goetz SC, Anderson KV. The primary cilium: a signalling centre during vertebrate development. Nat Rev Genet. 2010;11:331–344. doi: 10.1038/nrg2774. - DOI - PMC - PubMed
    1. Hildebrandt F, Benzing T, Katsanis N. Ciliopathies. N Engl J Med. 2011;364:1533–1543. doi: 10.1056/NEJMra1010172. - DOI - PMC - PubMed
    1. Hassounah NB, Bunch TA, McDermott KM. Molecular pathways: the role of primary cilia in cancer progression and therapeutics with a focus on Hedgehog signaling. Clin Cancer Res. 2012;18:2429–2435. doi: 10.1158/1078-0432.CCR-11-0755. - DOI - PMC - PubMed
    1. Basten SG, Giles RH. Functional aspects of primary cilia in signaling, cell cycle and tumorigenesis. Cilia. 2013;2:6. doi: 10.1186/2046-2530-2-6. - DOI - PMC - PubMed
    1. Wong SY, Seol AD, So PL, Ermilov AN, Bichakjian CK, Epstein EH Jr, Dlugosz AA, Reiter JF. Primary cilia can both mediate and suppress Hedgehog pathway-dependent tumorigenesis. Nat Med. 2009;15:1055–1061. doi: 10.1038/nm.2011. - DOI - PMC - PubMed

LinkOut - more resources