. 2014 Jul 2;9(7):e97282.
doi: 10.1371/journal.pone.0097282. eCollection 2014.

HLA diversity in the 1000 genomes dataset

Affiliations

HLA diversity in the 1000 genomes dataset

Pierre-Antoine Gourraud et al. PLoS One. .

Abstract

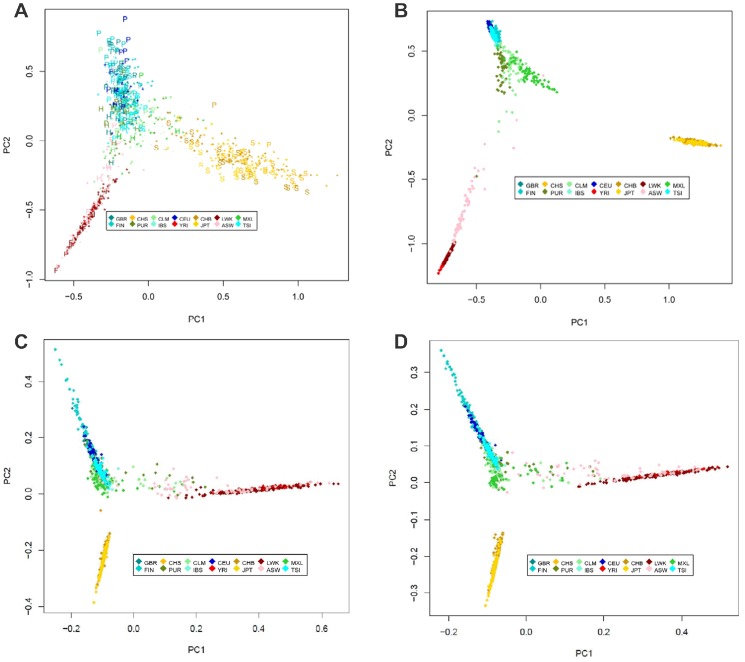
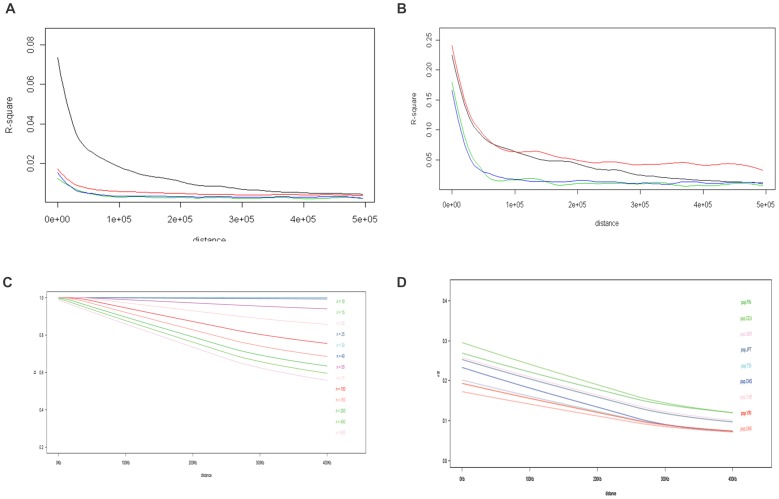
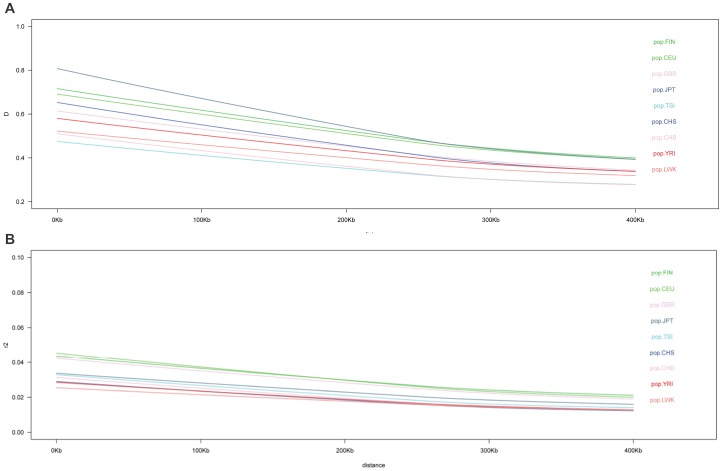
The 1000 Genomes Project aims to provide a deep characterization of human genome sequence variation by sequencing at a level that should allow the genome-wide detection of most variants with frequencies as low as 1%. However, in the major histocompatibility complex (MHC), only the top 10 most frequent haplotypes are in the 1% frequency range whereas thousands of haplotypes are present at lower frequencies. Given the limitation of both the coverage and the read length of the sequences generated by the 1000 Genomes Project, the highly variable positions that define HLA alleles may be difficult to identify. We used classical Sanger sequencing techniques to type the HLA-A, HLA-B, HLA-C, HLA-DRB1 and HLA-DQB1 genes in the available 1000 Genomes samples and combined the results with the 103,310 variants in the MHC region genotyped by the 1000 Genomes Project. Using pairwise identity-by-descent distances between individuals and principal component analysis, we established the relationship between ancestry and genetic diversity in the MHC region. As expected, both the MHC variants and the HLA phenotype can identify the major ancestry lineage, informed mainly by the most frequent HLA haplotypes. To some extent, regions of the genome with similar genetic or similar recombination rate have similar properties. An MHC-centric analysis underlines departures between the ancestral background of the MHC and the genome-wide picture. Our analysis of linkage disequilibrium (LD) decay in these samples suggests that overestimation of pairwise LD occurs due to a limited sampling of the MHC diversity. This collection of HLA-specific MHC variants, available on the dbMHC portal, is a valuable resource for future analyses of the role of MHC in population and disease studies.


Conflict of interest statement

Competing Interests: The authors Nezih Cereb and Soo Young Yang are employed by Histogenetics Inc. There are no patents, products in development or marketed products to declare. This does not alter their adherence to all the PLOS ONE policies on sharing data and materials, as detailed online in the guide for authors.

Figures

Figure 1
Figure 1. Principal Component analysis of the pairwise IBD distances between 1000 Genomes samples using MHC region marker (A), genome-wide markers (B), and using markers of regions with similar variants' density (C, chr9 : 116,750,000–121,650,000), with a recombination rate (D, chr9:800,000–5,700,000).
(A) The presence of the most frequent ancestry specific HLA haplotype in the samples of the 1000 Genomes project using MHC region markers. Principal component analysis of the 103 K variants from the MHC region in the 1000 Genomes samples. PC1 captures 6.00% of total variance; PC2 captures 5.05%. The PCA analysis is based on publicly available SNPs. In order to integrate the SNP based information to the HLA allele information, individual spots are replaced by letters when a frequent HLA haplotype is predicted when the HLA typing is phased using HLA haplotype frequencies. The so called “frequent” haplotypes are defined in an ancestry specific manner: P for frequent HLA haplotypes in Europeans, S for frequent HLA haplotype in Asians, H for frequent HLA haplotype in Hispanics and F for frequent haplotype in Africans. The detailed list of the frequent haplotypes is presented in supplementary information. Frequent haplotypes and definition of overlap between ancestries were documented in a recent modeling effort for the development of haplobank. (B) Principal Component analysis of the pairwise IBD distances between 1000 Genomes samples using genome-wide markers. Principal component analysis of 100 K variants selected at random throughout of the genome in the 1000 Genomes samples. PC1 captures 55.16% of total variance PC2 captures 41.96%. The representation of distances computed from genome-wide SNPS clearly identifies samples of European, Asian and African ancestries. The results are consistent with self-declared ancestry and the admixed nature of several populations. There are however a few notable exceptions: NA20314 from south west African Americans (ASW) clusters with Mexicans (MXL), NA20291 from ASW clusters with LWK, and HG01108 from the Puerto Rican (PUR) who clusters with the majority of Africans Americans (ASW). In addition, four Columbians (CLM: HG01342, HG01390, HG01462, HG01551) and three African Americans (ASW: NA20278, NA20299, NA20414) cluster together away from their groups. These are also clustering far from their self-declared ancestry in the MHC centered analysis. This most likely reflects their genome-wide ancestry rather than a different ancestry of the MHC. (C) Principal Component analysis of the pairwise IBD distances of 1000 Genomes samples using genome-wide markers of a region (chr9 : 116,750,000–121,650,000) with a variants' density that is similar to the MHC region. Principal component analysis of 100 K variants selected at random throughout of the genome in the 1000 Genomes samples. PC1 captures 2.98% of total variance PC2 captures 1.56%. The representation of distances computed from genome-wide SNPS clearly identifies samples of European, Asian and African ancestries. PC1 and PC2 have been flipped to ease the comparison of the patterns in Figures 1A and 1B. (D) Principal Component analysis of the pairwise IBD distances of 1000 Genomes samples using genome-wide markers of a region (chr9:800,000–5,700,000) with an avergage recombination rate that is similar to the MHC region. Principal component analysis of 100 K variants selected at random throughout of the genome in the 1000 Genomes samples. PC1 captures 2.55% of total variance PC2 captures 1.57%. The representation of distances computed from genome-wide SNPS clearly identifies samples of European, Asian and African ancestries. PC1 and PC2 have been flipped to ease the comparison of the patterns in Figures 1A and 1B.
Figure 2
Figure 2. Across genomic region comparison of the Linkage Disequilibrium (LD) for variants with frequency lower than 5% (A), greater than 5% (B), and 90th percentile of LD by D′ (C) and R2 (D) as a function of distance (kb) for various sample size as measure.
(A) Across genomic region comparison of the LD decay (R-Square) in the 1000 genome samples for variants whose frequency is lower than 5%. (B) Across genomic regions comparison of the LD decay (R-Square) in the 1000 genome samples for variants whose frequency is greater than 5%. Chr6:28,850,000:33,750,000 (black) representing the MHC; Chr9:116,750,000:121,650,000 (green with similar variants' density as MHC used in Fig. 1C); chr9:800,000:5,700,000 (blue with similar recombination rate as MHC used in FIG. 1D), an additional control with similar variants' density chr8:9,400,000 = red (with similar variants' density as MHC), The plot is presented for 0–500 Kbp. In 2A, all markers are included in 2B only markers whose frequencies are greater than 5% are included, showing that the analysis is affected by low frequency variants which requires large sample size for accurate estimation. (C) Average 90th Percentile of pairwise linkage disequilibrium (D′) as a function of distance (kb) for various sample size. (D) Average 90th Percentile of pairwise linkage disequilibrium (R2) as a function of distance (kb ranging from 0–400 Kb) for various sample sizes. (C and D) The AAMS dataset consists of 405 African American controls and 594 African American individuals with multiple sclerosis (MS) typed at 6040 MHC SNPs using Infinium iSelect HD Custom Genotyping BeadChip (Illumina). After strict quality control for missingness <0.1% and minor allele frequency >5%, 3224 markers remained for analysis. A subset of n = 10 random control individuals was selected. Linkage disequilibrium (r2 and D′) was calculated between all pairs of SNPs (5,195,476 unique pairs) using Haploview software. All r2 and d′ estimates were sorted by distance between markers, and grouped into bins of 500 bases. The 90th percentile r2 and d′ were calculated within each bin. Locally weighted regression (Cleveland, W. S. (1981) LOWESS: A program for smoothing scatterplots by robust locally weighted regression (The American Statistician, 35, 54) was used to create a smooth regression line across the 90th percentile r2 and d′ measures. The line in the figure represents the median across 10 trials of re-sampling the n = 10 individuals. The same procedure was repeated for larger sample sizes (n = 15, 20, 25, 30, 40, 50, 75, 100, 150, and 200). For the largest sample sizes (n = 400 and n = 800), MS cases were included in the analysis. The Correlation between sample size and average LD measure at a distance of 400 kb is shown in Figure S3A and S3B in Supplementary material.
Figure 3
Figure 3. Across sample comparison linkage disequilibrium as a function of pairwise distance between SNPs for similar number of individual (n = 85) as measured by D′ (A) and R2 (B).
(A) Across sample comparison of Median of LD (D′) as a function of pairwise distance between SNPs for similar number of individual (n = 85). (B) Across sample comparison of Median of LD (R2′) as a function of pairwise distance between SNPs for similar number of individual (n = 85). We resampled 85 unrelated individuals from the various populations of the 1000 Genomes in order to compare the LD decay pattern for a similar sample size. The figure shows the relation between the median percentile of pairwise LD measures according to the distance between the two markers between 0 and 400 Kb.

References

    1. Horton R, Wilming L, Rand V, Lovering RC, Bruford EA, et al. (2004) Gene map of the extended human MHC. Nat Rev Genet 5: 889–899. - PubMed
    1. Petersdorf EW (2008) Optimal HLA matching in hematopoietic cell transplantation. Curr Opin Immunol 20: 588–593. - PMC - PubMed
    1. Susal C, Opelz G (2012) Impact of HLA Matching and HLA Antibodies in Organ Transplantation: A Collaborative Transplant Study View. Methods Mol Biol 882: 267–277. - PubMed
    1. van Rood JJ, Oudshoorn M (2008) Eleven million donors in Bone Marrow Donors Worldwide! Time for reassessment? Bone Marrow Transplant 41: 1–9. - PubMed
    1. Cotsapas C, Voight BF, Rossin E, Lage K, Neale BM, et al. (2011) Pervasive sharing of genetic effects in autoimmune disease. PLoS Genet 7: e1002254. - PMC - PubMed

Publication types