

Movement-based estimation and visualization of space use in 3D for wildlife ecology and conservation
- PMID: 24988114
- PMCID: PMC4079284
- DOI: 10.1371/journal.pone.0101205
Movement-based estimation and visualization of space use in 3D for wildlife ecology and conservation
Erratum in
- PLoS One. 2014;9(9):e109065
Abstract
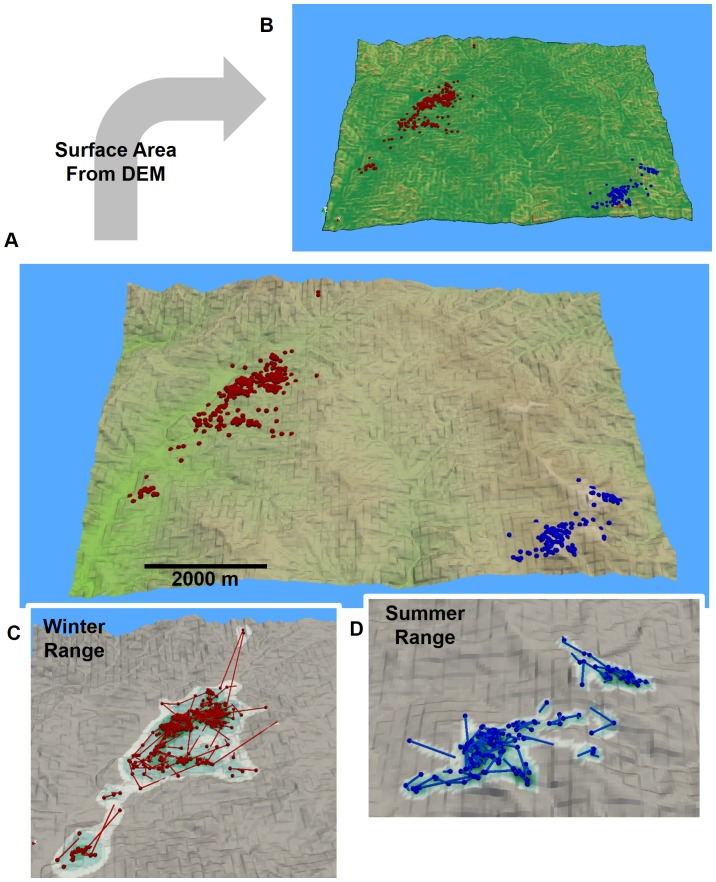
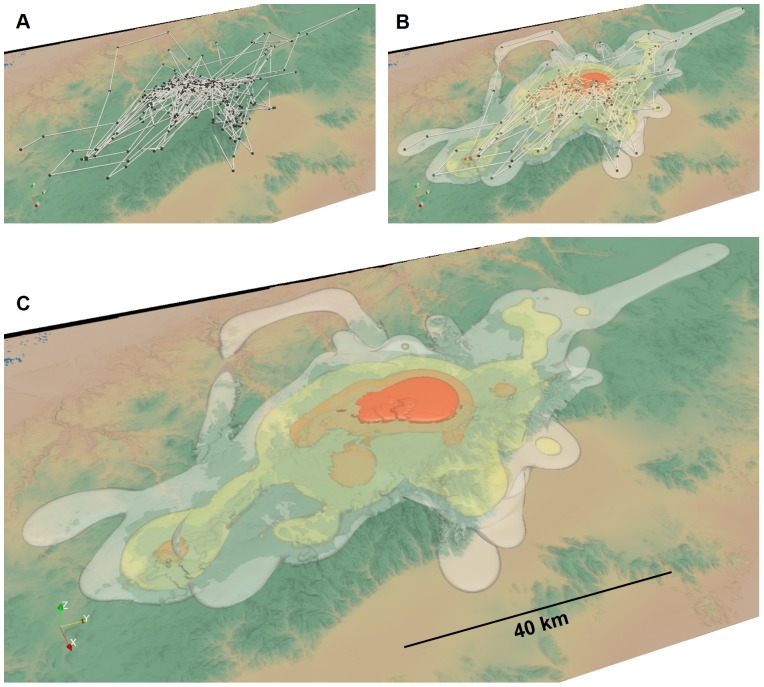
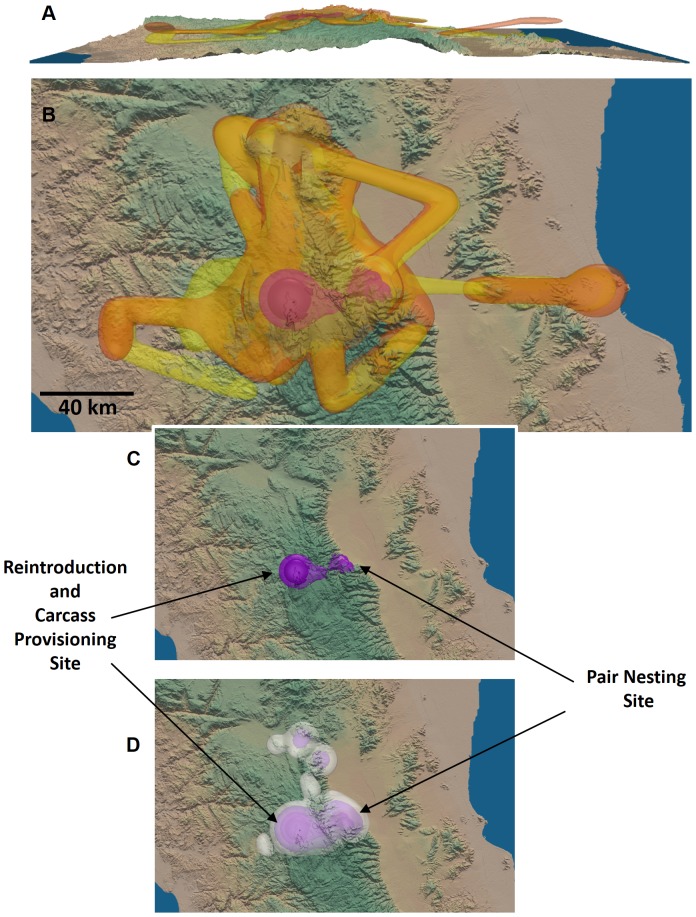
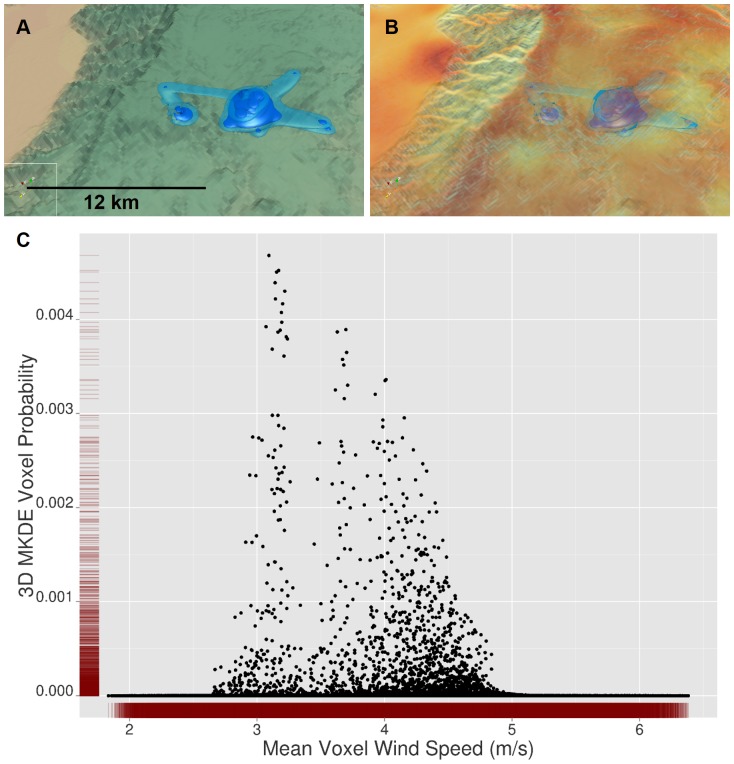
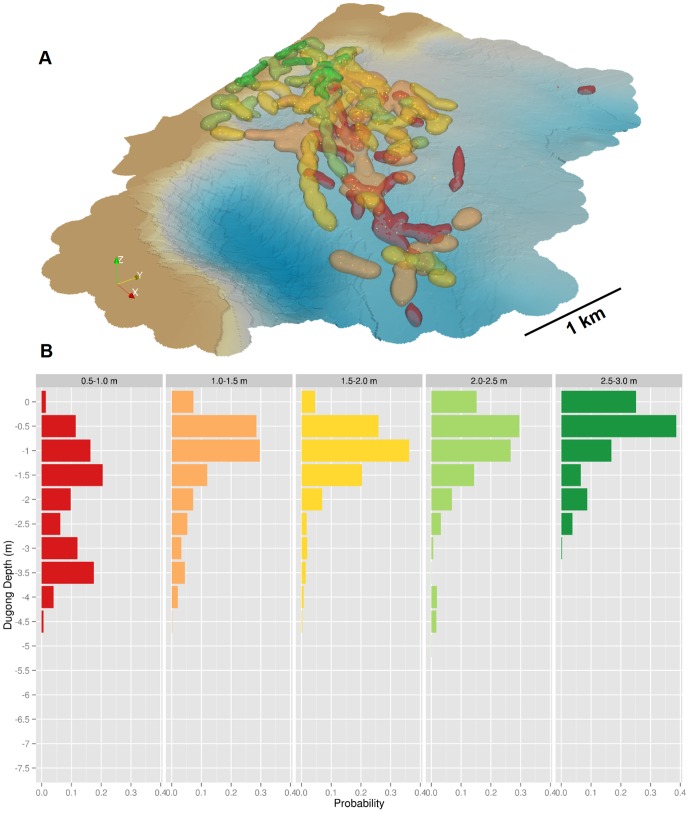
Advances in digital biotelemetry technologies are enabling the collection of bigger and more accurate data on the movements of free-ranging wildlife in space and time. Although many biotelemetry devices record 3D location data with x, y, and z coordinates from tracked animals, the third z coordinate is typically not integrated into studies of animal spatial use. Disregarding the vertical component may seriously limit understanding of animal habitat use and niche separation. We present novel movement-based kernel density estimators and computer visualization tools for generating and exploring 3D home ranges based on location data. We use case studies of three wildlife species--giant panda, dugong, and California condor--to demonstrate the ecological insights and conservation management benefits provided by 3D home range estimation and visualization for terrestrial, aquatic, and avian wildlife research.
Conflict of interest statement
Figures


Similar articles
-
Telemetry research on elusive wildlife: A synthesis of studies on giant pandas.Integr Zool. 2016 Jul;11(4):295-307. doi: 10.1111/1749-4877.12197. Integr Zool. 2016. PMID: 26940046 Review.
-
[Assessment of giant panda habitat based on integration of expert system and neural network].Ying Yong Sheng Tai Xue Bao. 2006 Mar;17(3):438-43. Ying Yong Sheng Tai Xue Bao. 2006. PMID: 16724739 Chinese.
-
Behavioural valuation of landscapes using movement data.Philos Trans R Soc Lond B Biol Sci. 2019 Sep 16;374(1781):20180046. doi: 10.1098/rstb.2018.0046. Epub 2019 Jul 29. Philos Trans R Soc Lond B Biol Sci. 2019. PMID: 31352884 Free PMC article. Review.
-
Long-term distribution and habitat changes of protected wildlife: giant pandas in Wolong Nature Reserve, China.Environ Sci Pollut Res Int. 2018 Apr;25(12):11400-11408. doi: 10.1007/s11356-018-1407-6. Epub 2018 Feb 8. Environ Sci Pollut Res Int. 2018. PMID: 29423692
-
AIMS for wildlife: Developing an automated interactive monitoring system to integrate real-time movement and environmental data for true adaptive management.J Environ Manage. 2023 Nov 1;345:118636. doi: 10.1016/j.jenvman.2023.118636. Epub 2023 Aug 11. J Environ Manage. 2023. PMID: 37574637
Cited by
-
Fine-scale movement of northern Gulf of Mexico red snapper and gray triggerfish estimated with three-dimensional acoustic telemetry.Sci Rep. 2022 Aug 22;12(1):14274. doi: 10.1038/s41598-022-18451-x. Sci Rep. 2022. PMID: 35995813 Free PMC article.
-
Going Up or Sideways? Perception of Space and Obstacles Negotiating by Cuttlefish.Front Physiol. 2017 Mar 27;8:173. doi: 10.3389/fphys.2017.00173. eCollection 2017. Front Physiol. 2017. PMID: 28396639 Free PMC article.
-
Linking behavioral states to landscape features for improved conservation management.Ecol Evol. 2021 May 25;11(12):7905-7916. doi: 10.1002/ece3.7621. eCollection 2021 Jun. Ecol Evol. 2021. PMID: 34188860 Free PMC article.
-
Performance of GPS/GPRS tracking devices improves with increased fix interval and is not affected by animal deployment.PLoS One. 2022 Mar 30;17(3):e0265541. doi: 10.1371/journal.pone.0265541. eCollection 2022. PLoS One. 2022. PMID: 35353826 Free PMC article.
-
Overlap and Segregation among Multiple 3D Home Ranges: A Non-Pairwise Metric with Demonstrative Application to the Lesser Kestrel Falco naumanni.Biology (Basel). 2023 Jan 2;12(1):77. doi: 10.3390/biology12010077. Biology (Basel). 2023. PMID: 36671769 Free PMC article.
References
-
- Burt WH (1943) Territoriality and home range concepts as applied to mammals. Journal of Mammalogy 24: 346–352.
-
- Powell RA, Mitchell MS (2012) What is a home range? Journal of Mammalogy 93: 948–958.
-
- Spencer WD (2012) Home ranges and the value of spatial information. Journal of Mammalogy 93: 929–947.
-
- Brashares JS (2003) Ecological, behavioral, and life-history correlates of mammal extinctions in west Africa. Conservation Biology 17: 733–743.
Publication types
MeSH terms
LinkOut - more resources
Full Text Sources
Other Literature Sources
