. 2014 Jul 2;9(7):e101263.
doi: 10.1371/journal.pone.0101263. eCollection 2014.

Reversible suppression of cyclooxygenase 2 (COX-2) expression in vivo by inducible RNA interference

Affiliations

Reversible suppression of cyclooxygenase 2 (COX-2) expression in vivo by inducible RNA interference

Anne K Zaiss et al. PLoS One. .

Abstract

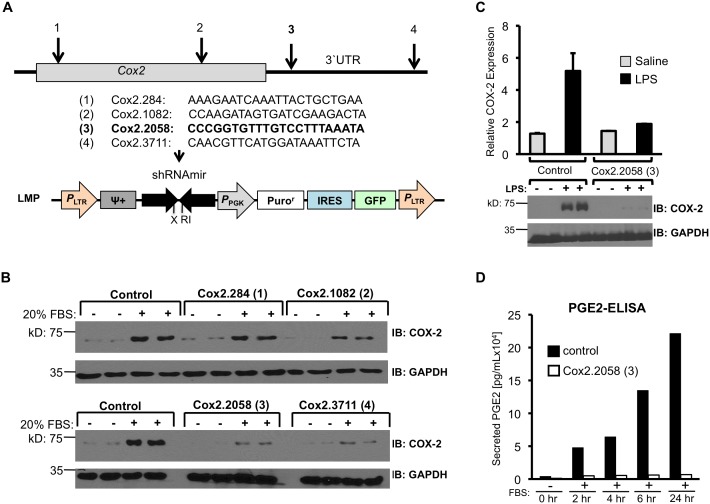
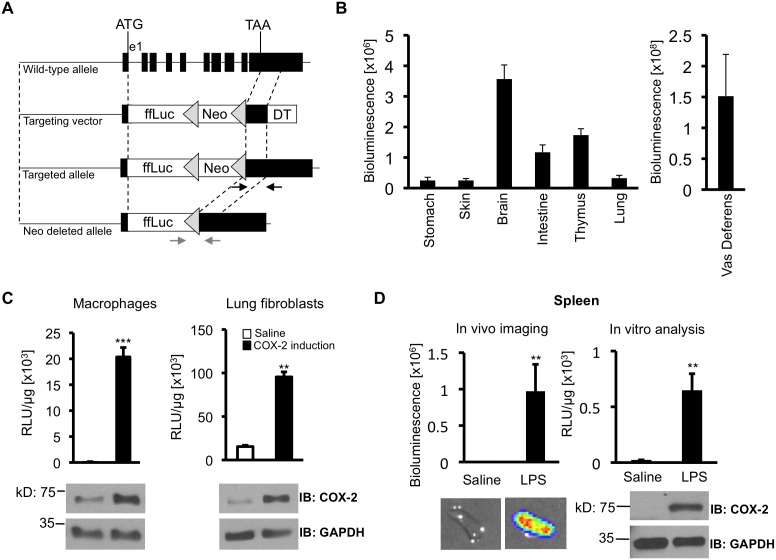
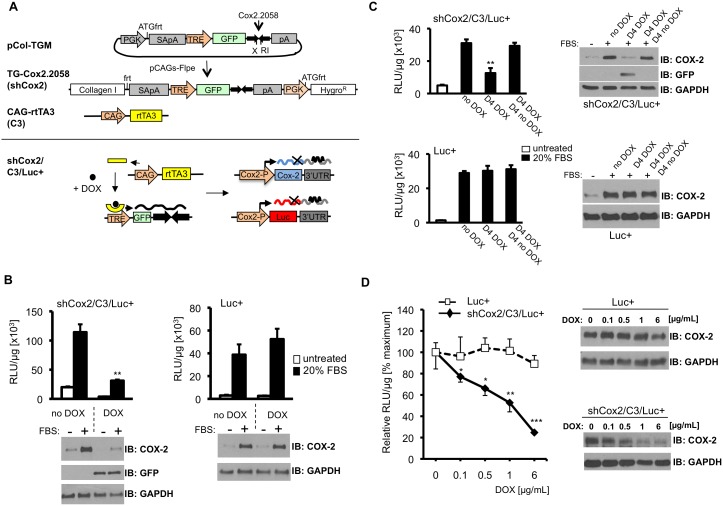
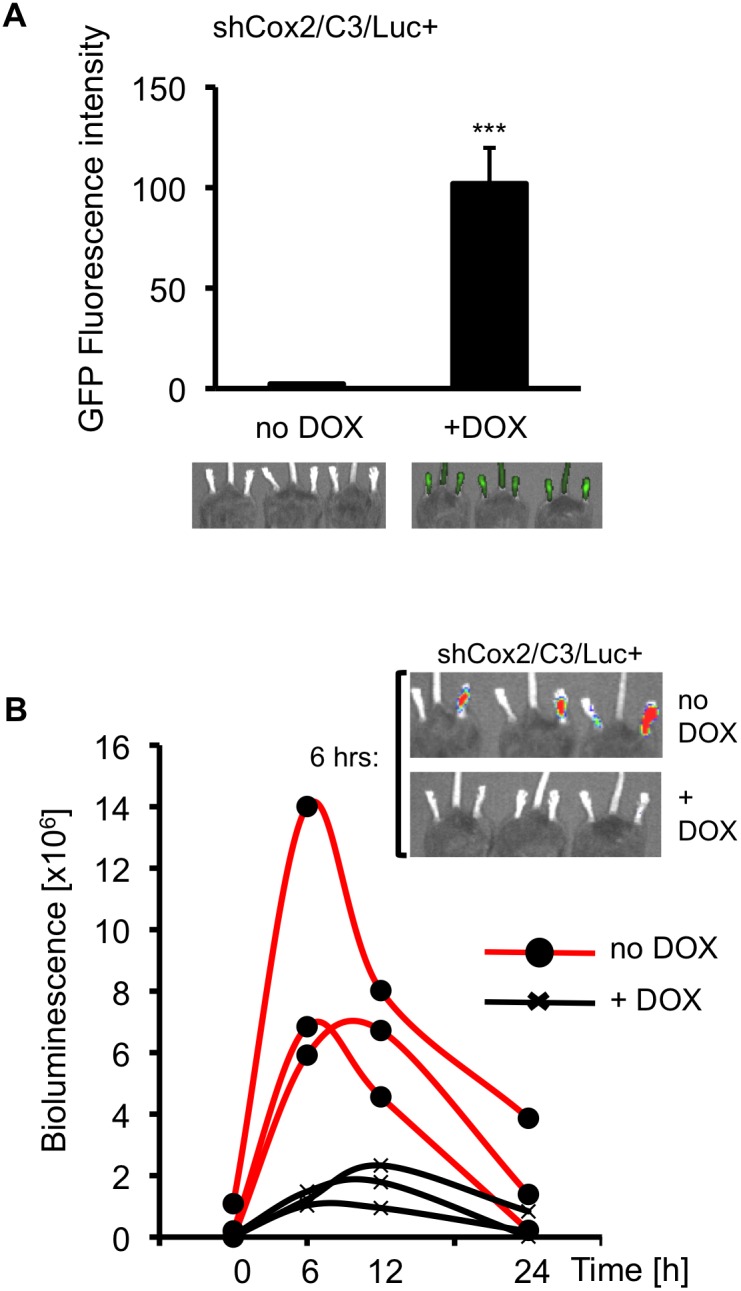
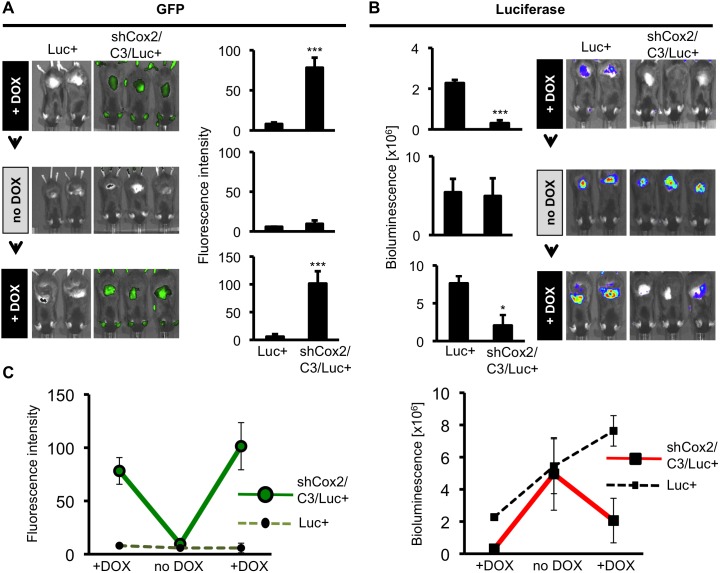
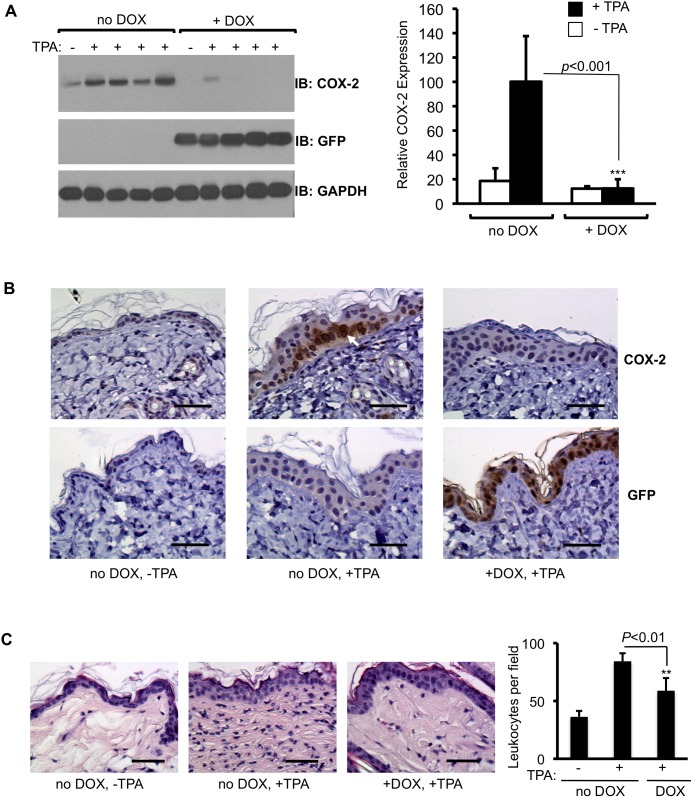
Prostaglandin-endoperoxide synthase 2 (PTGS2), also known as cyclooxygenase 2 (COX-2), plays a critical role in many normal physiological functions and modulates a variety of pathological conditions. The ability to turn endogenous COX-2 on and off in a reversible fashion, at specific times and in specific cell types, would be a powerful tool in determining its role in many contexts. To achieve this goal, we took advantage of a recently developed RNA interference system in mice. An shRNA targeting the Cox2 mRNA 3'untranslated region was inserted into a microRNA expression cassette, under the control of a tetracycline response element (TRE) promoter. Transgenic mice containing the COX-2-shRNA were crossed with mice encoding a CAG promoter-driven reverse tetracycline transactivator, which activates the TRE promoter in the presence of tetracycline/doxycycline. To facilitate testing the system, we generated a knockin reporter mouse in which the firefly luciferase gene replaces the Cox2 coding region. Cox2 promoter activation in cultured cells from triple transgenic mice containing the luciferase allele, the shRNA and the transactivator transgene resulted in robust luciferase and COX-2 expression that was reversibly down-regulated by doxycycline administration. In vivo, using a skin inflammation-model, both luciferase and COX-2 expression were inhibited over 80% in mice that received doxycycline in their diet, leading to a significant reduction of infiltrating leukocytes. In summary, using inducible RNA interference to target COX-2 expression, we demonstrate potent, reversible Cox2 gene silencing in vivo. This system should provide a valuable tool to analyze cell type-specific roles for COX-2.


Conflict of interest statement

Competing Interests: The authors have read the journal's policy and have the following competing interests: SWL and JZ are members of the Scientific Advisory Board and hold equity in Mirimus Inc., a company that has licensed some of the technology reported in this manuscript. The authors' involvement in Mirimus Inc. (SWL and JZ) does not alter their adherence to PLOS ONE policies on sharing data and materials.

Figures

Figure 1
Figure 1. Identifying small inhibitory RNAs for COX-2.
(A) Schematic representation of the Cox2 transcript, indicating target areas of four designed shRNAs. The COX-2 protein-coding region is indicated as a filled box, 5′ and 3′ untranslated mRNA as solid lines. Four 22-nucleotide shRNAs for Cox2 were designed; (1) Cox2.284, (2) Cox2.1082, (3) Cox2.2058 and (4) Cox2.3711, the number reflecting the first nucleotide position of the target sequence in the mRNA transcript. The shRNA sequences were then converted into cloning templates and ligated into the LMP retrovirus vector. This vector contains an XhoI/EcoR1 cloning site for shRNAs within a miR30 backbone (shRNAmir). The LMP construct is shown as it appears after integration; shRNAs are constitutively expressed from the 5′LTR promoter. The LMP retrovirus also encodes a puromycin-resistance gene for selection and GFP as a fluorescent marker. (B) NIH3T3 cells were transduced at a low MOI with each of the four LMP vectors containing miR30-based shRNAs that target the Cox2 transcript, or with a control luciferase-targeted shRNA. Retrovirus-transduced cells were selected for integrated provirus by culturing in puromycin. Puromycin-selected cell populations were shifted overnight to 1% serum, then treated with 20% serum for 6 hours. Cell extracts were immunoblotted for COX-2 and GAPDH. (C) RAW264.7 cells stably transduced either with the luciferase shRNA LMP vector or with the LMP vector encoding Cox2-targeted Cox2.2058 shRNA were stimulated with LPS (50 ng/mL) or with saline for four hours. Cell extracts were prepared and analyzed for COX-2 protein and GAPDH. The quantified COX-2 signal was normalized against GAPDH. (D) PGE2 accumulation in the media of serum-stimulated NIH3T3 cells expressing shRNA Cox2.2058 or the control luciferase shRNA. NIH3T3 cells expressing the two shRNAs were shifted from media containing 1% FBS to 20% FBS and, at times shown, media samples were assayed for PGE2 levels.
Figure 2
Figure 2. Construction of Cox2tm2Luc/+ a mouse strain in which firefly luciferase replaces the Cox2 coding region.
(A) Schematic representation of the wild-type Cox2 allele and the targeting strategy to create the Cox2tm2Luc knockin allele. The firefly luciferase coding region (ffLuc), PGK-neo (neo) selection cassette, and PGK-DT (DT) selection cassette in the targeting vector are shown as open boxes. Grey triangles depict loxP sites. Homologous recombination was confirmed by PCR (black arrows) and Southern blot analysis in ES cells. The neomycin-resistance cassette was deleted by Cre recombinase expression, resulting in the ‘neo-deleted’ allele. Deletion was confirmed by PCR (grey arrows). Cox2 gene sequences are replaced by the firefly luciferase coding region between the ATG translational start site located at the end of exon 1 (e1) and the TAA Cox2 stop codon located on exon 10. There are no modifications of the untranslated 5′UTR and 3′UTR either upstream of the ATG or downstream from the TAA. (B) Unstimulated luciferase activity in isolated Cox2tm2Luc/+ tissues. Luciferase activity was quantified by ex vivo bioluminescent imaging. Data are means +/− SD (n = 4). (C) COX-2 and luciferase induction in primary cells isolated from Cox2tm2Luc/+ mice. Bone marrow macrophage cultures were stimulated with LPS (50 ng/mL) for four hours. Lung fibroblast cultures were stimulated with 20% serum for six hours. Cell extracts were analyzed for luciferase enzymatic activity and COX-2 protein. Luciferase activity is displayed as relative light units (RLU) per microgram protein. Data are means +/− SD (**, p<0.01, ***, p<0.001, n = 3). (D) Interferon gamma and endotoxin (IFNγ/LPS) COX-2 and luciferase induction in the spleens of heterozygous Cox2tm2Luc/+ mice. Four mice were injected i.p. with IFNγ, (1 µg/mouse) and two hours later with LPS (3 mg/kg) or saline. After 6 hours, mice were euthanized, spleens were excised and luciferase bioluminescence was quantified by bioluminescent imaging (left panel). Luciferase enzymatic activity and COX-2 protein levels were measured in extracts (right panel). Data are means +/− SD (**, p<0.01).
Figure 3
Figure 3. Inducible COX-2 shRNA expression suppresses Cox2-driven gene expression in cells cultured from triple transgenic mice.
(A) Upper panel: The diagram shows the pCol-TGM targeting construct encoding GFP and COX-2 shRNA, expressed from a TRE promoter. Co-electroporation, with pCAGS-Flpe recombinase, into KH2 ES cells results in integration of the construct into the ColA1 locus. ShCox2 mice are crossed with tet-transactivator mice (CAG-rtTA3/C3) to create double trangenics. Lower panel; in triple transgenic shCox2/C3/Luc+ mice, DOX-rtTA3 activates the TRE promoter, driving GFP and shCox2 expression; shCox2 blocks COX-2 and luciferase expression. Without DOX the TRE promoter is quiescent; COX-2 and luciferase are expressed normally. (B) Inducible suppression of Cox2 gene expression in fibroblasts. Skin fibroblasts from triple transgenic shCox2/C3/Luc+ and Luc+ mice were cultured for four days in the absence or presence of DOX (1 µg/mL), shifted to 1% serum overnight, then stimulated with 20% serum for 6 hours. Luciferase activity was measured in extracts, COX-2 and GFP protein were analyzed by Western blot. Luciferase activity was normalized to protein content. (C) Reversible suppression of Cox2 gene expression in skin fibroblasts. Cells were untreated (no DOX), treated for 4 days with DOX (D4 DOX), or treated for 4 days with DOX followed by 4 days without DOX (D4 DOX, D4 no DOX). Cells were stimulated with medium containing 20% FBS; luciferase activity, COX-2 expression and GFP expression were analyzed. (D) Bone marrow macrophages from shCox2/C3/Luc+ and control Luc+ mice were cultured in the indicated concentrations of DOX overnight, then stimulated for 4 hours with LPS (50 ng/mL) to induce COX-2. Cell extracts were analyzed for luciferase activity and COX-2 protein. Luciferase activities are normalized to LPS stimulation in the absence of DOX. Data are means +/− SD. Statistics compare DOX-treated cultures with cells not receiving DOX (*, p<0.05; **, p<0.01; ***, p<0.001).
Figure 4
Figure 4. DOX-dependent suppression of Cox2 driven luciferase expression in triple transgenic mice during zymosan-induced paw inflammation.
(A) Fluorescent in vivo GFP imaging of shCox2/C3/Luc+ triple transgenic mice fed either a control diet (no DOX) or a DOX-containing diet (+DOX) for 12 days. GFP fluorescence was quantified with Living Image software. Data are means +/− SD, (n  = 3; ***, p<0.001). (B) ShCox2/C3/Luc+ mice were injected intraplantarly in the left hind paw with zymosan (30 µL, 2% w/v) and with saline in the contralateral hind paw. In vivo luciferase bioluminescence was non-invasively and repeatedly measured and quantified at the indicated time points. Each curve represents data from an individual animal. To control for individual animal variability the bioluminescence in the contralateral control saline-infected paw was subtracted from the bioluminescence value of the zymosan-injected paw for each observation.
Figure 5
Figure 5. Reversible DOX-dependent suppression of Cox2-driven luciferase expression in skin of TPA-treated triple transgenic mice.
Luc+ mice and triple transgenic mice were subjected to the following diet, TPA skin application and imaging schedule: Mice were placed on a DOX-supplemented diet (+DOX) for 12 days followed by skin TPA application. Mice were imaged 24 hours later for GFP fluorescence and luciferase bioluminescence. The mice were then shifted to a DOX-free diet (no DOX) for 12 days and the skin TPA application, GFP fluorescence and luciferase bioluminescence analyses were repeated a second time. The mice were then shifted back to a DOX-supplemented diet (+DOX) for 12 days and the skin TPA application, GFP fluorescence and luciferase bioluminescence analyses were repeated a third time. (A) GFP fluorescence, indicating shCox2 expression. Data are means +/− S.D. (***p<0.001). After the DOX-diet was removed (middle panel, no DOX), GFP fluorescence returned to baseline (p>0.05, ns). (B) Luciferase bioluminescence, indicating Cox2 gene-driven luciferase expression. TPA-induced luciferase expression is reversibly reduced, in the presence of DOX, in triple transgenic mice. Data are means +/− S.D (*p<0.05, ***p<0.001). (C) Summary of GFP fluorescent intensity values (left panel) and bioluminescence (right panel) in Luc+ mice (dashed lines) and shCox2/C3/Luc+ mice (solid lines) for the three successive non-invasive imaging analyses. Error bars show S.D.
Figure 6
Figure 6. DOX-dependent suppression of TPA-induced COX-2 expression by shCox2 in mice homozygous for the Cox2 gene.
(A) Double transgenic shCox2/C3 mice, which have two wild type Cox2 alleles, were maintained on either a control (no DOX) or a DOX-supplemented diet (+DOX) for 12 days, then painted with TPA on the back. 24 hours after TPA administration the mice were euthanized and skin extracts were assayed for GFP and COX-2 protein by Western blotting. Quantification is from three independent experiments. The COX-2 signal was normalized to the GAPDH loading control. Data are means +/− S.D. (***p<0.001). (B) COX-2 (upper panels) and GFP (lower panels) immunohistochemistry in skin of untreated shCox2/C3 mice (left panels), 24 hours after TPA administration to shCox2/C3 mice maintained on a DOX-free diet (center panels) and 24 hours after TPA treatment of shCox2/C3 mice maintained for 12 days on a DOX-supplemented diet (right panels). COX-2 staining is visible as brown patches (white arrow) in the basal epithelium. (C) H&E stain to visualize leukocytes in skin sections from double transgenic shCox2/C3 mice treated with TPA and/or DOX as in B. The graph depicts quantification of leukocytes in the dermis. Quantification is from two independent experiments. Data are means +/− S.D. (**p<0.01). The scale bar indicates 50 µm.

Similar articles

Cited by

References

    1. Herschman HR, Talley JJ, DuBois R (2003) Cyclooxygenase 2 (COX-2) as a target for therapy and noninvasive imaging. Mol Imaging Biol 5: 286–303. - PubMed
    1. Vane JR, Bakhle YS, Botting RM (1998) Cyclooxygenases 1 and 2. Annu Rev Pharmacol Toxicol 38: 97–120. - PubMed
    1. Harris SG, Padilla J, Koumas L, Ray D, Phipps RP (2002) Prostaglandins as modulators of immunity. Trends Immunol 23: 144–150. - PubMed
    1. Hirata T, Narumiya S (2012) Prostanoids as regulators of innate and adaptive immunity. Adv Immunol 116: 143–174. - PubMed
    1. Steer SA, Corbett JA (2003) The role and regulation of COX-2 during viral infection. Viral Immunol 16: 447–460. - PubMed

Publication types