. 2014 Jul 1;107(1):76-87.
doi: 10.1016/j.bpj.2014.04.062.

Anomalous surface diffusion of protons on lipid membranes

Affiliations

Anomalous surface diffusion of protons on lipid membranes

Maarten G Wolf et al. Biophys J. .

Abstract

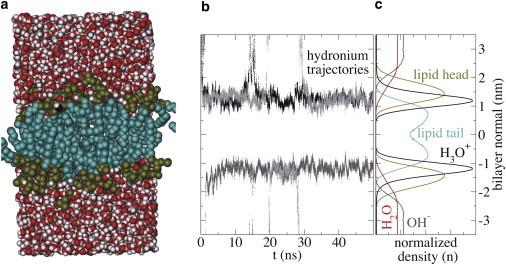
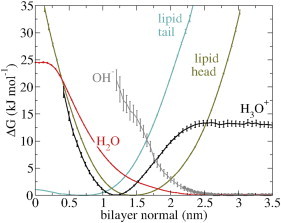
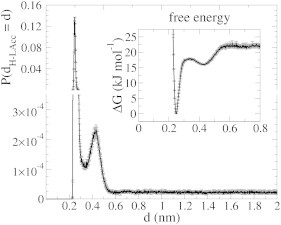
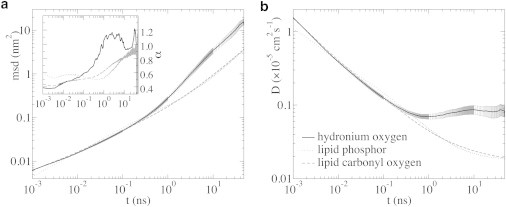
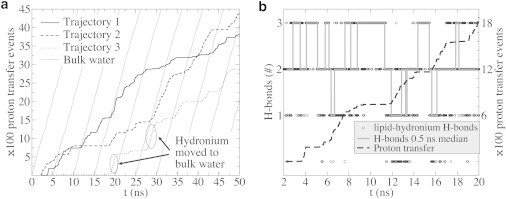
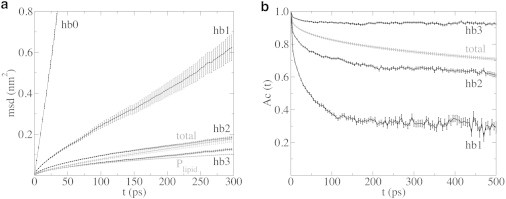
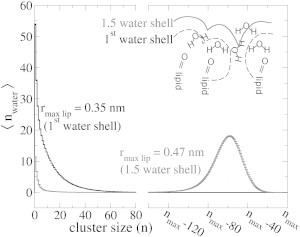
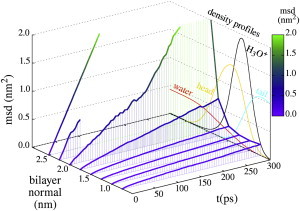
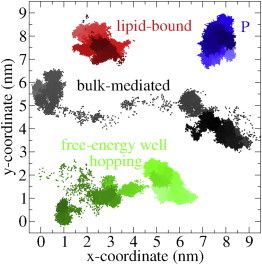
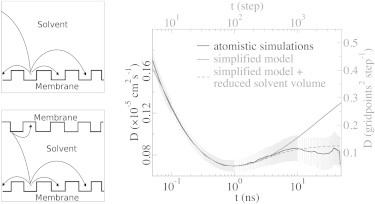
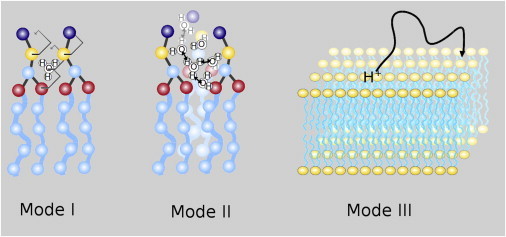
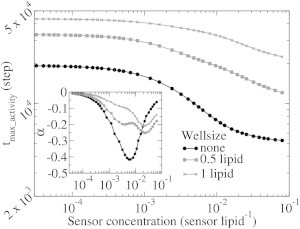
The cellular energy machinery depends on the presence and properties of protons at or in the vicinity of lipid membranes. To asses the energetics and mobility of a proton near a membrane, we simulated an excess proton near a solvated DMPC bilayer at 323 K, using a recently developed method to include the Grotthuss proton shuttling mechanism in classical molecular dynamics simulations. We obtained a proton surface affinity of -13.0 ± 0.5 kJ mol(-1). The proton interacted strongly with both lipid headgroup and linker carbonyl oxygens. Furthermore, the surface diffusion of the proton was anomalous, with a subdiffusive regime over the first few nanoseconds, followed by a superdiffusive regime. The time- and distance dependence of the proton surface diffusion coefficient within these regimes may also resolve discrepancies between previously reported diffusion coefficients. Our simulations show that the proton anomalous surface diffusion originates from restricted diffusion in two different surface-bound states, interrupted by the occasional bulk-mediated long-range surface diffusion. Although only a DMPC membrane was considered in this work, we speculate that the restrictive character of the on-surface diffusion is highly sensitive to the specific membrane conditions, which can alter the relative contributions of the surface and bulk pathways to the overall diffusion process. Finally, we discuss the implications of our findings for the energy machinery.


Figures

Figure 1
Figure 1
Excess proton near a membrane surface. (a) Simulation box, (b) examples of the time evolution of the excess proton along the bilayer normal, and (c) ensemble-average normalized number densities along the bilayer normal for the various components of the simulated system. The bilayer center is positioned at 0 nm and periodic boundary conditions connect the top and bottom of the graphs. To see this figure in color, go online.
Figure 2
Figure 2
Free energy profiles along the bilayer normal demonstrate the strong proton surface affinity. The error bars denote the standard error. To see this figure in color, go online.
Figure 3
Figure 3
Probability distribution of the minimum distance between the hydronium and lipid oxygens. (Inset) Associated free-energy profile. The very favorable interaction of a hydronium in direct contact with a lipid oxygen (low free energy at 0.25-nm separation) explains the strong proton surface affinity. The second peak shows that a hydronium in a second solvation shell around a lipid oxygen is already favored over a bulk hydronium.
Figure 4
Figure 4
Surface diffusion of the hydronium oxygen (solid), lipid phosphor (dotted), and lipid carbonyl oxygen (dashed). The error bars denote the standard error (which falls within the line width for the lipid atoms). (a) MSD. (Inset) 10-point running average of the power-law exponent α in 〈[r(t) – r(0)]2〉 ∼ tα as a function of time t. (b) Time-dependent diffusion coefficient (Eq. 1). These graphs highlight the anomalous surface diffusion of a proton on a DMPC membrane.
Figure 5
Figure 5
Proton transfer events at the membrane surface. (a) Comparison between the cumulative number of transfer events on the surface (three representative trajectories) and in the water phase (shaded). For convenient comparison, the latter is shown multiple times, shifted 5 ns along the x axis. (b) The correlation between proton transfer rate and lipid-hydronium hydrogen bonds. The correlation is most clear when the number of lipid-hydronium hydrogen bonds reaches its maximum, which is accompanied by almost absent proton transfer (plateau regions). The result of a 0.5-ns median of the lipid-hydronium hydrogen bonds, used for further analysis, is shown. For clarity, only 20 ns are displayed.
Figure 6
Figure 6
Restricted diffusion of an excess proton hydrogen-bonded to a lipid. Properties of the hbx ensembles, demonstrating the importance of the number of hydrogen bonds for the dynamics of the proton. (a) Lateral MSD. For comparison, the total hydronium and the lipid phosphor MSD is displayed. (b) Autocorrelation function of the hydronium-lipid hydrogen bonds, which remarkably decays to a plateau.
Figure 7
Figure 7
Connectivity of the water molecules at various distances around lipid oxygens. Cluster-size distribution for water molecules within 0.35 and 0.47 nm from a lipid hydrogen-bond acceptor, corresponding to first solvation shell and 1.5 water solvation shell, respectively. The nmax is the total number of water molecules within the considered water shell. (Inset) Schematic representation of the water shells considered in the cluster analysis.
Figure 8
Figure 8
Lateral MSD of the excess proton at various membrane penetration depths shows that the diffusion rate increases as the proton leaves the membrane. The MSD at 2.5 nm is the average lateral MSD in bulk water and we could only obtain the MSD at 2.25 nm over 50 ps due to sampling problems. To illustrate the excess protons penetration depth the density profiles normal to the membrane surface of the hydronium, water, lipid tails, and lipid headgroups are plotted in the background (also shown in Fig. 1). To see this figure in color, go online.
Figure 9
Figure 9
Representative trajectories of the displacement of the excess proton when it is bound to a lipid, hopping between free-energy wells and in bulk. For comparison, a typical lipid phosphor trajectory is shown. The time intervals are from 2 ns (light) to 50 ns (dark). To see this figure in color, go online.
Figure 10
Figure 10
Schematic representation of our simplified model with infinite solvent volume (upper left) and a reduced solvent volume (lower left). In the right graph, the time dependence of the surface-diffusion coefficient as derived by the simplified model (gray) shows the expected increasing diffusion coefficient at long timescale for infinite solvent volume (solid) and the effect of a reduced volume (dashed). The latter is in agreement with the result of our atomistic simulations (black). The lower and left axis corresponds to the atomistic simulations and the upper and right axis corresponds to the simplified model. For simplified model details, see the Supporting Material.
Figure 11
Figure 11
Schematic representation of the three observed diffusion modes for a proton on a membrane surface. In Mode I, the hydronium is bound to the lipids. Proton transfer is absent and diffusion is determined by the lipid, to which it is bound. In Mode II, the proton is captured within a free-energy well composed of a small lipid-enclosed cluster of water molecules. Within this well, the proton can transfer freely, and diffusion is a superposition of the proton diffusion within the well, and the diffusion of the whole well. In Mode III, the proton desorbs from the membrane. The proton migrates freely over the surface or through the bulk before the proton readsorbs onto the membrane, leading to large-scale surface diffusion. To see this figure in color, go online.
Figure 12
Figure 12
Time to maximum sensor activity after proton release on the surface as a function of the sensor concentration. The log-log scale revealed a power law relation in the well systems (shaded), which is absent for free surface diffusion (solid). The plot of the power-law exponent α shows that the power-law relation is only approximate.

References

    1. Capaldi R.A., Aggeler R. Mechanism of the F1F0-type ATP synthase, a biological rotary motor. Trends Biochem. Sci. 2002;27:154–160. - PubMed
    1. Krulwich T.A., Ito M., Hicks D.B. Energetic problems of extremely alkaliphilic aerobes. Biochim. Biophys. Acta. 1996;1275:21–26. - PubMed
    1. Michel H., Oesterhelt D. Electrochemical proton gradient across the cell membrane of Halobacterium halobium: comparison of the light-induced increase with the increase of intracellular adenosine triphosphate under steady-state illumination. Biochemistry. 1980;19:4615–4619. - PubMed
    1. Mulkidjanian A.Y., Heberle J., Cherepanov D.A. Protons at interfaces: implications for biological energy conversion. Biochim. Biophys. Acta Bioenerg. 2006;1757:913–930. - PubMed
    1. Cherepanov D.A., Feniouk B.A., Mulkidjanian A.Y. Low dielectric permittivity of water at the membrane interface: effect on the energy coupling mechanism in biological membranes. Biophys. J. 2003;85:1307–1316. - PMC - PubMed

Publication types

LinkOut - more resources