. 2014 Jul 2;9(7):e101302.
doi: 10.1371/journal.pone.0101302. eCollection 2014.

Climate exposure of US national parks in a new era of change

Affiliations

Climate exposure of US national parks in a new era of change

William B Monahan et al. PLoS One. .

Abstract

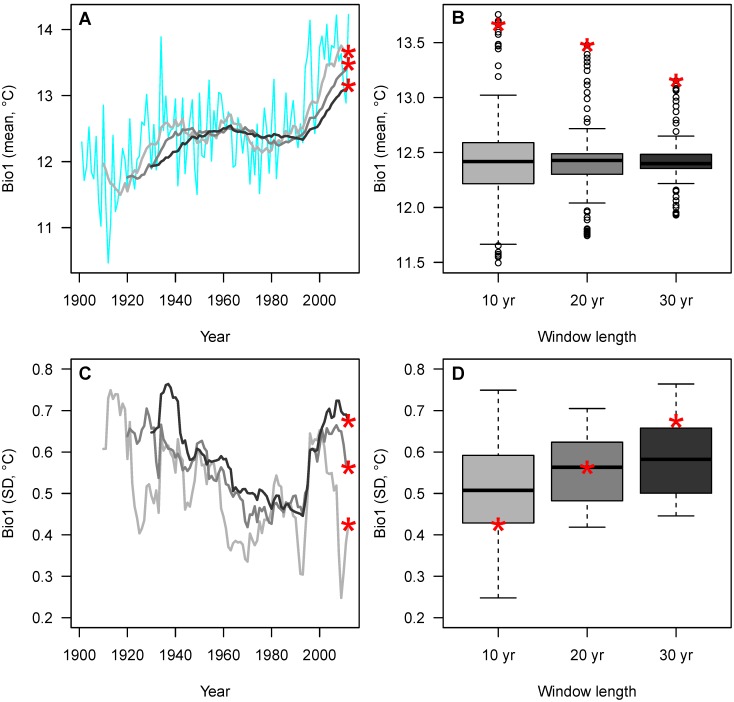
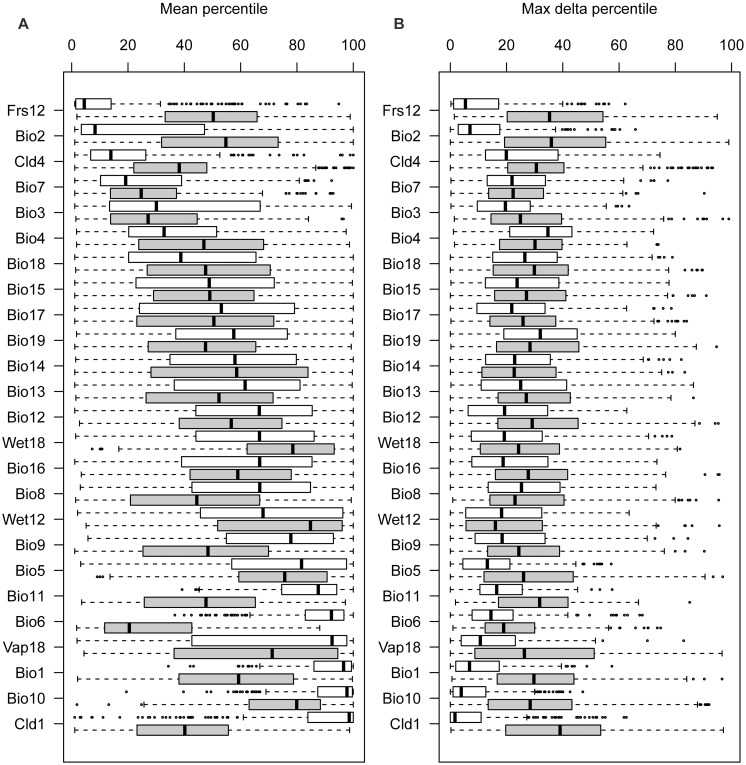
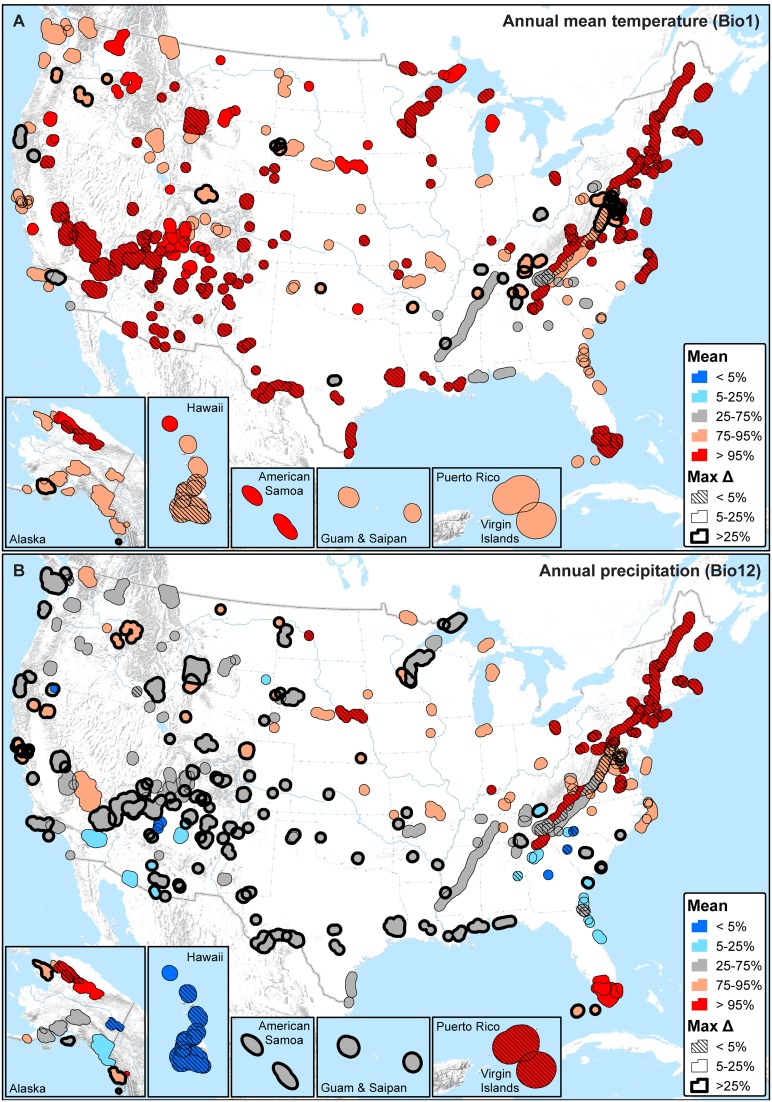
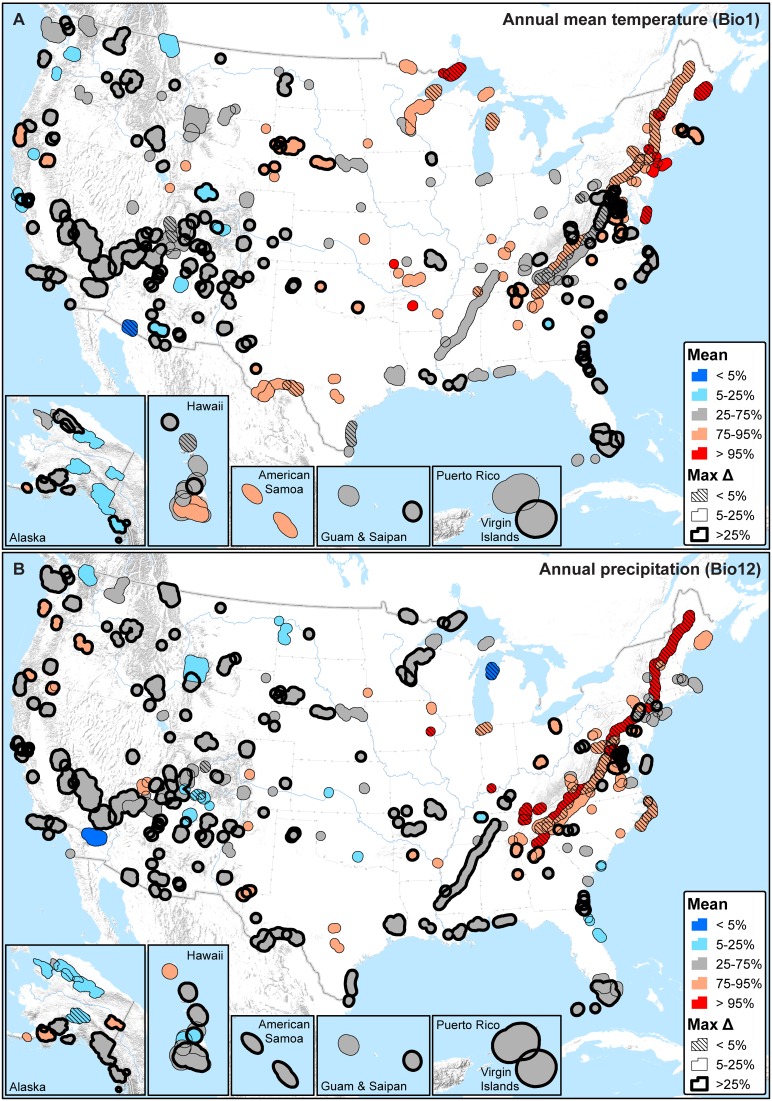
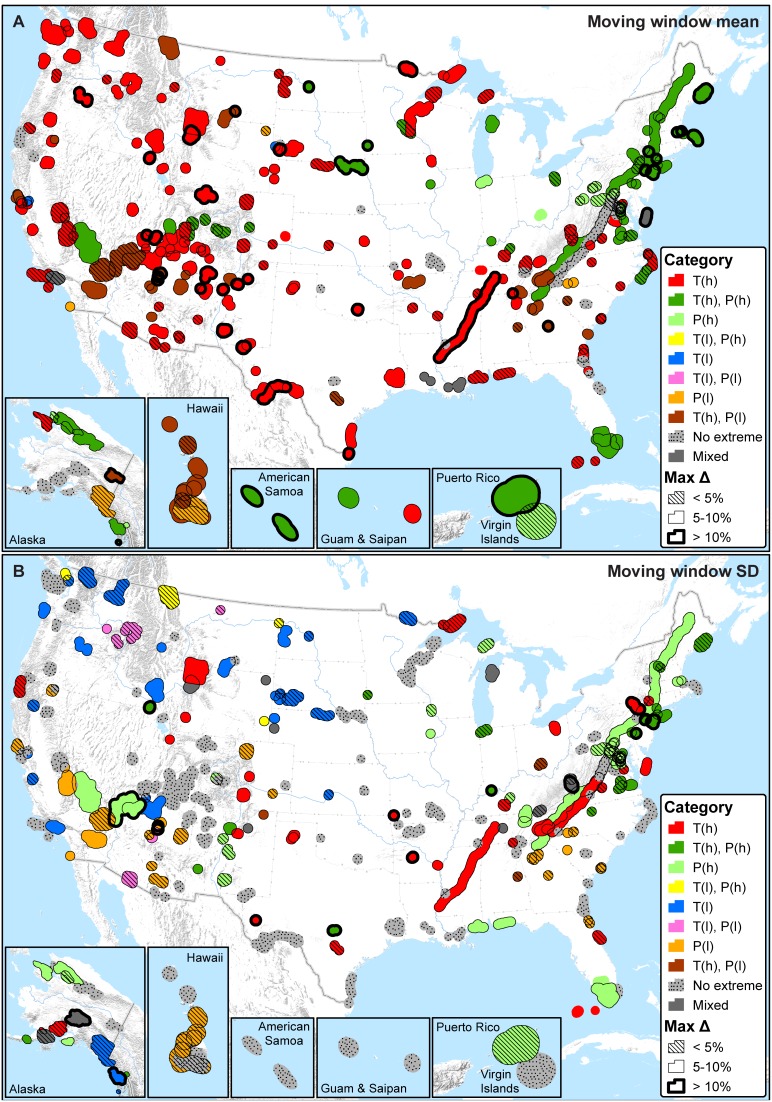
US national parks are challenged by climate and other forms of broad-scale environmental change that operate beyond administrative boundaries and in some instances are occurring at especially rapid rates. Here, we evaluate the climate change exposure of 289 natural resource parks administered by the US National Park Service (NPS), and ask which are presently (past 10 to 30 years) experiencing extreme (<5th percentile or >95th percentile) climates relative to their 1901-2012 historical range of variability (HRV). We consider parks in a landscape context (including surrounding 30 km) and evaluate both mean and inter-annual variation in 25 biologically relevant climate variables related to temperature, precipitation, frost and wet day frequencies, vapor pressure, cloud cover, and seasonality. We also consider sensitivity of findings to the moving time window of analysis (10, 20, and 30 year windows). Results show that parks are overwhelmingly at the extreme warm end of historical temperature distributions and this is true for several variables (e.g., annual mean temperature, minimum temperature of the coldest month, mean temperature of the warmest quarter). Precipitation and other moisture patterns are geographically more heterogeneous across parks and show greater variation among variables. Across climate variables, recent inter-annual variation is generally well within the range of variability observed since 1901. Moving window size has a measureable effect on these estimates, but parks with extreme climates also tend to exhibit low sensitivity to the time window of analysis. We highlight particular parks that illustrate different extremes and may facilitate understanding responses of park resources to ongoing climate change. We conclude with discussion of how results relate to anticipated future changes in climate, as well as how they can inform NPS and neighboring land management and planning in a new era of change.


Conflict of interest statement

Competing Interests: The authors have declared that no competing interests exist.

Figures

Figure 1
Figure 1. Example moving window time series (used to estimate HRV) and recent percentiles shown for Bio1 (annual mean temperature), Grand Canyon National Park (with 30 km buffer).
A, B) Moving window means; C, D) Moving window standard deviations (SD). Three moving windows –10 years (light gray), 20 years (medium gray), and 30 years (dark gray) – are calculated from the annual time series (blue, A). Bio1 values for the most recent windows (2003–2012 (10 yr), 1993–2012 (20 yr), 1983–2012 (30 yr)) are indicated by the red asterisks. Boxes in B and D are the inter-quartile range (median = thick perpendicular line), dashed lines the outer tails (1.5× inter-quartile range), and dots the outliers. Recent percentiles are calculated for the red asterisks shown in B and D.
Figure 2
Figure 2. Distribution of recent climate percentiles from each park (with 30 km buffer) for 25 biologically relevant climate variables, showing both moving window means (white boxes) and moving window standard deviation (gray boxes), calculated for three moving windows (10, 20, 30 years).
A) Mean percentile across windows; B) Maximum difference in percentile across windows. Boxes are the inter-quartile range (median = thick perpendicular line), dashed lines the outer tails (1.5× inter-quartile range), and dots the outliers. Climate variables are sorted based on median values of mean climate percentiles, thus for a large majority of parks, recent conditions include very low numbers of frost days (Frs12), low diurnal range (Bio2), very warm annual and summer temperatures (Bio1 and 10), and very high cloud cover (Cld1). See Table 1 for definitions of climate variables.
Figure 3
Figure 3. The average (Mean) and maximum difference (MaxΔ) of recent percentiles calculated for moving window means.
A) Annual mean temperature (Bio1); B) Annual precipitation (Bio12). Mean values provide an overall measure of recent (past 10, 20, and 30 year windows) climate change exposure with respect to 1901–2012 HRV, while the maximum difference measures sensitivity to moving window size (smaller values are less sensitive).
Figure 4
Figure 4. The average (Mean) and maximum difference (MaxΔ) of recent percentiles calculated for moving window standard deviations.
A) Annual mean temperature (Bio1); B) Annual precipitation (Bio12). Mean values provide an overall measure of recent (past 10, 20, and 30 year windows) climate change exposure with respect to 1901–2012 HRV, while the maximum difference measures sensitivity to moving window size (smaller values are less sensitive).
Figure 5
Figure 5. Summary of all temperature (Bio1, 5, 6, 8–11) and precipitation (Bio12–14, 16–19) variables with recent mean percentiles that are either less than the 5th percentile or greater than the 95th percentile (i.e., extreme on HRV).
A) Moving window means; B) Moving window standard deviations (SD). T(l) = one or more temperature variables low (<5th percentile; ‘cold’ or decreased inter-annual variability). T(h) = one or more temperature variables high (>95th percentile; ‘warm’ or increased inter-annual variability). P(l) = one or more precipitation variables low (<5th percentile; ‘dry’ or decreased inter-annual variability). P(h) = one or more precipitation variables high (>95th percentile; ‘wet’ or increased inter-annual variability). Parks with both T(l) and T(h) or both P(l) and P(h) are symbolized as ‘mixed’. Parks that fall between the 5th and 95th percentiles on all temperature and precipitation variables are symbolized as ‘no extreme’. The maximum difference (Max Δ) in percentile was calculated only for temperature and precipitation variables that were extreme; maximum values are reported to represent maximum sensitivity. Max Δ is undefined in the case of parks symbolized as ‘no extreme’; parks that fall into all other categories, and with a max Δ of 0, are also shown without outlines.

References

    1. National Parks Second Century Commission (2009) Advancing the National Park Idea: Science and Natural Resource Committee Report. National Parks Conservation Association. Available: http://www.npca.org/assets/pdf/Committee_Science.PDF. Accessed 2014 May.
    1. National Academy of Public Administration (2010) Strengthening America’s Best Idea: An Independent Review of the National Park Service’s Natural Resource Stewardship and Science Directorate. Washington DC: National Academy of Public Administration. Available: http://www.napawash.org/wp-content/uploads/2010/08/09-05.pdf. Accessed 2014 May.
    1. National Park System Advisory Board (2012) Revisiting Leopold: Resource Stewardship in the National Parks. Washington DC: National Park System Advisory Board. Available: http://www.nps.gov/calltoaction/PDF/LeopoldReport_2012.pdf. Accessed 2014 May.
    1. Cole DN, Landers PB (1996) Threats to wilderness ecosystems: Impacts and research needs. Ecol Appl 6: 168–184.
    1. Heller NE, Zavaleta ES (2009) Biodiversity management in the face of climate change: A review of 22 years of recommendations. Biol Conserv 142: 14–32.

Publication types