

Cytosolic phosphorylating glyceraldehyde-3-phosphate dehydrogenases affect Arabidopsis cellular metabolism and promote seed oil accumulation
- PMID: 24989043
- PMCID: PMC4145129
- DOI: 10.1105/tpc.114.126946
Cytosolic phosphorylating glyceraldehyde-3-phosphate dehydrogenases affect Arabidopsis cellular metabolism and promote seed oil accumulation
Abstract
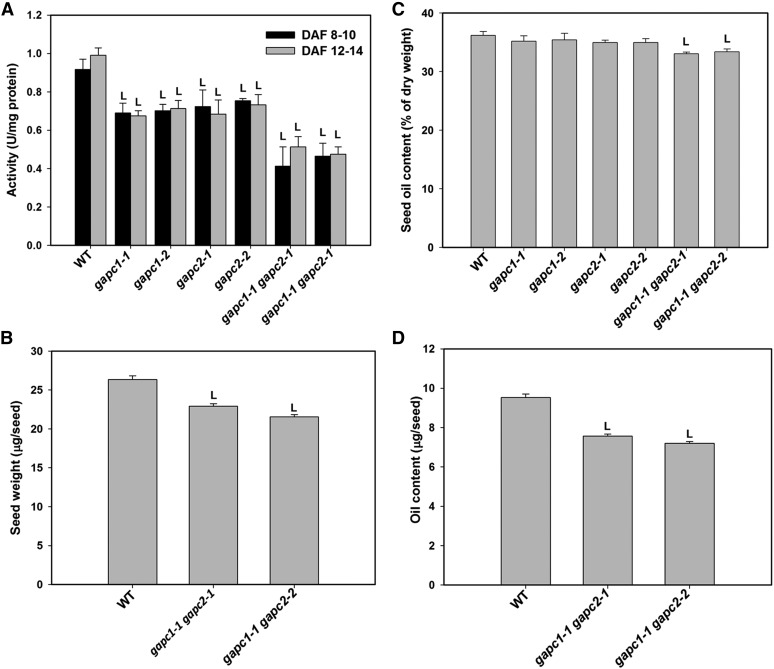
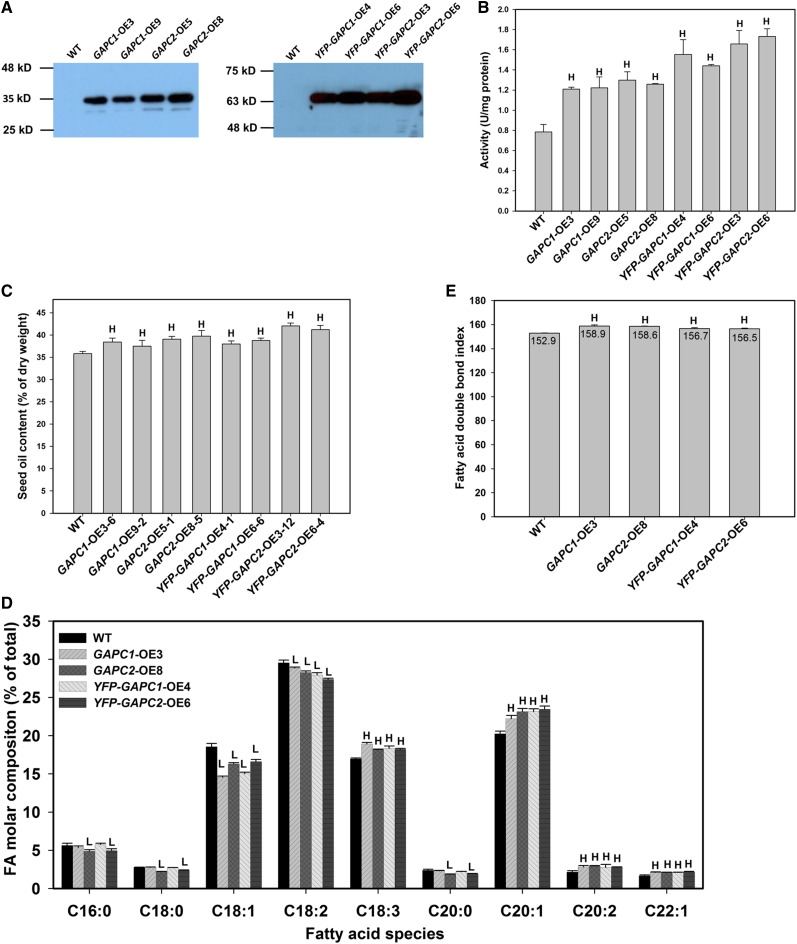
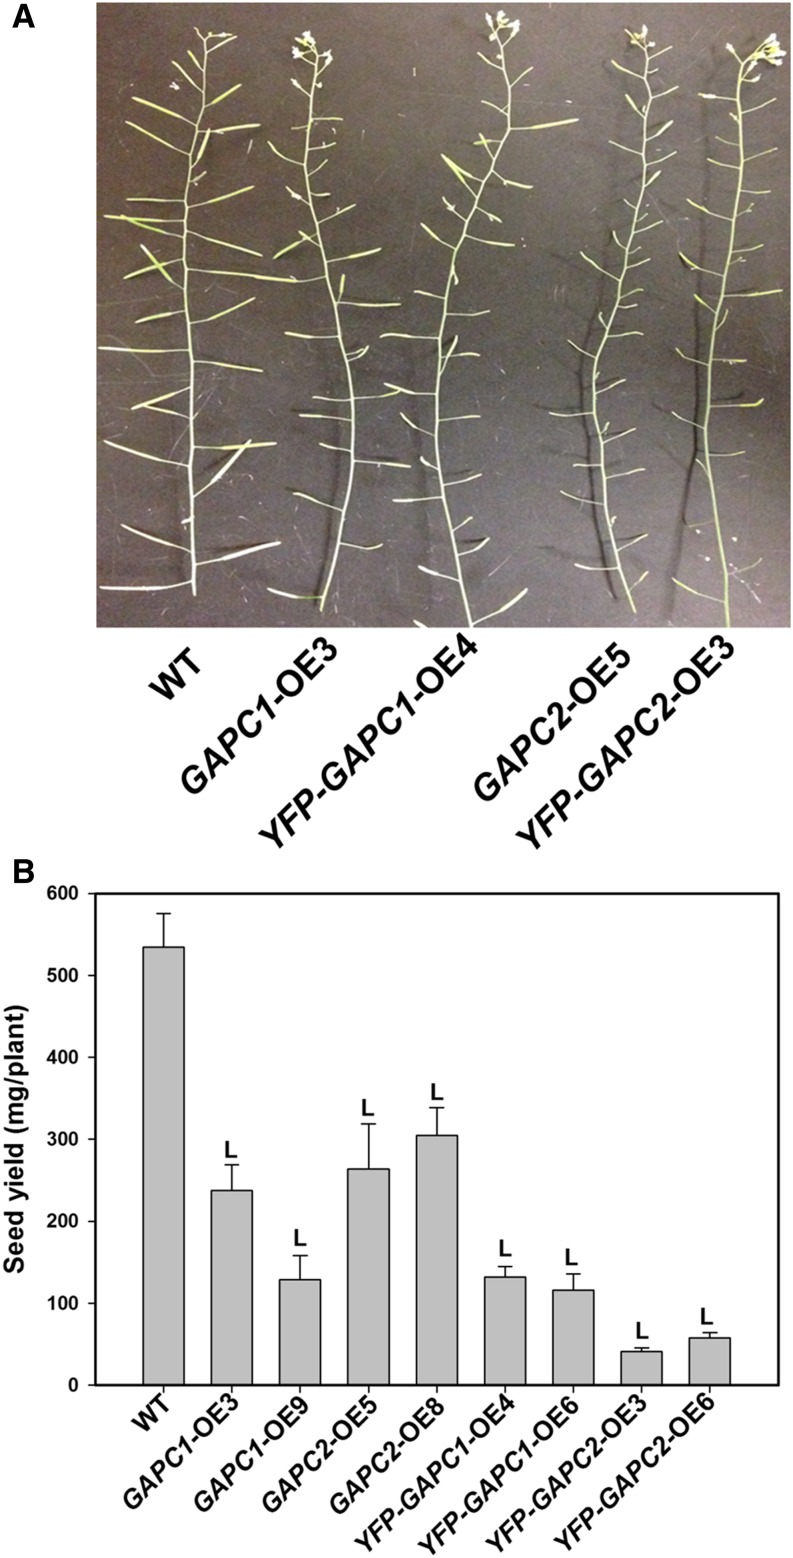
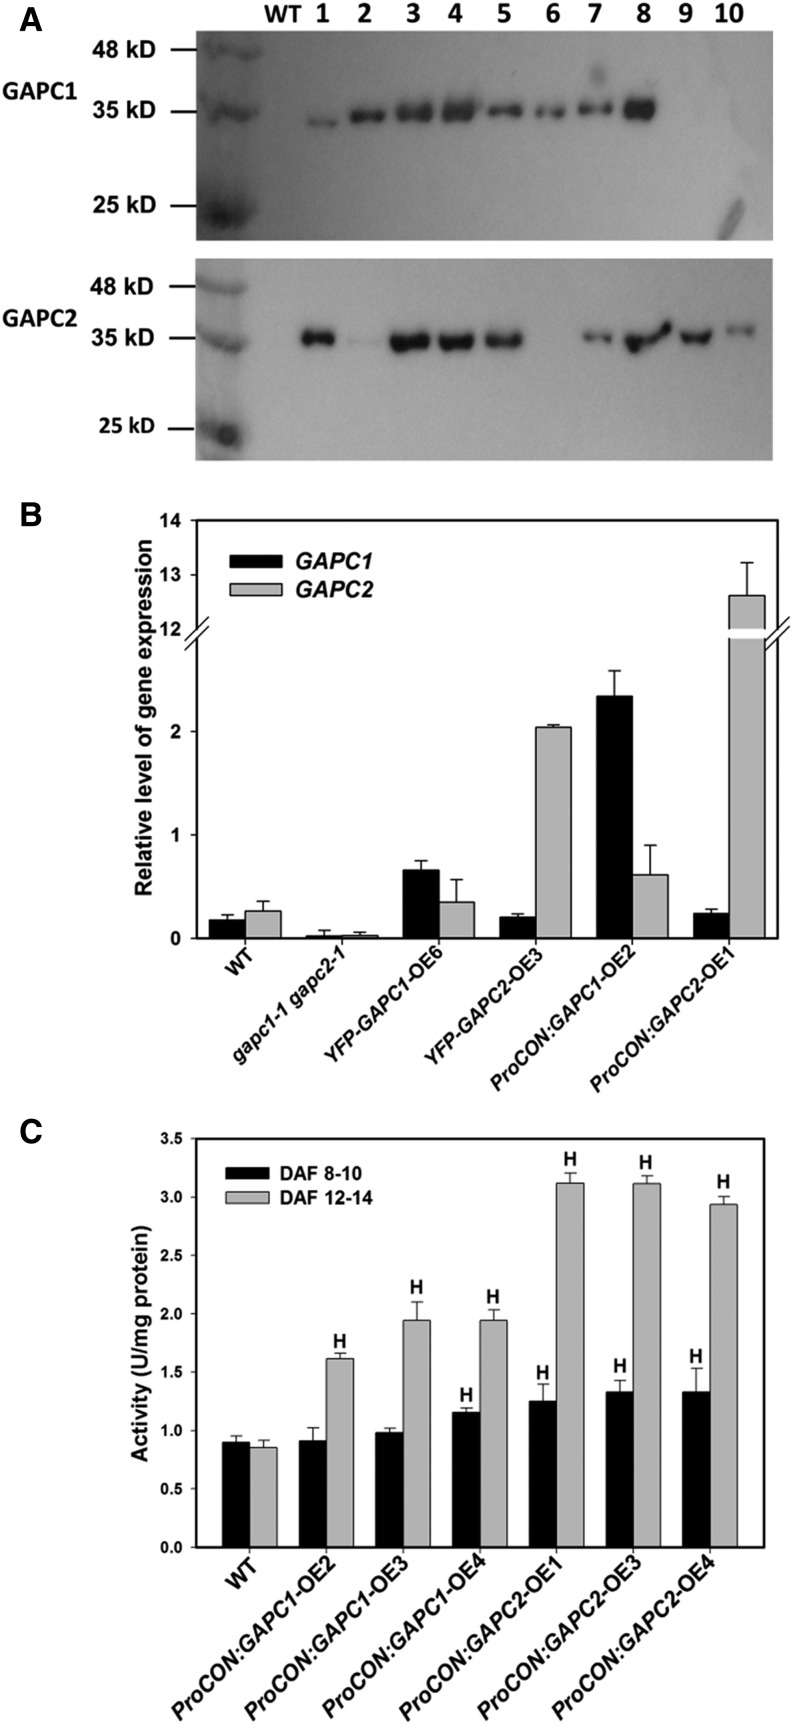
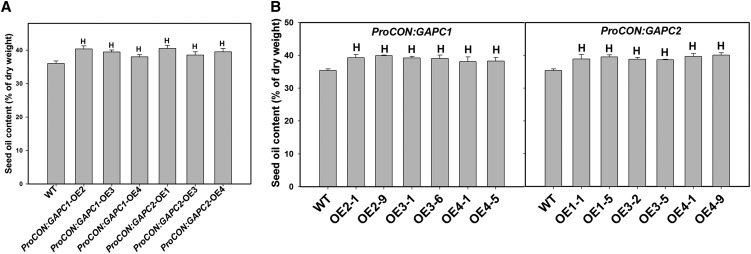
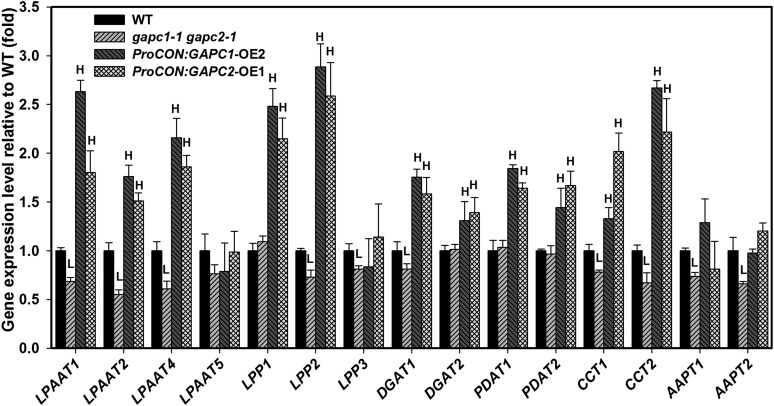
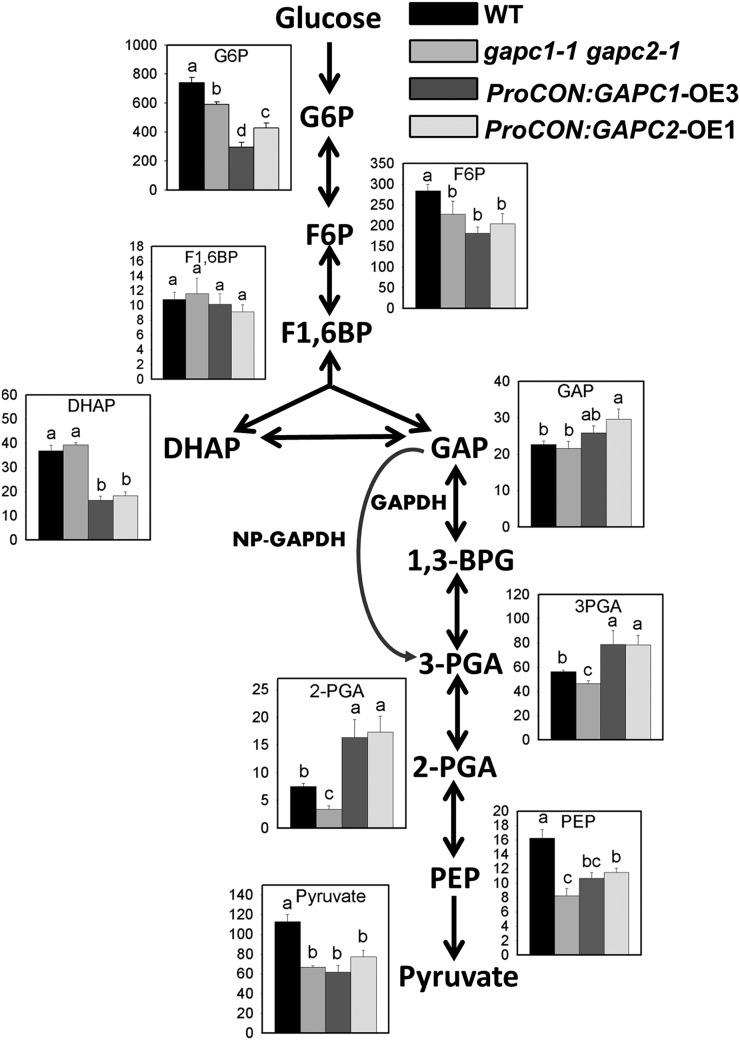
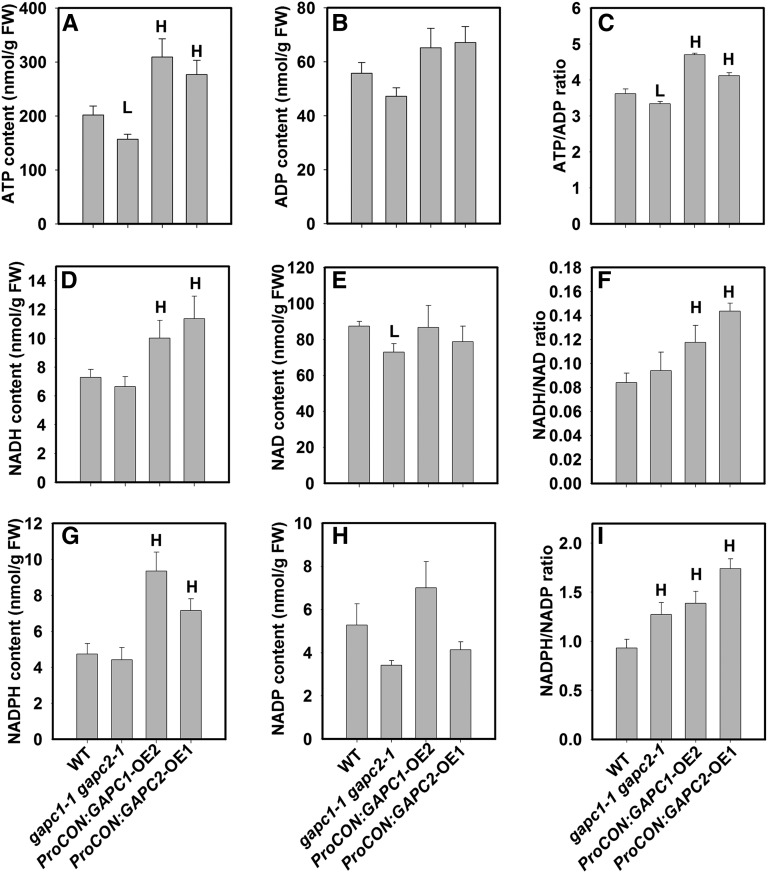
The cytosolic enzyme glyceraldehyde-3-phosphate dehydrogenase (GAPC) catalyzes a key reaction in glycolysis, but its contribution to plant metabolism and growth are not well defined. Here, we show that two cytosolic GAPCs play important roles in cellular metabolism and seed oil accumulation. Knockout or overexpression of GAPCs caused significant changes in the level of intermediates in the glycolytic pathway and the ratios of ATP/ADP and NAD(P)H/NAD(P). Two double knockout seeds had ∼3% of dry weight decrease in oil content compared with that of the wild type. In transgenic seeds under the constitutive 35S promoter, oil content was increased up to 42% of dry weight compared with 36% in the wild type and the fatty acid composition was altered; however, these transgenic lines exhibited decreased fertility. Seed-specific overexpression lines had >3% increase in seed oil without compromised seed yield or fecundity. The results demonstrate that GAPC levels play important roles in the overall cellular production of reductants, energy, and carbohydrate metabolites and that GAPC levels are directly correlated with seed oil accumulation. Changes in cellular metabolites and cofactor levels highlight the complexity and tolerance of Arabidopsis thaliana cells to the metabolic perturbation. Further implications for metabolic engineering of seed oil production are discussed.
© 2014 American Society of Plant Biologists. All rights reserved.
Figures
Similar articles
-
Plastidial glyceraldehyde-3-phosphate dehydrogenase deficiency leads to altered root development and affects the sugar and amino acid balance in Arabidopsis.Plant Physiol. 2009 Oct;151(2):541-58. doi: 10.1104/pp.109.143701. Epub 2009 Aug 12. Plant Physiol. 2009. PMID: 19675149 Free PMC article.
-
Oil and protein accumulation in developing seeds is influenced by the expression of a cytosolic pyrophosphatase in Arabidopsis.Plant Physiol. 2012 Jul;159(3):1221-34. doi: 10.1104/pp.112.198309. Epub 2012 May 7. Plant Physiol. 2012. PMID: 22566496 Free PMC article.
-
Characterization of Arabidopsis lines deficient in GAPC-1, a cytosolic NAD-dependent glyceraldehyde-3-phosphate dehydrogenase.Plant Physiol. 2008 Nov;148(3):1655-67. doi: 10.1104/pp.108.128769. Epub 2008 Sep 26. Plant Physiol. 2008. PMID: 18820081 Free PMC article.
-
Patatin-related phospholipase pPLAIIIδ increases seed oil content with long-chain fatty acids in Arabidopsis.Plant Physiol. 2013 May;162(1):39-51. doi: 10.1104/pp.113.216994. Epub 2013 Mar 29. Plant Physiol. 2013. PMID: 23542150 Free PMC article.
-
Metabolic flux analysis to increase oil in seeds.Plant Physiol. 2025 Feb 7;197(2):kiae595. doi: 10.1093/plphys/kiae595. Plant Physiol. 2025. PMID: 39499667 Free PMC article. Review.
Cited by
-
Nitric oxide alleviates salt stress through protein S-nitrosylation and transcriptional regulation in tomato seedlings.Planta. 2022 Oct 21;256(6):101. doi: 10.1007/s00425-022-04015-w. Planta. 2022. PMID: 36271196
-
Phospholipase Dδ and phosphatidic acid mediate heat-induced nuclear localization of glyceraldehyde-3-phosphate dehydrogenase in Arabidopsis.Plant J. 2022 Nov;112(3):786-799. doi: 10.1111/tpj.15981. Epub 2022 Sep 27. Plant J. 2022. PMID: 36111506 Free PMC article.
-
Transcriptomic Analysis of Rice Plants Overexpressing PsGAPDH in Response to Salinity Stress.Genes (Basel). 2021 Apr 25;12(5):641. doi: 10.3390/genes12050641. Genes (Basel). 2021. PMID: 33923067 Free PMC article.
-
Genetic and Biochemical Investigation of Seed Fatty Acid Accumulation in Arabidopsis.Front Plant Sci. 2022 Jul 6;13:942054. doi: 10.3389/fpls.2022.942054. eCollection 2022. Front Plant Sci. 2022. PMID: 35909728 Free PMC article.
-
Consequences of Oxidative Stress on Plant Glycolytic and Respiratory Metabolism.Front Plant Sci. 2019 Feb 18;10:166. doi: 10.3389/fpls.2019.00166. eCollection 2019. Front Plant Sci. 2019. PMID: 30833954 Free PMC article. Review.
References
-
- Allen D.K., Ohlrogge J.B., Shachar-Hill Y. (2009). The role of light in soybean seed filling metabolism. Plant J. 58: 220–234. - PubMed
-
- Alonso A.P., Val D.L., Shachar-Hill Y. (2011). Central metabolic fluxes in the endosperm of developing maize seeds and their implications for metabolic engineering. Metab. Eng. 13: 96–107. - PubMed
-
- Arrivault S., Guenther M., Ivakov A., Feil R., Vosloh D., van Dongen J.T., Sulpice R., Stitt M. (2009). Use of reverse-phase liquid chromatography, linked to tandem mass spectrometry, to profile the Calvin cycle and other metabolic intermediates in Arabidopsis rosettes at different carbon dioxide concentrations. Plant J. 59: 826–839. - PubMed
Publication types
MeSH terms
Substances
LinkOut - more resources
Full Text Sources
Other Literature Sources
Molecular Biology Databases
Research Materials
