

Inference of transcriptional networks in Arabidopsis through conserved noncoding sequence analysis
- PMID: 24989046
- PMCID: PMC4145110
- DOI: 10.1105/tpc.114.127001
Inference of transcriptional networks in Arabidopsis through conserved noncoding sequence analysis
Abstract
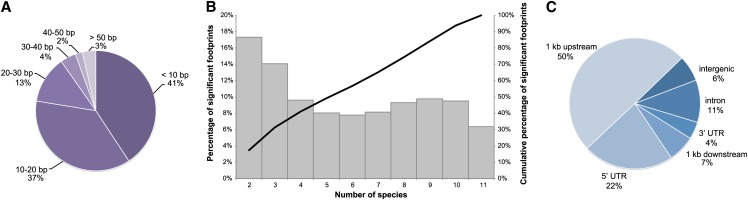
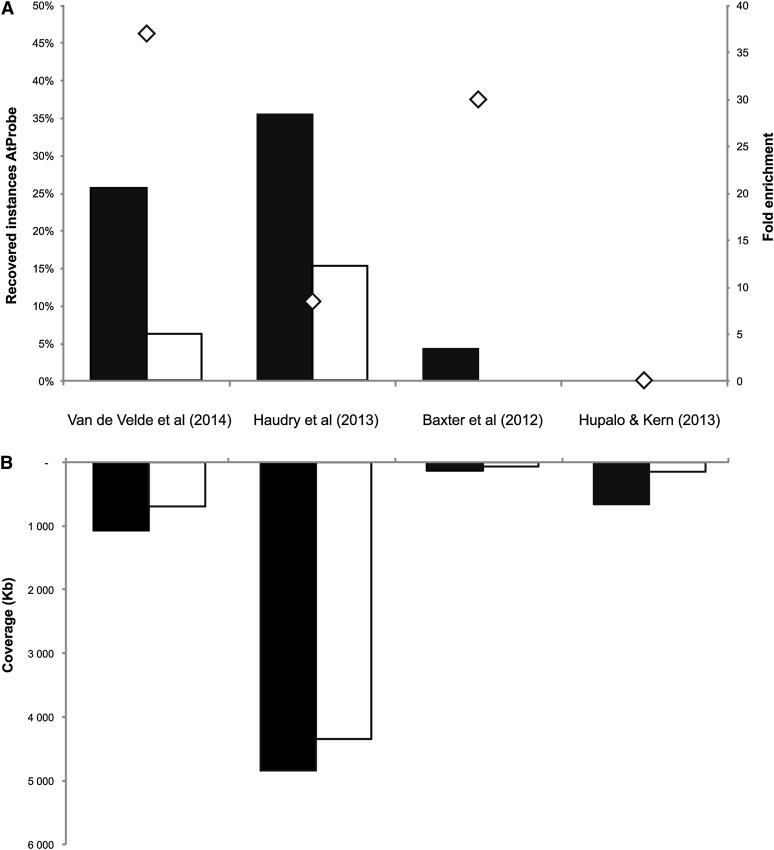
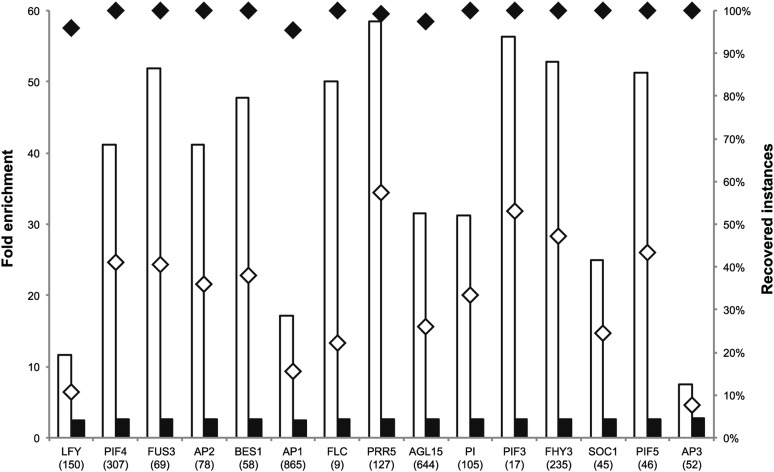
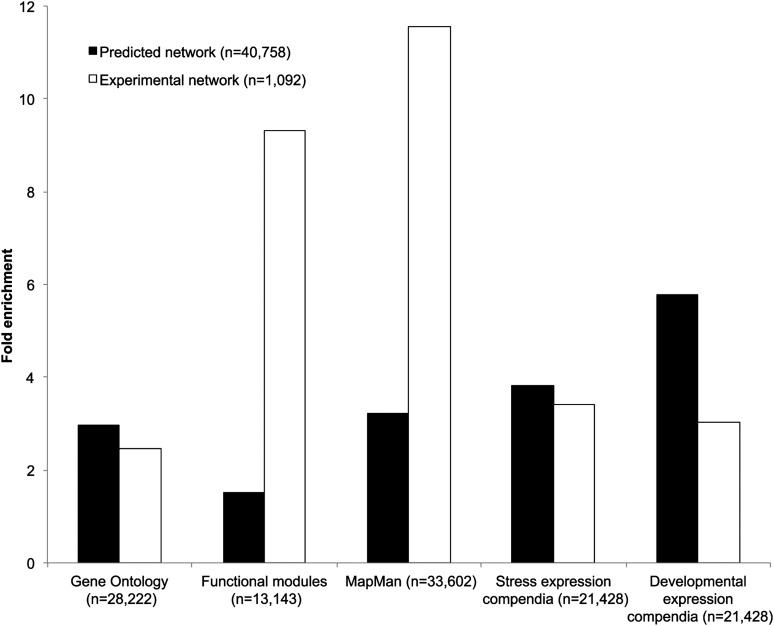
Transcriptional regulation plays an important role in establishing gene expression profiles during development or in response to (a)biotic stimuli. Transcription factor binding sites (TFBSs) are the functional elements that determine transcriptional activity, and the identification of individual TFBS in genome sequences is a major goal to inferring regulatory networks. We have developed a phylogenetic footprinting approach for the identification of conserved noncoding sequences (CNSs) across 12 dicot plants. Whereas both alignment and non-alignment-based techniques were applied to identify functional motifs in a multispecies context, our method accounts for incomplete motif conservation as well as high sequence divergence between related species. We identified 69,361 footprints associated with 17,895 genes. Through the integration of known TFBS obtained from the literature and experimental studies, we used the CNSs to compile a gene regulatory network in Arabidopsis thaliana containing 40,758 interactions, of which two-thirds act through binding events located in DNase I hypersensitive sites. This network shows significant enrichment toward in vivo targets of known regulators, and its overall quality was confirmed using five different biological validation metrics. Finally, through the integration of detailed expression and function information, we demonstrate how static CNSs can be converted into condition-dependent regulatory networks, offering opportunities for regulatory gene annotation.
© 2014 American Society of Plant Biologists. All rights reserved.
Figures
Similar articles
-
A Collection of Conserved Noncoding Sequences to Study Gene Regulation in Flowering Plants.Plant Physiol. 2016 Aug;171(4):2586-98. doi: 10.1104/pp.16.00821. Epub 2016 Jun 3. Plant Physiol. 2016. PMID: 27261064 Free PMC article.
-
Single-Base Resolution Map of Evolutionary Constraints and Annotation of Conserved Elements across Major Grass Genomes.Genome Biol Evol. 2018 Feb 1;10(2):473-488. doi: 10.1093/gbe/evy006. Genome Biol Evol. 2018. PMID: 29378032 Free PMC article.
-
Conserved noncoding sequences highlight shared components of regulatory networks in dicotyledonous plants.Plant Cell. 2012 Oct;24(10):3949-65. doi: 10.1105/tpc.112.103010. Epub 2012 Oct 30. Plant Cell. 2012. PMID: 23110901 Free PMC article.
-
Visualizing and characterizing in vivo DNA-binding events and direct target genes of plant transcription factors.Methods Mol Biol. 2011;754:293-305. doi: 10.1007/978-1-61779-154-3_17. Methods Mol Biol. 2011. PMID: 21720960 Review.
-
Mobility connects: transposable elements wire new transcriptional networks by transferring transcription factor binding motifs.Biochem Soc Trans. 2020 Jun 30;48(3):1005-1017. doi: 10.1042/BST20190937. Biochem Soc Trans. 2020. PMID: 32573687 Free PMC article. Review.
Cited by
-
Conserved noncoding sequences conserve biological networks and influence genome evolution.Heredity (Edinb). 2018 May;120(5):437-451. doi: 10.1038/s41437-018-0055-4. Epub 2018 Feb 3. Heredity (Edinb). 2018. PMID: 29396421 Free PMC article.
-
Integrative inference of transcriptional networks in Arabidopsis yields novel ROS signalling regulators.Nat Plants. 2021 Apr;7(4):500-513. doi: 10.1038/s41477-021-00894-1. Epub 2021 Apr 12. Nat Plants. 2021. PMID: 33846597
-
Enhanced Maps of Transcription Factor Binding Sites Improve Regulatory Networks Learned from Accessible Chromatin Data.Plant Physiol. 2019 Oct;181(2):412-425. doi: 10.1104/pp.19.00605. Epub 2019 Jul 25. Plant Physiol. 2019. PMID: 31345953 Free PMC article.
-
Selection for Improved Energy Use Efficiency and Drought Tolerance in Canola Results in Distinct Transcriptome and Epigenome Changes.Plant Physiol. 2015 Aug;168(4):1338-50. doi: 10.1104/pp.15.00155. Epub 2015 Jun 16. Plant Physiol. 2015. PMID: 26082400 Free PMC article.
-
Altered interactions between cis-regulatory elements partially resolve BLADE-ON-PETIOLE genetic redundancy in Capsella rubella.Plant Cell. 2024 Oct 3;36(10):4637-4657. doi: 10.1093/plcell/koae232. Plant Cell. 2024. PMID: 39158598 Free PMC article.
References
-
- Altschul S.F., Gish W., Miller W., Myers E.W., Lipman D.J. (1990). Basic local alignment search tool. J. Mol. Biol. 215: 403–410. - PubMed
-
- Baxter L., Jironkin A., Hickman R., Moore J., Barrington C., Krusche P., Dyer N.P., Buchanan-Wollaston V., Tiskin A., Beynon J., Denby K., Ott S. (2012). Conserved noncoding sequences highlight shared components of regulatory networks in dicotyledonous plants. Plant Cell 24: 3949–3965. - PMC - PubMed
Publication types
MeSH terms
Substances
LinkOut - more resources
Full Text Sources
Other Literature Sources
