. 2014 Sep;166(1):125-38.
doi: 10.1104/pp.114.240945. Epub 2014 Jul 2.

A new LxxxA motif in the transmembrane Helix3 of maize aquaporins belonging to the plasma membrane intrinsic protein PIP2 group is required for their trafficking to the plasma membrane

Affiliations

A new LxxxA motif in the transmembrane Helix3 of maize aquaporins belonging to the plasma membrane intrinsic protein PIP2 group is required for their trafficking to the plasma membrane

Adrien S Chevalier et al. Plant Physiol. 2014 Sep.

Abstract

Aquaporins play important roles in maintaining plant water status under challenging environments. The regulation of aquaporin density in cell membranes is essential to control transcellular water flows. This work focuses on the maize (Zea mays) plasma membrane intrinsic protein (ZmPIP) aquaporin subfamily, which is divided into two sequence-related groups (ZmPIP1s and ZmPIP2s). When expressed alone in mesophyll protoplasts, ZmPIP2s are efficiently targeted to the plasma membrane, whereas ZmPIP1s are retained in the endoplasmic reticulum (ER). A protein domain-swapping approach was utilized to demonstrate that the transmembrane domain3 (TM3), together with the previously identified N-terminal ER export diacidic motif, account for the differential localization of these proteins. In addition to protoplasts, leaf epidermal cells transiently transformed by biolistic particle delivery were used to confirm and refine these results. By generating artificial proteins consisting of a single transmembrane domain, we demonstrated that the TM3 of ZmPIP1;2 or ZmPIP2;5 discriminates between ER and plasma membrane localization, respectively. More specifically, a new LxxxA motif in the TM3 of ZmPIP2;5, which is highly conserved in plant PIP2s, was shown to regulate its anterograde routing along the secretory pathway, particularly its export from the ER.


Figures

Figure 1.
Figure 1.
Swapping TM3 of ZmPIP2;5 with that of ZmPIP1;2 retains the protein in intracellular structures. A, Cartoons representing the chimeric proteins composed of ZmPIP2;5, in which each TM has been replaced by the corresponding TM from ZmPIP1;2. All proteins are drawn with the cytosolic domains facing down. ZmPIP2;5 and ZmPIP1;2 portions are shown in black and white, respectively. All chimeras were fused to the C terminus of mYFP, which is not displayed for clarity purposes. B, Confocal microscopy images of maize mesophyll protoplasts transiently coexpressing mYFP-tagged ZmPIP2;5-PIP1;2 TM chimeric proteins (green) and the ER marker mCFP:HDEL (cyan). FM4-64 was added as a PM marker (red). Arrowheads in image 13 indicate accumulation of the protein in punctate structures that are not labeled by mCFP:HDEL. The localization patterns of the proteins of interest are representative of a total of at least 22 cells from three independent experiments. C, Confocal microscopy images of a maize mesophyll protoplast transiently expressing mYFP:ZmPIP2;5-TM3PIP1;2 (green) and ST:mCFP (magenta). Arrowheads indicate colocalization in Golgi stacks. The images are representative of a total of 17 cells from two independent experiments. Bar = 5 µm.
Figure 2.
Figure 2.
The double mutant mYFP:ZmPIP2;5L127F/A131M is retained in intracellular structures. A, Alignment of the TM3 region exchanged between ZmPIP2;5 and ZmPIP1;2. The residues that differ between both proteins are highlighted in gray. Mutations introduced in ZmPIP2;5 are indicated below the alignment. The dashed-line box highlights the predicted TM3. The alignment was generated using ClustalW2 (http://www.ebi.ac.uk/Tools/msa/clustalw2/). B, Confocal microscopy images of maize mesophyll protoplasts transiently expressing wild-type or mutated mYFP:ZmPIP2;5 proteins (green). FM4-64 was added as a PM marker (magenta). C, Homology model of the ZmPIP2;5 homotetramer. One subunit is highlighted in green, with its TM3 shown in blue. The residues of ZmPIP2;5 that differ from ZmPIP1;2 in this region are represented in yellow and labeled. D, Confocal microscopy images of maize mesophyll protoplasts transiently expressing YFP-tagged mutated ZmPIP2;5 proteins (green) chosen on the basis of the model in C. FM4-64 was added as a PM marker (magenta). E, Quantification of the relative mYFP fluorescence intensity in the PM of protoplasts expressing wild-type or mutated mYFP:ZmPIP2;5 proteins as shown in D. The y axis shows the fluorescence ratio between the PM and the whole cell. Error bars are confidence intervals (a = 0.05). The letter above each bar represents statistical classes determined by a Bonferroni test (P < 0.001). The localization patterns of the proteins of interest are representative of a total of at least 29 cells from a minimum of two independent experiments (B and D). Fluorescence calculations in E were performed using the same data set. Bar = 5 µm.
Figure 3.
Figure 3.
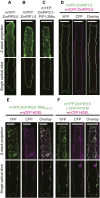
Transient expression in intact leaf epidermal cells confirms localization data obtained in protoplasts. Maize leaf epidermal cells transiently expressing mYFP:ZmPIP2;5 (A), mYFP:ZmPIP1;2 (B), mYFP:ZmPIP2;1-PIP1;2Mix (C), mYFP:ZmPIP1;2 (green) and mCFP:ZmPIP2;5 (magenta; D), mYFP:ZmPIP2;5-TM3PIP1;2 (green) and mCFP:HDEL (magenta; E), and mYFP:ZmPIP2;5L127F/A131M (green) and mCFP:HDEL (magenta; F). When necessary, half of the cell is shown as the maximum projection of a Z-stack to better visualize intracellular structures (A, B, C, E, and F). The localization patterns of the proteins of interest are representative of a total of at least 14 cells from a minimum of two independent experiments, except for mYFP:ZmPIP2;1-PIP1;2Mix and mYFP:ZmPIP2;5L127F/A131M, for which only four and six cells were observed, respectively. Bar = 20 µm.
Figure 4.
Figure 4.
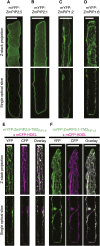
Intracellular retention of ZmPIP2s due to the insertion of a PIP1 TM3 is isoform independent. Maize leaf epidermal cells transiently expressing mYFP:ZmPIP2;5 (A), mYFP:ZmPIP2;1 (B), mYFP:ZmPIP1;2 (C), mYFP:ZmPIP1;6 (D), mYFP:ZmPIP2;5-TM3PIP1;6 (green) and mCFP:HDEL (magenta; E), and mYFP:ZmPIP2;1-TM3PIP1;2 (green) and mCFP:HDEL (magenta; F). The top half of each cell is shown as a maximum projection of a Z-stack to visualize intracellular structures. The localization patterns of the proteins of interest are representative of a total of at least 10 cells from a minimum of two independent experiments, except for mYFP:ZmPIP2;5-TM3PIP1;6 and mYFP:ZmPIP2;1-TM3PIP1;2 for which seven and eight cells were observed, respectively. Bar = 20 µm.
Figure 5.
Figure 5.
The TM3 of ZmPIPs is sufficient to discriminate between ER and PM localization. Maize leaf epidermal cells expressing mYFP:ZmPIP2;5 (A), mYFP:ZmPIP1;2 (B), the TM3 of ZmPIP2;5 fused to the mYFP (C), and the TM3 of ZmPIP1;2 fused to the mYFP (D). Cartoons in C and D represent the single TM reporter proteins. The top half of each cell is shown as a maximum projection of a Z-stack to visualize intracellular structures. The localization patterns of the proteins of interest are representative of a total of at least 15 cells from three independent experiments. Bar = 20 µm.
Figure 6.
Figure 6.
Swapping the TM3 of ZmPIP1;2 with that of ZmPIP2;5 does not allow the protein to reach the PM. A, Cartoons representing ZmPIP1;2-NPIP2;5, ZmPIP1;2-TM3PIP2;5, and ZmPIP1;2-N+TM3PIP2;5. ZmPIP1;2 and ZmPIP2;5 are shown in white and black, respectively. The proteins are drawn with the cytosolic domains facing down. They were fused to the C-terminal end of the mYFP, which is not displayed for clarity purposes. B, Confocal microscopy images of maize mesophyll protoplasts transiently coexpressing mYFP:ZmPIP1;2, mYFP:ZmPIP1;2-NPIP2;5, mYFP:ZmPIP1;2-TM3PIP2;5, or mYFP:ZmPIP1;2-N+TM3PIP2;5 (green) and the ER marker mCFP:HDEL (magenta). Arrowheads in images 4 and 10 show punctate structures that are seen only in the YFP channel. The localization patterns of the proteins of interest are representative of a total of at least 27 cells from three independent experiments. Bar = 5 µm.
Figure 7.
Figure 7.
Water transport activity of the ZmPIP2;5-TM3PIP1;2 chimera. Water permeability coefficients of X. laevis oocytes injected with water (negative control), or cRNA encoding ZmPIP2;5 (positive control), ZmPIP2;5 and ZmPIP1;2 (positive control for the synergistic effect), ZmPIP2;5-TM3PIP1;2, or ZmPIP2;5-TM3PIP1;2 and ZmPIP2;5. Error bars are confidence intervals (a = 0.05). The letter above each bar represents statistical classes determined by a Bonferroni test (P < 0.001). At least 12 oocytes injected with each cRNA were assayed, except for the negative control (water), for which the swelling of eight cells was recorded. Three independent experiments were performed.
Figure 8.
Figure 8.
Working model for TM-based trafficking signals. A, Protein-protein interaction: intermediate protein. The protein of interest (green cylinder) interacts with another membrane protein (blue cylinder) via the TM-based motif (red circle), which in turn interacts with a transport protein (orange circle) that exports the complex from its compartment. The membrane of the compartment is shown in light gray. B, Protein-protein interaction: conformational change. The protein of interest interacts with another membrane protein via the TM-based motif. This interaction induces a conformational change, which exposes a classical, cytosol-exposed, export motif (yellow circle). A transport protein is then recruited by classical mechanisms. C, Protein-lipid interaction: membrane domain bulk-flow. The TM-based motif segregates the protein of interest in a specific, export-competent, domain of the membrane (dark gray). All proteins present in this domain are exported due to the interaction of a transport protein with classical export signals present on some of the proteins present in this membrane domain. D, Protein-lipid interaction: membrane domain segregation and conformational change. The TM-based motif segregates the protein of interest in a specific, export-competent, domain of the membrane. This induces a conformational change, releasing a classical, cytosol-exposed, sorting signal. The transport machinery is then recruited according to well-known mechanisms.

Similar articles

Cited by

References

    1. Anderberg HI, Kjellbom P, Johanson U. (2012) Annotation of Selaginella moellendorffii Major Intrinsic Proteins and the evolution of the protein family in terrestrial plants. Front Plant Sci 3: 33. - PMC - PubMed
    1. Ayadi M, Cavez D, Miled N, Chaumont F, Masmoudi K. (2011) Identification and characterization of two plasma membrane aquaporins in durum wheat (Triticum turgidum L. subsp. durum) and their role in abiotic stress tolerance. Plant Physiol Biochem 49: 1029–1039 - PubMed
    1. Bansal A, Sankararamakrishnan R. (2007) Homology modeling of major intrinsic proteins in rice, maize and Arabidopsis: comparative analysis of transmembrane helix association and aromatic/arginine selectivity filters. BMC Struct Biol 7: 27. - PMC - PubMed
    1. Barlowe C. (2003) Signals for COPII-dependent export from the ER: What’s the ticket out? Trends Cell Biol 13: 295–300 - PubMed
    1. Bassham DC, Brandizzi F, Otegui MS, Sanderfoot AA (2008) The Secretory System of Arabidopsis. 6: e0116, /10.1199/tab.0116 - PMC - PubMed

Publication types

Associated data

LinkOut - more resources