

On the feasibility of comprehensive high-resolution 3D remote dosimetry
- PMID: 24989375
- PMCID: PMC4105963
- DOI: 10.1118/1.4884018
On the feasibility of comprehensive high-resolution 3D remote dosimetry
Abstract
Purpose: This study investigates the feasibility of remote high-resolution 3D dosimetry with the PRESAGE®/Optical-CT system. In remote dosimetry, dosimeters are shipped out from a central base institution to a remote institution for irradiation, then shipped back to the base institution for subsequent readout and analysis.
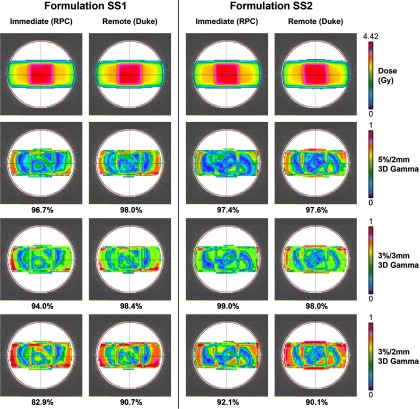
Methods: Two nominally identical optical-CT scanners for 3D dosimetry were constructed and placed at the base (Duke University) and remote (Radiological Physics Center) institutions. Two formulations of PRESAGE® (SS1, SS2) radiochromic dosimeters were investigated. Higher sensitivity was expected in SS1, which had higher initiator content (0.25% bromotrichloromethane), while greater temporal stability was expected in SS2. Four unirradiated PRESAGE® dosimeters (two per formulation, cylindrical dimensions 11 cm diameter, 8.5-9.5 cm length) were imaged at the base institution, then shipped to the remote institution for planning and irradiation. Each dosimeter was irradiated with the same simple treatment plan: an isocentric 3-field "cross" arrangement of 4 × 4 cm open 6 MV beams configured as parallel opposed laterals with an anterior beam. This simple plan was amenable to accurate and repeatable setup, as well as accurate dose modeling by a commissioned treatment planning system (Pinnacle). After irradiation and subsequent (within 1 h) optical-CT readout at the remote institution, the dosimeters were shipped back to the base institution for remote dosimetry readout 3 days postirradiation. Measured on-site and remote relative 3D dose distributions were registered to the Pinnacle dose calculation, which served as the reference distribution for 3D gamma calculations with passing criteria of 5%/2 mm, 3%/3 mm, and 3%/2 mm with a 10% dose threshold. Gamma passing rates, dose profiles, and color-maps were all used to assess and compare the performance of both PRESAGE® formulations for remote dosimetry.
Results: The best agreements between the Pinnacle plan and dosimeter readout were observed in PRESAGE® formulation SS2. Under 3%/3 mm 3D gamma passing criteria, passing rates were 91.5% ± 3.6% (SS1) and 97.4% ± 2.2% (SS2) for immediate on-site dosimetry, 96.7% ± 2.4% (SS1) and 97.6% ± 0.6% (SS2) for remote dosimetry. These passing rates are well within TG119 recommendations (88%-90% passing). Under the more stringent criteria of 3%/2 mm, there is a pronounced difference [8.0 percentage points (pp)] between SS1 formulation passing rates for immediate and remote dosimetry while the SS2 formulation maintains both higher passing rates and consistency between immediate and remote results (differences ≤ 1.2 pp) at all metrics. Both PRESAGE® formulations under study maintained high linearity of dose response (R(2) > 0.996) for 1-8 Gy over 14 days with response slope consistency within 4.9% (SS1) and 6.6% (SS2), and a relative dose distribution that remained stable over time was demonstrated in the SS2 dosimeters.
Conclusions: Remote 3D dosimetry was shown to be feasible with a PRESAGE® dosimeter formulation (SS2) that exhibited relative temporal stability and high accuracy when read off-site 3 days postirradiation. Characterization of the SS2 dose response demonstrated linearity (R(2) > 0.998) over 14 days and suggests accurate readout over longer periods of time would be possible. This result provides a foundation for future investigations using remote dosimetry to study the accuracy of advanced radiation treatments. Further work is planned to characterize dosimeter reproducibility and dose response over longer periods of time.
Figures


References
-
- Ibbott G. S., Followill D. S., Molineu H. A., Lowenstein J. R., Alvarez P. E., and Roll J. E., “Challenges in credentialing institutions and participants in advanced technology multi-institutional clinical trials,” Int. J. Radiat. Oncol., Biol., Phys. 71(1 Suppl), S71–S75 (2008).10.1016/j.ijrobp.2007.08.083 - DOI - PMC - PubMed
-
- Molineu A., Followill D. S., Balter P. A., Hanson W. F., Gillin M. T., Huq M. S., Eisbruch A., and Ibbott G. S., “Design and implementation of an anthropomorphic quality assurance phantom for intensity-modulated radiation therapy for the Radiation Therapy Oncology Group,” Int. J. Radiat. Oncol., Biol., Phys. 63(2), 577–583 (2005).10.1016/j.ijrobp.2005.05.021 - DOI - PubMed
-
- Followill D. S., Evans D. R., Cherry C., Molineu A., Fisher G., Hanson W. F., and Ibbott G. S., “Design, development, and implementation of the Radiological Physics Center's pelvis and thorax anthropomorphic quality assurance phantoms,” Med. Phys. 34(6), 2070–2076 (2007).10.1118/1.2737158 - DOI - PubMed
Publication types
MeSH terms
Grants and funding
LinkOut - more resources
Full Text Sources
Other Literature Sources
Miscellaneous
