. 2014 Oct;57(10):2066-75.
doi: 10.1007/s00125-014-3311-z. Epub 2014 Jul 4.

Mig6 haploinsufficiency protects mice against streptozotocin-induced diabetes

Affiliations

Mig6 haploinsufficiency protects mice against streptozotocin-induced diabetes

Yi-Chun Chen et al. Diabetologia. 2014 Oct.

Abstract

Aims/hypothesis: EGF and gastrin co-administration reverses type 1 diabetes in rodent models. However, the failure of this to translate into a clinical treatment suggests that EGF-mediated tissue repair is a complicated process and warrants further investigation. Thus, we aimed to determine whether EGF receptor (EGFR) feedback inhibition by mitogen-inducible gene 6 protein (MIG6) limits the effectiveness of EGF therapy and promotes type 1 diabetes development.

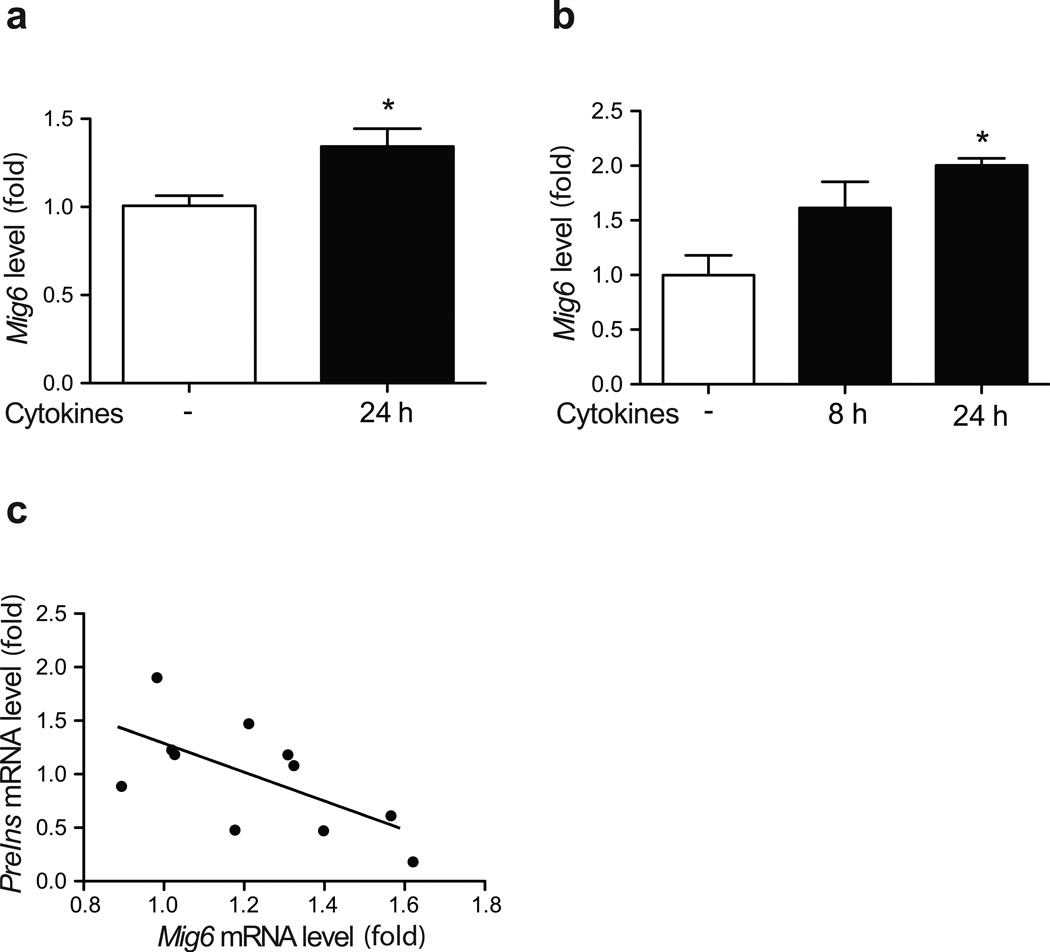
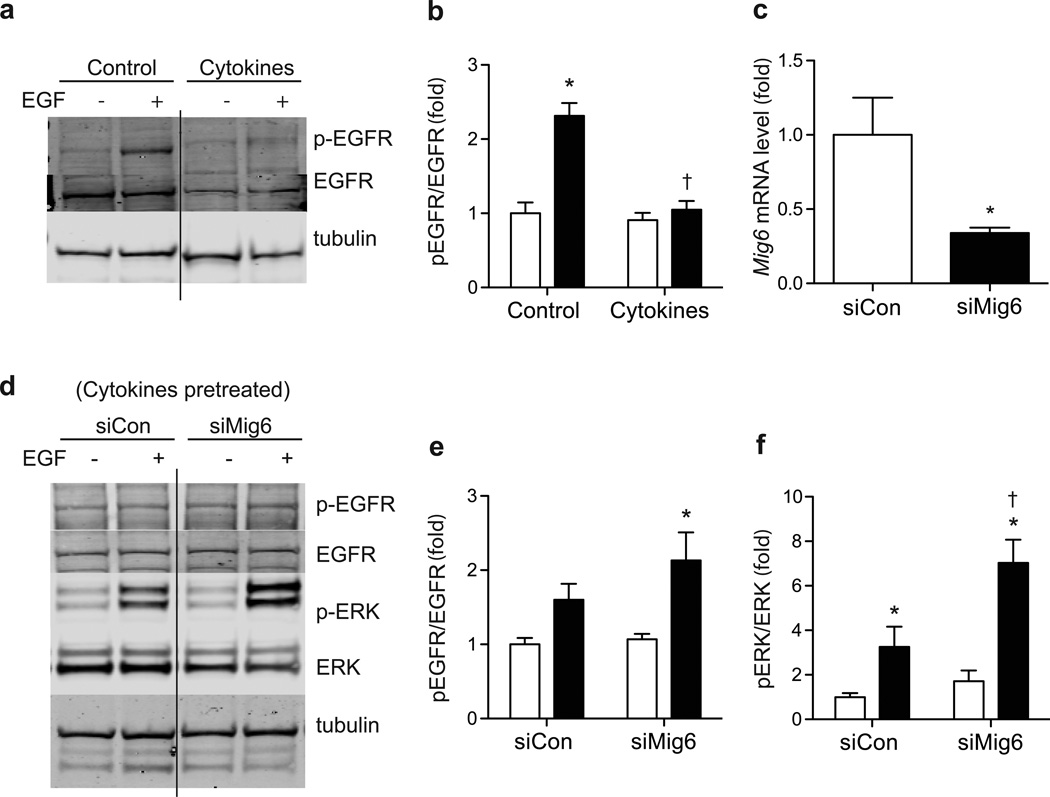
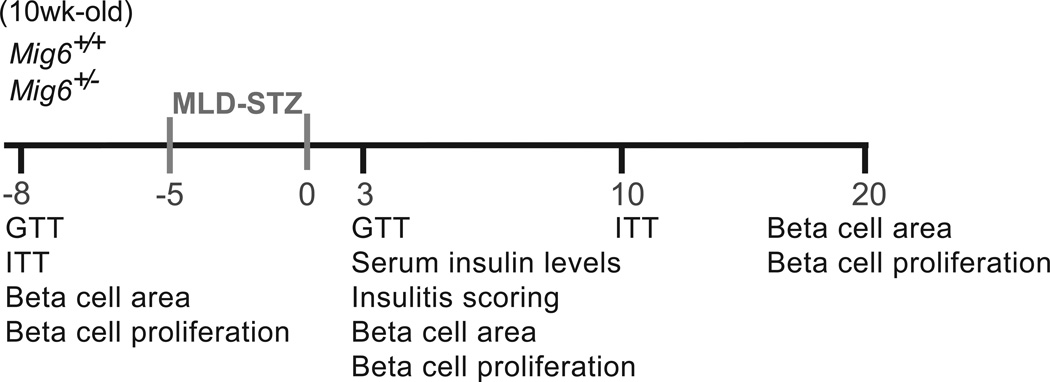
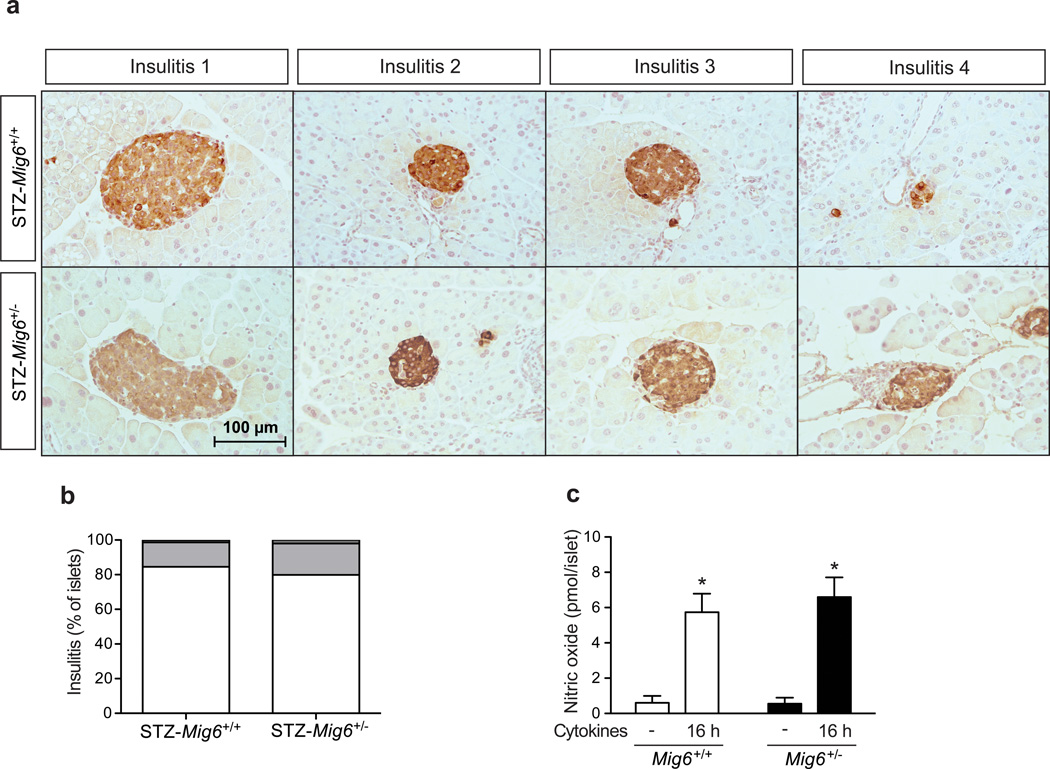
Methods: We treated Mig6 (also known as Errfi1) haploinsufficient mice (Mig6 (+/-)) and their wild-type littermates (Mig6 (+/+)) with multiple low doses of streptozotocin (STZ), and monitored diabetes development via glucose homeostasis tests and histological analyses. We also investigated MIG6-mediated cytokine-induced desensitisation of EGFR signalling and the DNA damage repair response in 832/13 INS-1 beta cells.

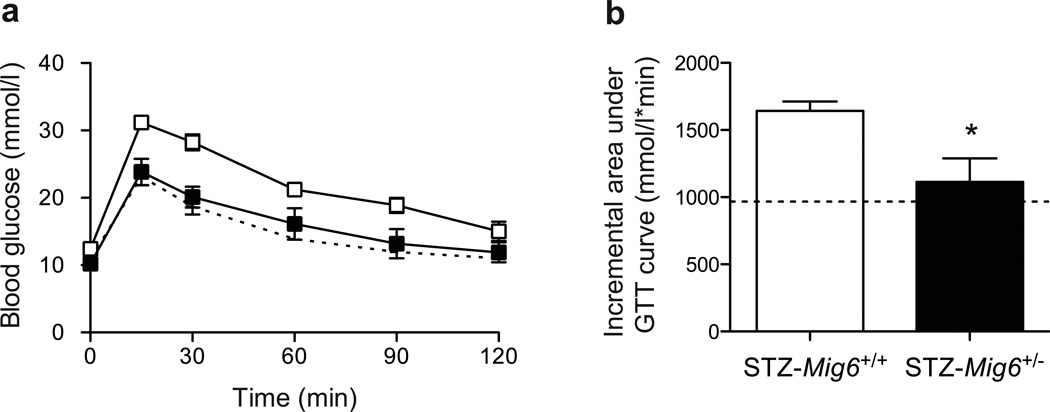
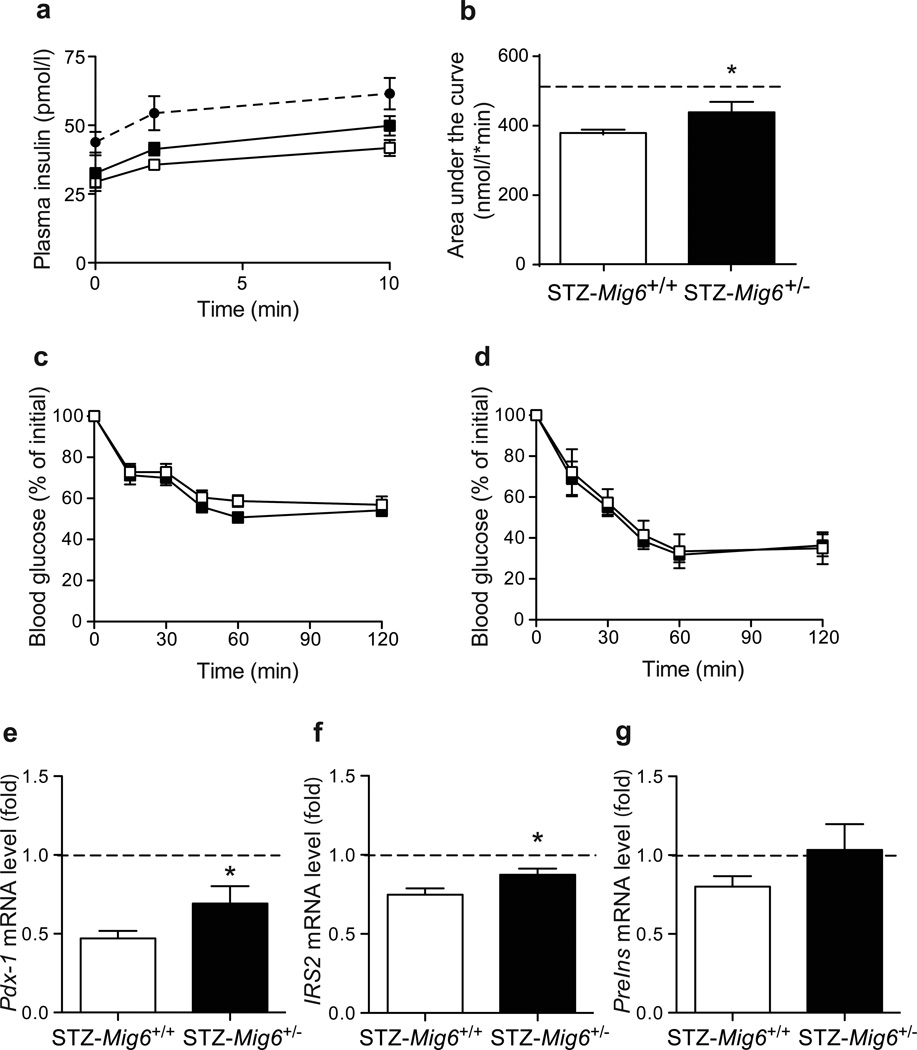
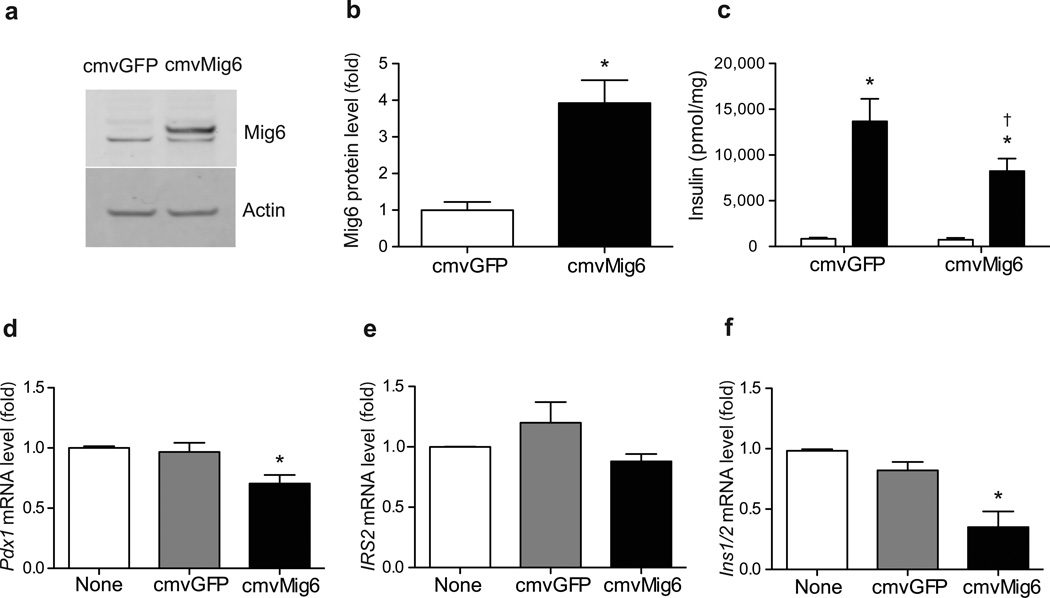
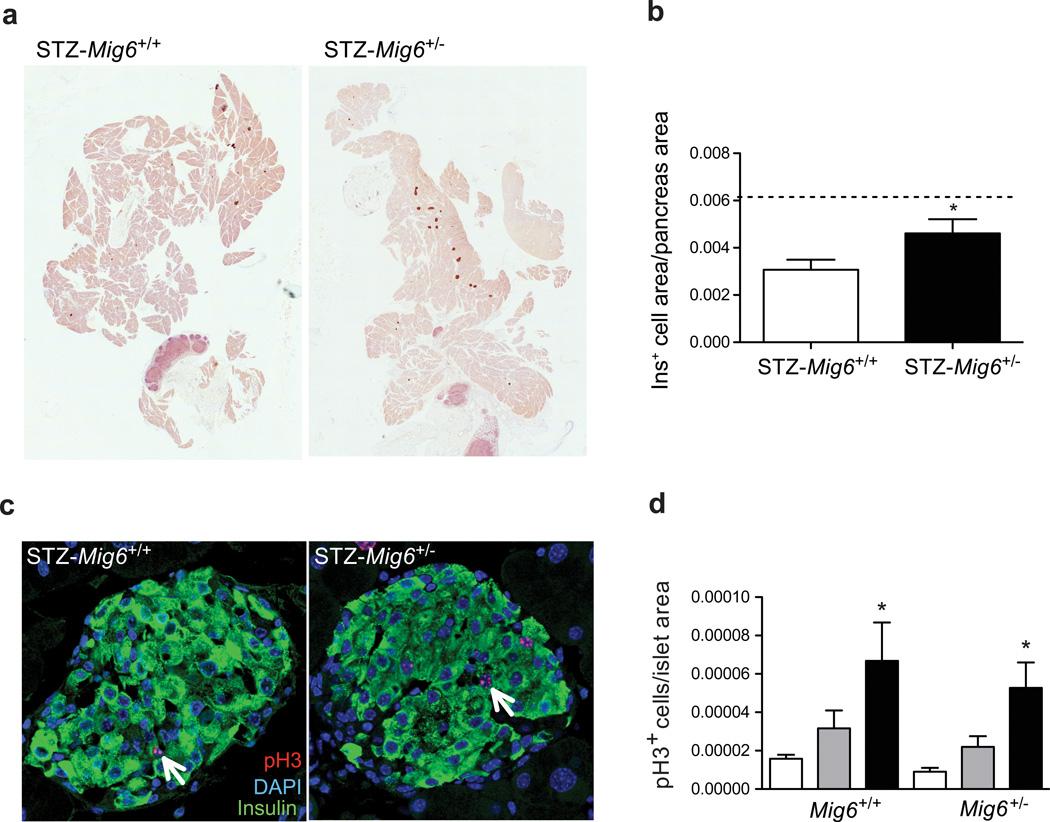
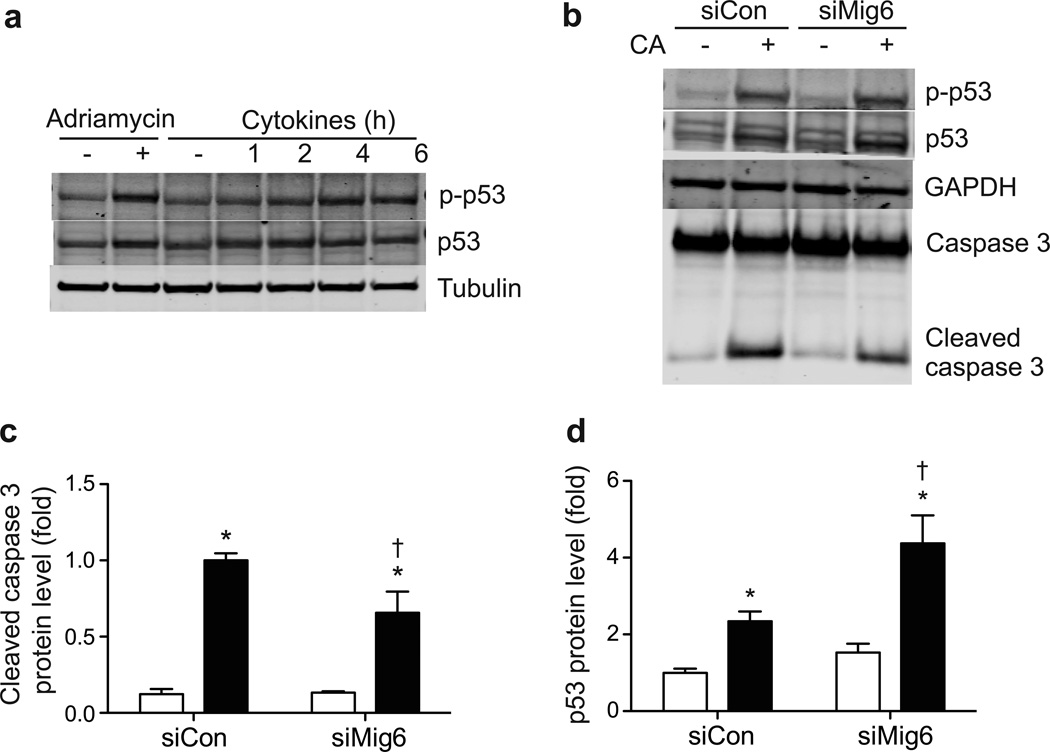
Results: Whereas STZ-treated Mig6 (+/+) mice became diabetic, STZ-treated Mig6 (+/-) mice remained glucose tolerant. In addition, STZ-treated Mig6 (+/-) mice exhibited preserved circulating insulin levels following a glucose challenge. As insulin sensitivity was similar between Mig6 (+/-) and Mig6 (+/+) mice, the preserved glucose tolerance in STZ-treated Mig6 (+/-) mice probably results from preserved beta cell function. This is supported by elevated Pdx1 and Irs2 mRNA levels in islets isolated from STZ-treated Mig6 (+/-) mice. Conversely, MIG6 overexpression in isolated islets compromises glucose-stimulated insulin secretion. Studies in 832/13 cells suggested that cytokine-induced MIG6 hinders EGFR activation and inhibits DNA damage repair. STZ-treated Mig6 (+/-) mice also have increased beta cell mass recovery.

Conclusions/interpretation: Reducing Mig6 expression promotes beta cell repair and abates the development of experimental diabetes, suggesting that MIG6 may be a novel therapeutic target for preserving beta cells.


Figures

Fig. 1
Fig. 1
Proinflammatory cytokines induce MIG6 expression. (a) Human islets or (b) 832/13 cells were treated with cytokines, and MIG6/Mig6 expression was determined. n=4; *p<0.05. (c) INS2 mRNA levels from four human islet donors (± cytokines) were plotted against MIG6 mRNA levels (r2=0.40, p<0.05)
Fig. 2
Fig. 2
MIG6 suppression rescues cytokine inhibition of EGFR. 832/13 cells were pretreated with cytokines for 16 h and then stimulated with EGF to determine phospho (p)-EGFR, EGFR and tubulin levels: (a) a representative image and (b) quantified results (white bars, no EGF; black bars, EGF treated). n=3, *p<0.05 vs untreated, †p<0.05 vs noncytokine EGF stimulated. The solid line indicates cropped lanes within the same experiment. (c–f) 832/13 cells were transduced with adenoviral vectors carrying either a scrambled control RNA (siCon) or shRNA sequence against Mig6 (siMig6). (c) MIG6 knockdown efficiency was determined. n=3, *p<0.05 vs siCon. Following transduction, cells were treated with cytokines for 8 h and then EGF, and p- EGFR, EGFR, p-ERK, ERK and tubulin levels were determined: (d) a representative image and (e–f) quantified results. n=3; *p<0.05 vs untreated, p<0.05 vs siCon EGF stimulated
Fig. 3
Fig. 3
Schematic representation of the experimental timeline
Fig. 4
Fig. 4
Mig6+/− mice are protected from STZ-induced glucose intolerance. GTT was performed 3 days post-STZ injection. (a) Time course and (b) incremental AUC are shown. Dotted lines indicate values for saline-injected Mig6+/+controls. n=5; *p<0.05 vs STZ-Mig6+/+
Fig. 5
Fig. 5
STZ-Mig6+/− mice have preserved beta cell function. (a, b) Circulating insulin levels during a glucose challenge (a) Time course and (b) AUC are shown. n=8, *p<0.05 vs STZ-Mig6+/+. (c, d) Blood glucose levels during ITT pre- and post-STZ treatment. (e–g) Pdx1, IRS2, and Ins2 mRNA levels in islets isolated from saline-injected Mig6+/+, STZ-Mig6+/− and STZ-treated Mig6+/+ mice. Dotted lines indicate values for saline-injected Mig6+/+ controls. n>5; *p<0.05 vs STZ-Mig6+/+
Fig. 6
Fig. 6
MIG6 overexpression compromises beta cell integrity and islet function. (a–c) Isolated rat islets (n=3) were transduced with (a, b) CMV-GFP or CMV-MIG6 adenoviral vectors (*p<0.05 vs CMV-GFP) and (c) GSIS was assessed (white bars, low glucose; black bars, high glucose; *p<0.05 vs low glucose; p<0.05 vs high glucose-stimulated CMV-GFP). (d–f) 832/13 cells were either transduced or not with CMV-GFP or CMV-MIG6 adenoviral vectors. Pdx1, IRS2 and Ins1/2 mRNA levels were determined. n=5, *p<0.05 vs untransduced or CMV-GFP
Fig. 7
Fig. 7
MIG6 does not modulate the cytokine- or STZ-induced immune response. (a, b) Insulitis scoring (defined in Methods) of STZ-Mig6+/− and STZ-Mig6+/+ mouse pancreases. (a) Representative images of islets and (b) quantified results (white, 0; light grey, 1; dark grey, 2; black, 3). Scale bar, 100 µm. (c) Islets from Mig6+/+ (white bars) and Mig6+/− (black bars) were treated with cytokines and NO levels in islet culture medium was measured. n=3, *p<0.05 vs untreated
Fig. 8
Fig. 8
STZ-Mig6+/− mice show enhanced beta cell mass recovery. (a, b) Beta cell area was measured and expressed relative to pancreas area. Dotted line indicates the beta cell area of non-STZ-treated mice. n=8, *p<0.05 vs STZ-Mig6+/+. (c, d) The percentage of pH3-positive (pH3+) beta cells in saline controls (white bars) and at 3 and 20 days post-STZ (grey and black bars, respectively). Arrows indicate proliferating beta cells. n>5, *p<0.05 vs non-STZ. (a, c) Representative images of beta cell mass at 20 days
Fig. 9
Fig. 9
MIG6 promotes DNA damage-induced beta cell death. (a) 832/13 cells were treated with doxorubicin for 6 h or with cytokines for the indicated times. Phospho (p)-p53, p53 and tubulin protein levels were determined. (b–d) 832/13 cells were transduced with siCon or siMig6 adenoviral vectors, and treated with vehicle (white bars) or CA (black bars). p-p53, p53, caspase- 3 and GAPDH protein levels were determined. n=3, *p<0.05 vs untreated, p<0.05 vs siCon+CA

References

    1. von Herrath M, Sanda S, Herold K. Type 1 diabetes as a relapsing-remitting disease? Nat Rev Immunol. 2007;7:988–994. - PubMed
    1. Skyler JS. The year in immune intervention for type 1 diabetes. Diabetes Technol Ther. 2013;15(Suppl 1):S88–S95. - PubMed
    1. Akirav E, Kushner JA, Herold KC. Beta-cell mass and type 1 diabetes: going, going, gone? Diabetes. 2008;57:2883–2888. - PMC - PubMed
    1. Eizirik DL, Sandler S, Palmer JP. Repair of pancreatic beta-cells. A relevant phenomenon in early IDDM? Diabetes. 1993;42:1383–1391. - PubMed
    1. Group TDCaCTR. Effect of intensive therapy on residual beta-cell function in patients with type 1 diabetes in the diabetes control and complications trial. A randomized, controlled trial. Ann Intern Med. 1998;128:517–523. - PubMed

Publication types

MeSH terms

Substances

LinkOut - more resources