Review
. 2014 Sep;87(1041):20140134.
doi: 10.1259/bjr.20140134. Epub 2014 Jul 3.

The use of theranostic gadolinium-based nanoprobes to improve radiotherapy efficacy

Affiliations
Review

The use of theranostic gadolinium-based nanoprobes to improve radiotherapy efficacy

L Sancey et al. Br J Radiol. 2014 Sep.

Abstract

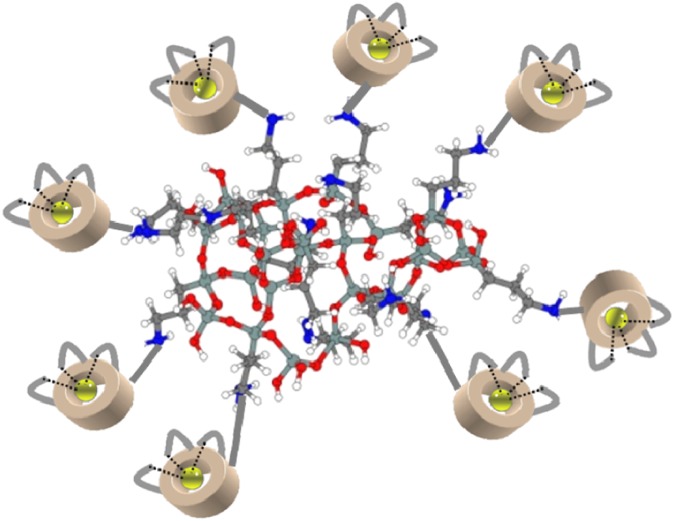
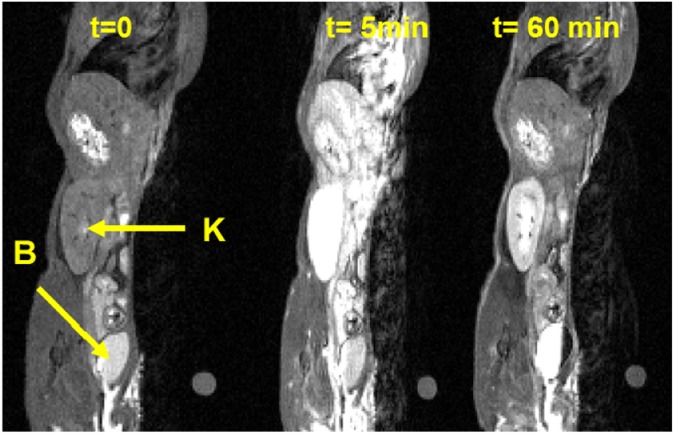
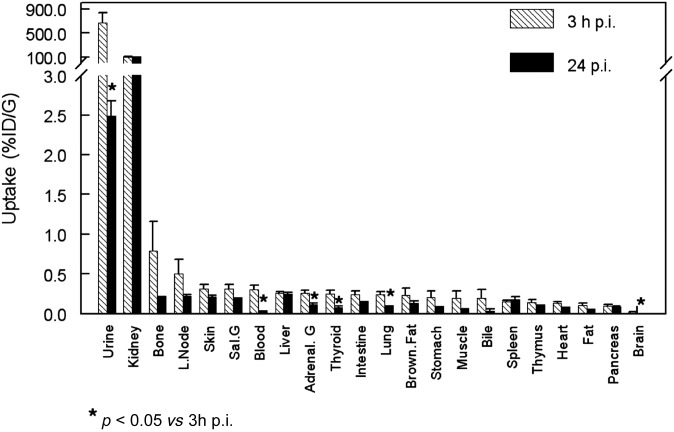
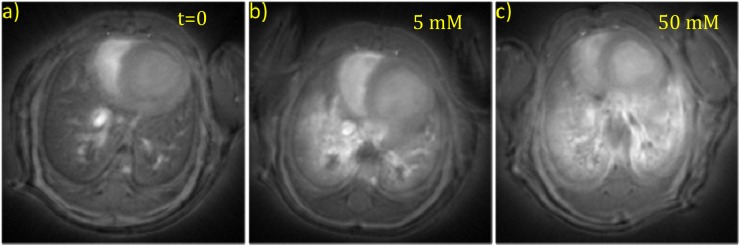
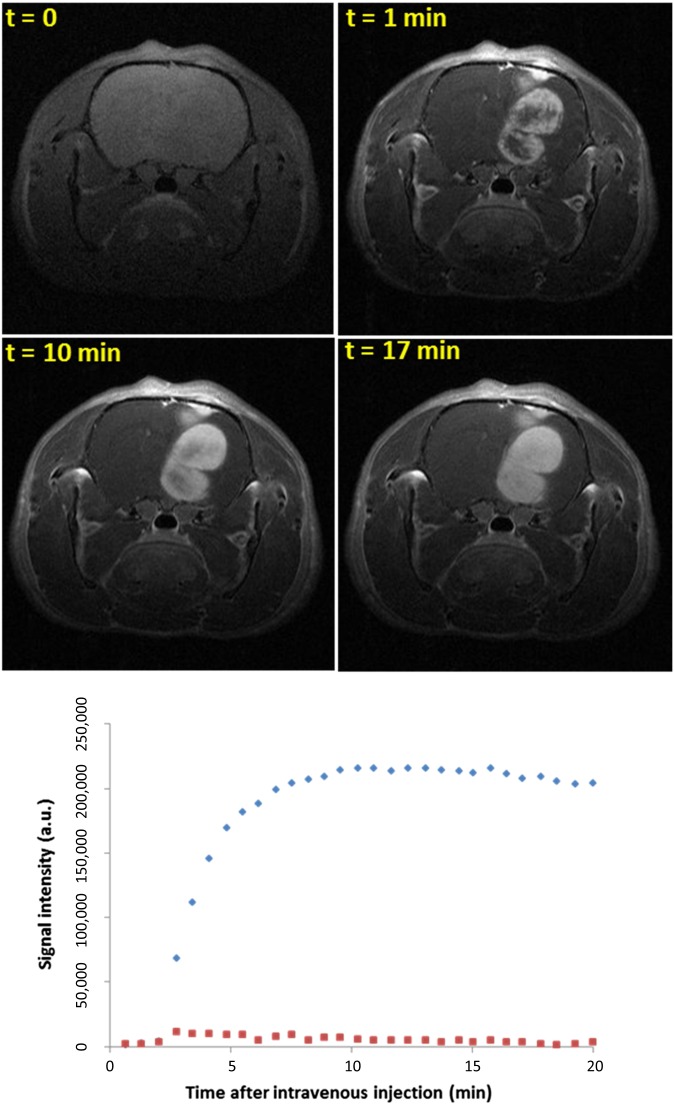
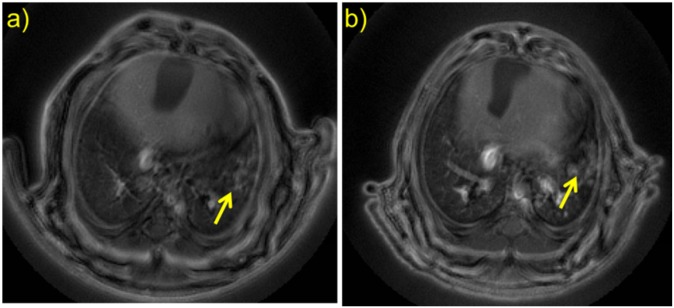
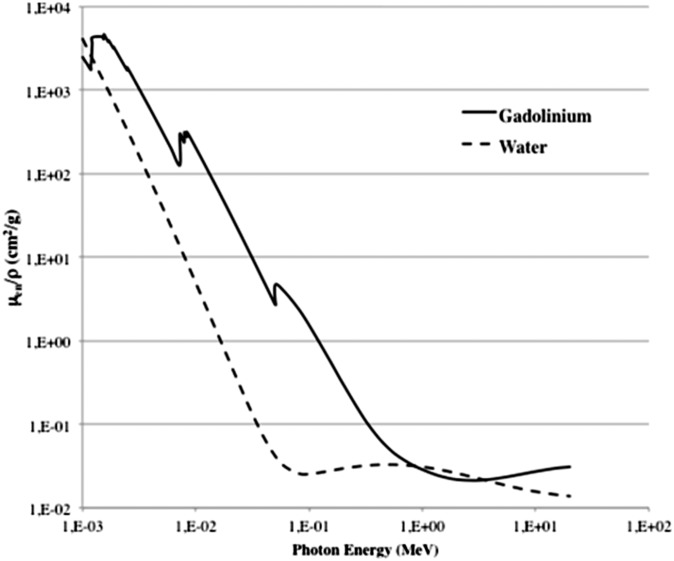
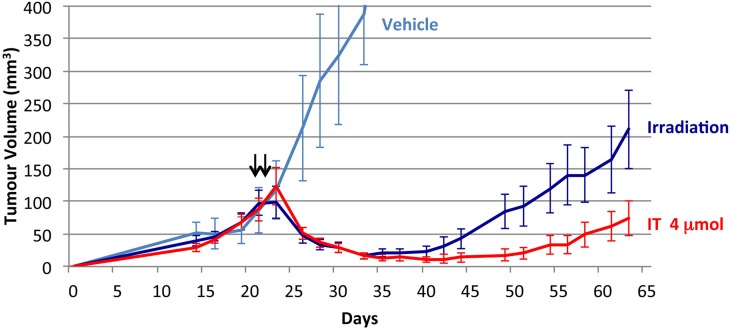
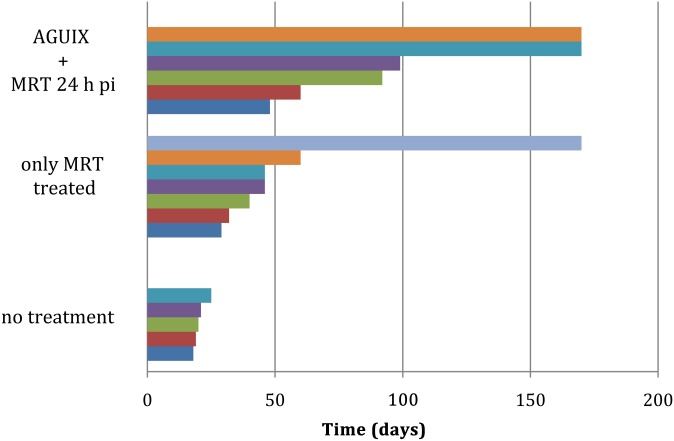
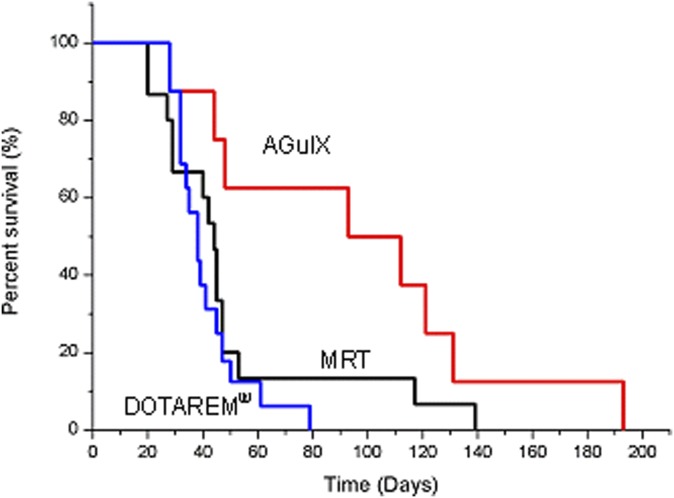
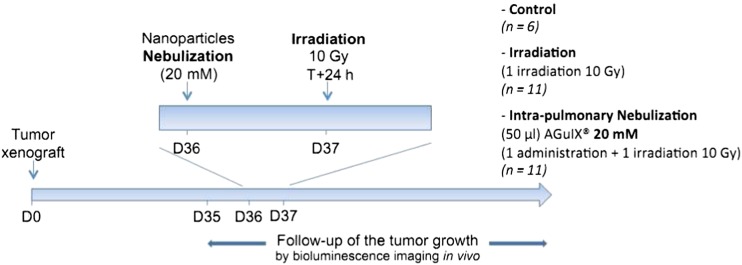
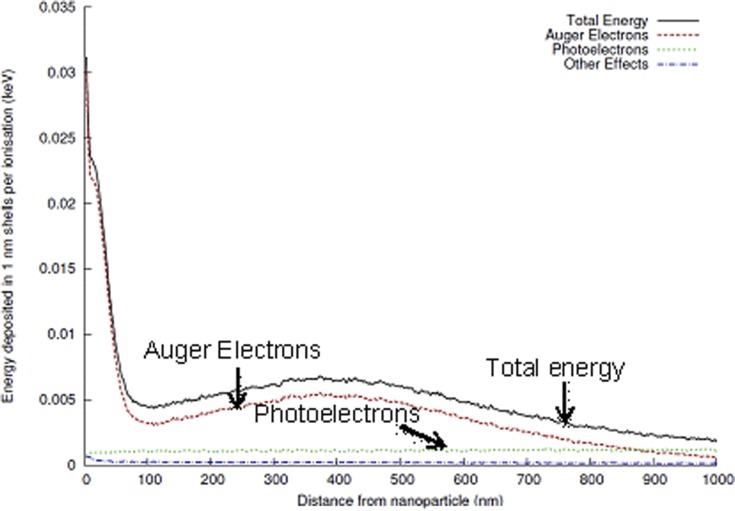
A new efficient type of gadolinium-based theranostic agent (AGuIX®) has recently been developed for MRI-guided radiotherapy (RT). These new particles consist of a polysiloxane network surrounded by a number of gadolinium chelates, usually 10. Owing to their small size (<5 nm), AGuIX typically exhibit biodistributions that are almost ideal for diagnostic and therapeutic purposes. For example, although a significant proportion of these particles accumulate in tumours, the remainder is rapidly eliminated by the renal route. In addition, in the absence of irradiation, the nanoparticles are well tolerated even at very high dose (10 times more than the dose used for mouse treatment). AGuIX particles have been proven to act as efficient radiosensitizers in a large variety of experimental in vitro scenarios, including different radioresistant cell lines, irradiation energies and radiation sources (sensitizing enhancement ratio ranging from 1.1 to 2.5). Pre-clinical studies have also demonstrated the impact of these particles on different heterotopic and orthotopic tumours, with both intratumoural or intravenous injection routes. A significant therapeutical effect has been observed in all contexts. Furthermore, MRI monitoring was proven to efficiently aid in determining a RT protocol and assessing tumour evolution following treatment. The usual theoretical models, based on energy attenuation and macroscopic dose enhancement, cannot account for all the results that have been obtained. Only theoretical models, which take into account the Auger electron cascades that occur between the different atoms constituting the particle and the related high radical concentrations in the vicinity of the particle, provide an explanation for the complex cell damage and death observed.


Figures

Figure 1.
Figure 1.
Representation of the AGuIX® nanoparticle. Gadolinium atoms are chelated by 1,4,7,10-tetraazacyclododecane-1,4,7,10-tetraacetic acid derivatives. The polysiloxane matrix is composed mainly of silicon and oxygen. The nanoparticles display a high gadolinium content (15 wt%), sub-5-nm size, approximate mass of 10 kDa, and the following chemical formula Gd10Si40C200N50O150Hx.
Figure 2.
Figure 2.
T1 weighted image of a slice, including a kidney (K) and bladder (B) of a mouse before (t = 0), 5 min after and 60 min after intravenous injection of AGuIX® nanoparticles.
Figure 3.
Figure 3.
111In-labelled AGuIX® biodistribution at 3 and 24 h following intravenous injection in C57Bl6/J mice. G, gland; L, left; ID, injected dose; p.i., post injection; sal, salivary.
Figure 4.
Figure 4.
Axial slices of the mouse lungs (a) prior to contrast agent administration (t = 0), (b) following administration of 5 mM and (c) 50 mM (of Gd3+) of AGuIX® nanoparticles.
Figure 5.
Figure 5.
T1 weighted images of the brain of a 9L gliosacrcoma-bearing rat before and 1, 10 and 17 min after AGuIX® injection. Temporal evolution of the MRI signal in the tumour (diamonds) and in an equivalent surface in tumour tissue in the left hemisphere (squares). a.u., arbitrary unit.
Figure 6.
Figure 6.
Ultrashort echo time MR images at (a) 35 days and (b) 38 days following tumour implantation (pinpointed by the arrows) and intratracheal administration of 50 µl at 50 mM of AGuIX® nanoparticles. Tumour presence was confirmed by bioluminescence imaging and histology. Adapted with permission from Bianchi et al.
Figure 7.
Figure 7.
Comparison of photon mass energy absorption coefficients for gadolinium and soft tissues. Adapted from Hubbell and Seltzer.
Figure 8.
Figure 8.
Relative tumour evolution after intratumoral (IT) AGuIX® injection. Tumour evolution without irradiation with only injection of solution without particles (vehicle), 2 × 10 Gy irradiation alone with a delay of 24 h (irradiation) or AGuIX injection (IT 4 μmol, 2 × 4 μmol) followed by 2 × 10 Gy irradiation. Each value represents the mean ± standard error of the mean of tumour volume in mm3 (n = 8 per group).
Figure 9.
Figure 9.
Survival of 9L tumour-bearing rats following tumour cell implantation after no treatment (five individual rats), only irradiated by microbeam radiation therapy (MRT) and irradiated by MRT 24 h after the intravenous nanoparticle injection. p.i., post injection.
Figure 10.
Figure 10.
Survival curves of 9L tumour-bearing rats treated only by microbeam radiation therapy (MRT) (MRT, n = 15 rats); by MRT 20 min after injection of DOTAREM® (Guerbet, Aulnay-sous-Bois, France) (DOTAREM, n = 16 rats; p = 0.42 vs MRT); and by MRT 20 min after intravenous injection of AGuIX® nanoparticles (AGuIX, n = 8 rats; p = 0.013 vs MRT + DOTAREM and p = 0.062 vs MRT). Irradiation was performed 10 days after tumour implantation. MRT irradiation was conducted in cross-firing mode, applying 50-μm-wide microbeams with 200-μm spacing. The skin entrance dose was set at 400 Gy for the peak and 20 Gy for the valley. Statistical analysis was performed using log-rank test.
Figure 11.
Figure 11.
Radiotherapy protocol for orthotopic lung tumour-bearing mice. D, day.
Figure 12.
Figure 12.
Illustration of nanoscale effects around irradiated AGuIX® gadolinium nanoparticles. The average energy deposited around an AGuIX nanoparticle following an ionizing event by an 80-keV X-ray was calculated using Geant4 (CERN, Meyrin, Switzerland) as a function of distance from the nanoparticle. The primary sources of this energy deposition were Auger electrons (dashed line) and photoelectrons (dotted line), with only a small contribution from other processes (dot-dash line). Owing to the low energy of Auger electrons, they deposit their energy in a highly localized region around the nanoparticle, leading to highly localized doses.
Figure 13.
Figure 13.
Schematic representation of guided and enhanced radiotherapy with theranostic AGuIX® nanoparticles (Courtesy of T Brichart).

References

    1. Kwatra D, Venugopal A, Anant S. Nanoparticles in radiation therapy: a summary of various approaches to enhance radiosensitization in cancer. Transl Cancer Res 2013; 2: 330–42.
    1. McMahon SJ, Mendenhall MH, Jain S, Currell F. Radiotherapy in the presence of contrast agents: a general figure of merit and its application to gold nanoparticles. Phys Med Biol 2008; 53: 5635–51. doi: 10.1088/0031-9155/53/20/005 - DOI - PubMed
    1. Butterworth KT, Wyer JA, Brennan-Fournet M, Latimer CJ, Shah MB, Currell FJ, et al. . Variation of strand break yield for plasmid DNA irradiated with high-Z metal nanoparticles. Radiat Res 2008; 170: 381–7. doi: 10.1667/RR1320.1 - DOI - PubMed
    1. Hainfeld JF, Slatkin DN, Smilowitz HM. The use of gold nanoparticles to enhance radiotherapy in mice. Phys Med Biol 2004; 49: N309–15. - PubMed
    1. Butterworth KT, McMahon SJ, Taggart LE, Prise KM. Radiosensitization by gold nanoparticles: effective at megavoltage energies and potential role of oxidative stress. Transl Cancer Res 2013; 2: 279–89.

Publication types