. 2014 Dec;21(6):569-83.
doi: 10.1093/dnares/dsu022. Epub 2014 Jul 2.

Identification of TNF-α-responsive promoters and enhancers in the intestinal epithelial cell model Caco-2

Affiliations

Identification of TNF-α-responsive promoters and enhancers in the intestinal epithelial cell model Caco-2

Mette Boyd et al. DNA Res. 2014 Dec.

Abstract

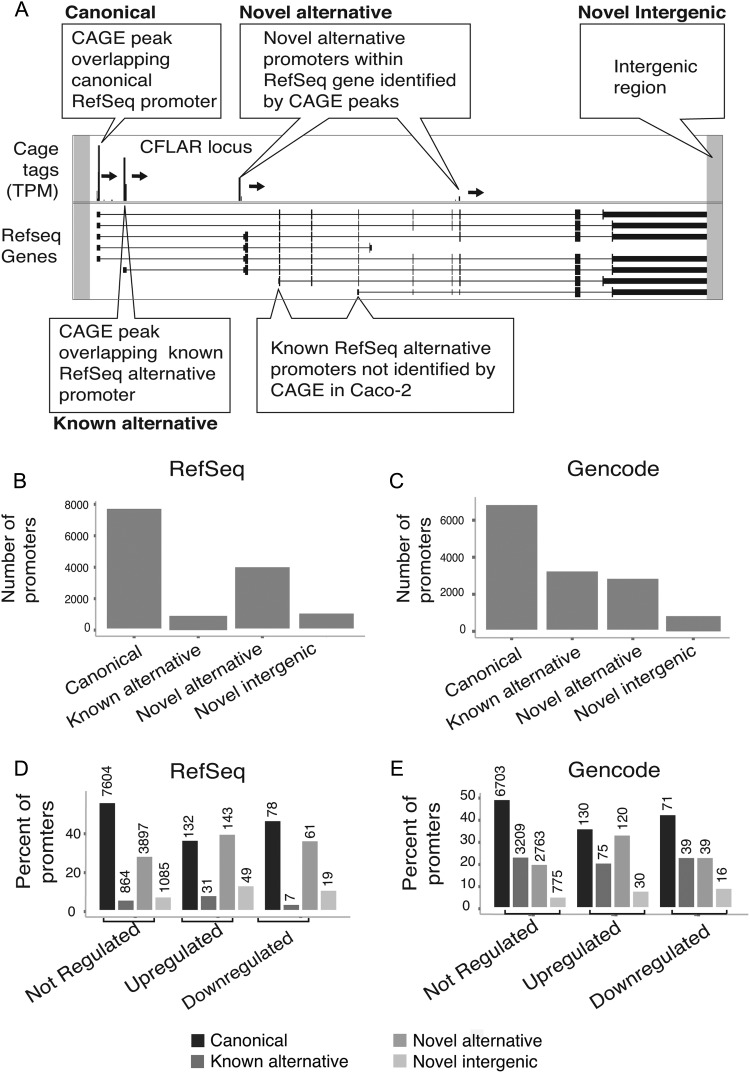
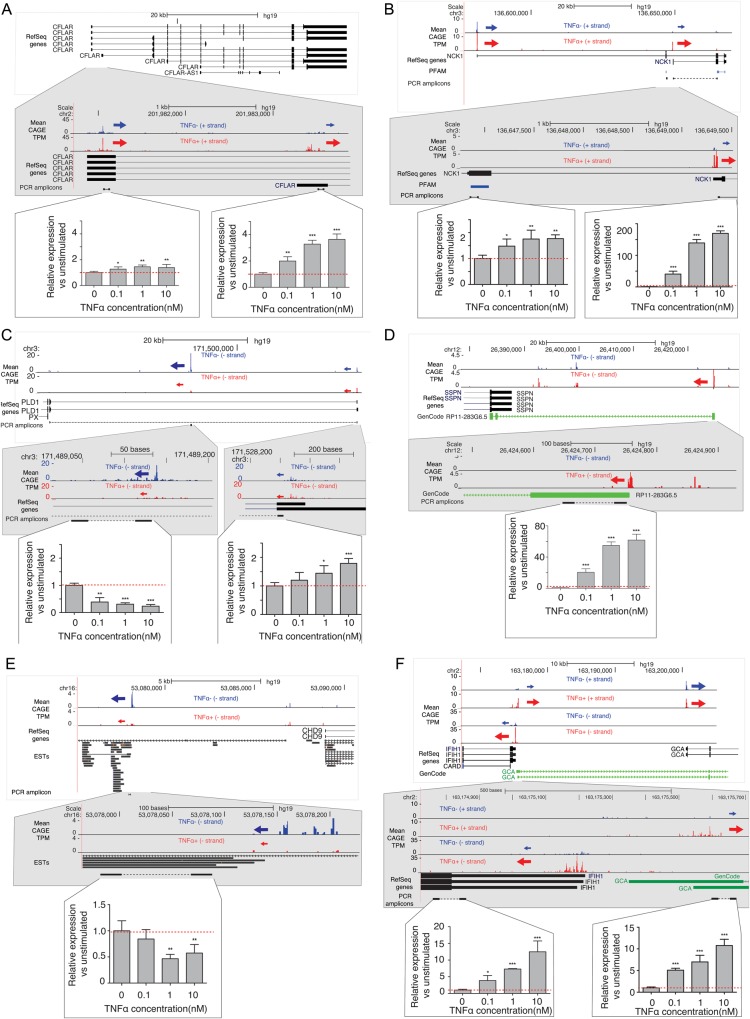
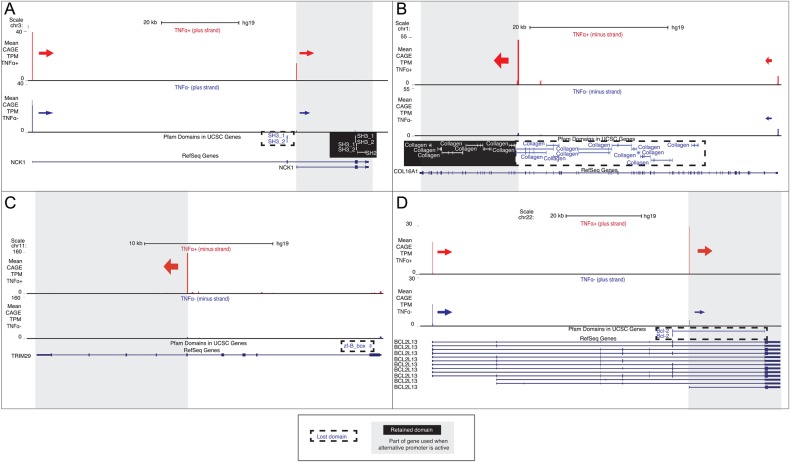
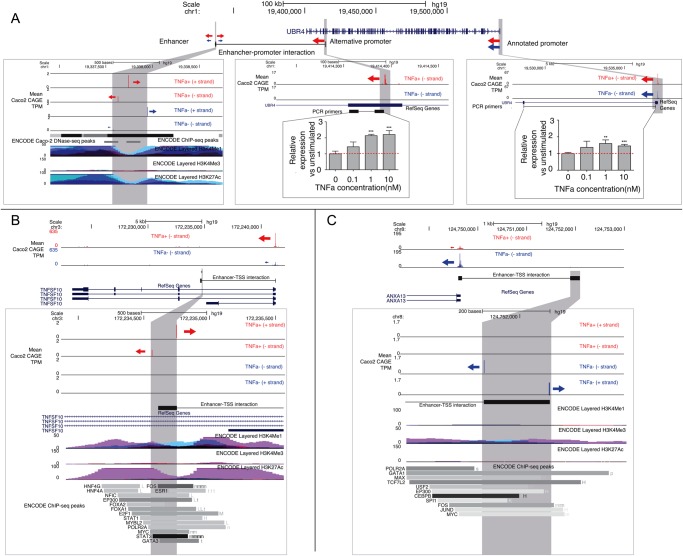
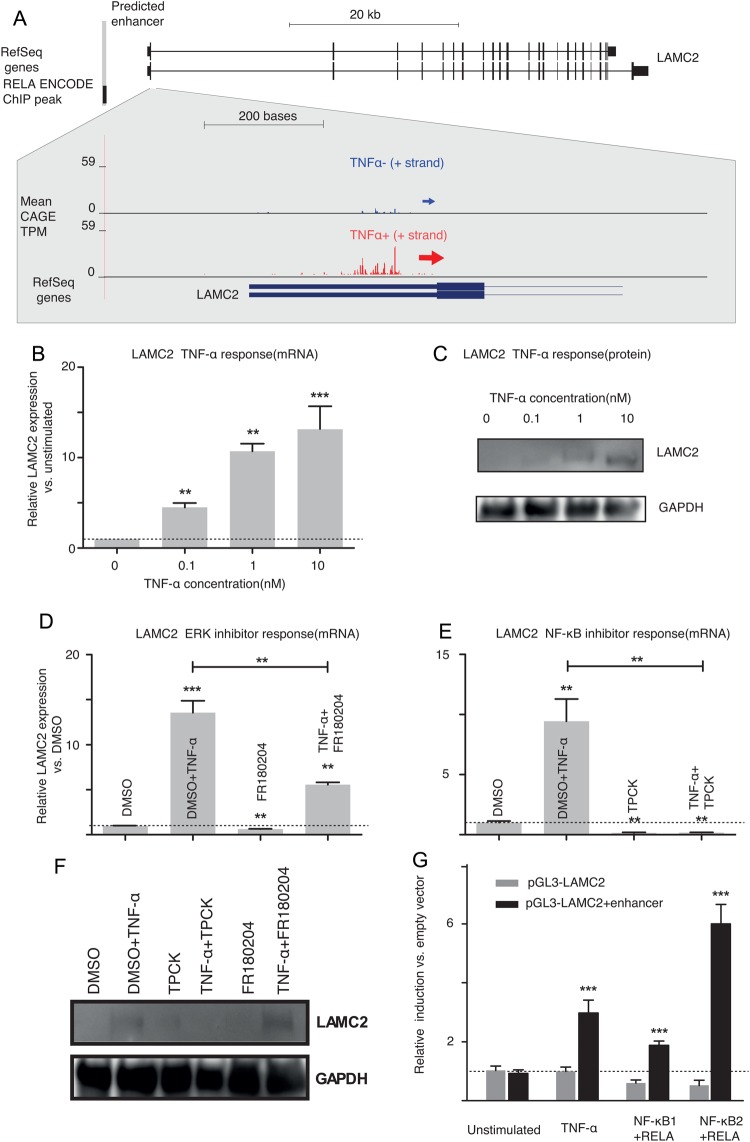
The Caco-2 cell line is one of the most important in vitro models for enterocytes, and is used to study drug absorption and disease, including inflammatory bowel disease and cancer. In order to use the model optimally, it is necessary to map its functional entities. In this study, we have generated genome-wide maps of active transcription start sites (TSSs), and active enhancers in Caco-2 cells with or without tumour necrosis factor (TNF)-α stimulation to mimic an inflammatory state. We found 520 promoters that significantly changed their usage level upon TNF-α stimulation; of these, 52% are not annotated. A subset of these has the potential to confer change in protein function due to protein domain exclusion. Moreover, we locate 890 transcribed enhancer candidates, where ∼50% are changing in usage after TNF-α stimulation. These enhancers share motif enrichments with similarly responding gene promoters. As a case example, we characterize an enhancer regulating the laminin-5 γ2-chain (LAMC2) gene by nuclear factor (NF)-κB binding. This report is the first to present comprehensive TSS and enhancer maps over Caco-2 cells, and highlights many novel inflammation-specific promoters and enhancers.

Keywords: alternative promoters; inflammation; non-coding RNAs; transcribed enhancers; transcriptional regulation.


Figures

Figure 1.
Figure 1.
CAGE-defined promoters in Caco-2 cells. (A) Schematic illustration showing classification of CAGE-defined promoters based on RefSeq annotation. The upper panel shows the number of CAGE tag clusters (TCs) mapping around an example gene loci (the CFLAR gene) on the plus strand. The lower panel shows the RefSeq gene model exon–intron structure of the gene (blocks are exons, lines are introns). CAGE peaks are commented as belonging to specific classes based on their location. CAGE tags falling outside of gene loci will be classified as ‘novel intergenic’ (grey areas). Box labels indicate names used for respective classes in (B) and (C). RefSeq-annotated alternative promoters that are not hit by CAGE are also indicated. (B) Distribution of Caco-2 TCs (TPM > 4) according to the TC classes defined above using RefSeq annotation. (C) Distribution of Caco-2 TCs (TPM > 4) according to the TC classes defined above using Gencode annotation. (D and E) Per cent of TCs falling into each of the classes from (B) and (C) split up by TNF-α response, using RefSeq (D) or Gencode annotation (E). Bars shaded from black to light grey represent canonical, known alternative, novel intragenic and novel intergenic TCs, respectively. Numbers above bars indicate the number of promoters in respective category.
Figure 2.
Figure 2.
Examples of CAGE-inferred promoters and their response to TNF-α stimulation. Each panel describes a validated gene locus: (A) CFLAR, (B) NCK1, (C) PLD1, (D) the RP11-283G6.5 lncRNA, (E) novel putative lncRNA, (F) IFIH1 and a putative long distal promoter of GCA. Each panel consists of three sub-panels: top, an UCSC browser overview of the gene landscape around the promoter(s) of interest; middle, a zoom-in version of the above; bottom, qPCR validations of respective RNA isoforms emanating from the promoters of interests as a function of TNF-α concentration. UCSC browser sub-panels show (when relevant and available) RefSeq genes, expressed sequenced tags (ESTs), GenCode annotation and mean normalized CAGE signal per nucleotide on relevant strand over three replicates. Arrows indicate TSS clusters (core promoters) of interest and their direction of transcription. Sizes of arrows correspond to the CAGE signal strength. Locations of qPCR primer pairs are shown also in Supplementary Table S1. Respective examples are commented in detail in the main text. For qPCR bar plots, the vertical axis shows the mean fold change vs. un-stimulated cells (four replicates), error bars indicate standard error of mean. The dotted line indicates a fold change of 1. The statistical significance (t-test) is indicated above the bars: *P < 0.05, **P < 0.01, ***P < 0.001. This figure appears in colour in the online version of DNA Research.
Figure 3.
Figure 3.
Examples of loss of exons coding for protein domains due to alternative promoter usage. UCSC browser overview of the genes of interest: (A) NCK1, (B) COL16A1, (C) TRIM29, (D) BCL2L13 similar to Fig. 2. From top; (i) bar graph of normalized CAGE tag counts (TPM) from TNF-α(+) and TNF-α(−). Only tags on the relevant strand are shown; (ii) Pfam domains mapped to UCSC genes and (iii) RefSeq genes. Arrows indicate TSS clusters (core promoters) of interest and their direction of transcription. Sizes of arrows correspond to the CAGE signal strength. Grey regions indicate the part of the gene that is retained by usage of alternative promoters of interest. Lost, or partially lost, domains upstream of this region with dashed lines, while retained domains have a black background. Gene examples are commented in detail in the main text. This figure appears in colour in the online version of DNA Research.
Figure 4.
Figure 4.
Examples of CAGE-inferred TNF-α responsive enhancers and their potential targets. Each panel consists of sub-panels: top, an UCSC browser overview of the gene landscape around the enhancer and promoter of interest; bottom, zoom-in version(s) of the above. (A) An enhancer is predicted downstream of the UBR4 gene identified by bidirectional CAGE tag pairs (left panel shows a zoom-in). It has support from multiple data types from the ENCODE project, including ChIP-seq for transcription factors, and histone marks typical of enhancers, as well as Caco-2-specific DNase sensitivity site peaks. CAGE data are shown as in Fig. 2. The enhancer is induced by TNF-α, and is predicted to interact with a CAGE-defined alternative promoter within the gene (middle panel), which is also induced by TNF-α (verified by qPCR as in Fig. 2). Conversely, the annotated promoter is not responding highly to TNF-α (right panel). (B) A TNF-α-induced enhancer is predicted within the first intron of the TNFSF10 gene, and predicted to interact with the annotated TSS, which also is highly TNF-α-induced. The enhancer has support by ENCODE histone marks and multiple transcription factor ChIP peaks. (C) An enhancer, which is only used in non-induced cells, is predicted 2 kb upstream of the annotated TSS of the ANXA13 gene, which also has much higher expression in the non-induced state. The enhancer has support by multiple ENCODE transcription factor ChIP peaks. See main text for further discussion. This figure appears in colour in the online version of DNA Research.
Figure 5.
Figure 5.
TNF-α regulates LAMC2 transcriptional activity by an NF-κB-bound enhancer. (A) An overview of the LAMC2 gene and its predicted enhancer location upstream of the LAMC2 TSS. The RELA ChIP peak overlapping the predicted enhancer is taken from the ENCODE UCSC ChIP track. Genome browser zoom-in shows CAGE data around the annotated TSS as shown in Fig. 2. (B) Dose-dependent increase of LAMC2 mRNA expression in cells treated with increasing concentrations of TNF-α (0, 0.1, 1 or 10 nM). (C) Western blot analysis of LAMC2 protein levels in TNF-α-treated cells and GAPDH used as an internal loading control. The shown blot represents three independent experiments. The effect of (D) FR180204, an ERK inhibitor, and (E) TPCK, an NF-κB inhibitor, on the TNF-α-mediated up-regulation of LAMC2 mRNA expression and (F) LAMC2 and GAPDH protein levels. Cells were pre-treated with inhibitors or with vehicle DMSO (0.4%) for 1 h and then incubated with TNF-α (10 nM) for 24 h. (G) The effect of TNF-α and overexpression of NF-κB subunits on the LAMC2 promoter activity with and without the enhancer shown in (A). Cells were transiently transfected with the human LAMC2 promoter (pGL3-LAMC2) (grey bars) or LAMC2 promoter/enhancer construct (pGL3-LAMC2 + enhancer) (black bars) and were unstimulated, stimulated with TNF-α for 24 h (black bars), co-transfected with plasmids overexpressing NFKB1(p50) and RELA NF-κB subunits, or co-transfected with plasmids overexpressing NFKB2 and RELA NF-κB subunits. Asterisks indicate levels of significance: *P < 0.05, **P < 0.01, ***P < 0.001 (t-test): error bars indicate the standard error of the mean. This figure appears in colour in the online version of DNA Research.

Similar articles

Cited by

References

    1. Dahan S., Roth-Walter F., Arnaboldi P., Agarwal S., Mayer L. Epithelia: lymphocyte interactions in the gut. Immunol. Rev. 2007;215:243–53. - PMC - PubMed
    1. Koch S., Nusrat A. The life and death of epithelia during inflammation: lessons learned from the gut. Annu. Rev. Pathol. 2012;7:35–60. - PubMed
    1. Ordás I., Mould D.R., Feagan B.G., Sandborn W.J. Anti-TNF monoclonal antibodies in inflammatory bowel disease: pharmacokinetics-based dosing paradigms. Clin. Pharmacol. Ther. 2012;91:635–46. - PubMed
    1. Nielsen O.H., Ainsworth M.A. Tumor necrosis factor inhibitors for inflammatory bowel disease. N. Engl. J. Med. 2013;369:754–62. - PubMed
    1. Hidalgo I.J., Raub T.J., Borchardt R.T. Characterization of the human colon carcinoma cell line (Caco-2) as a model system for intestinal epithelial permeability. Gastroenterology. 1989;96:736–49. - PubMed

Publication types

MeSH terms