

Advances in functional and structural imaging of the human lung using proton MRI
- PMID: 24990096
- PMCID: PMC4515033
- DOI: 10.1002/nbm.3156
Advances in functional and structural imaging of the human lung using proton MRI
Abstract
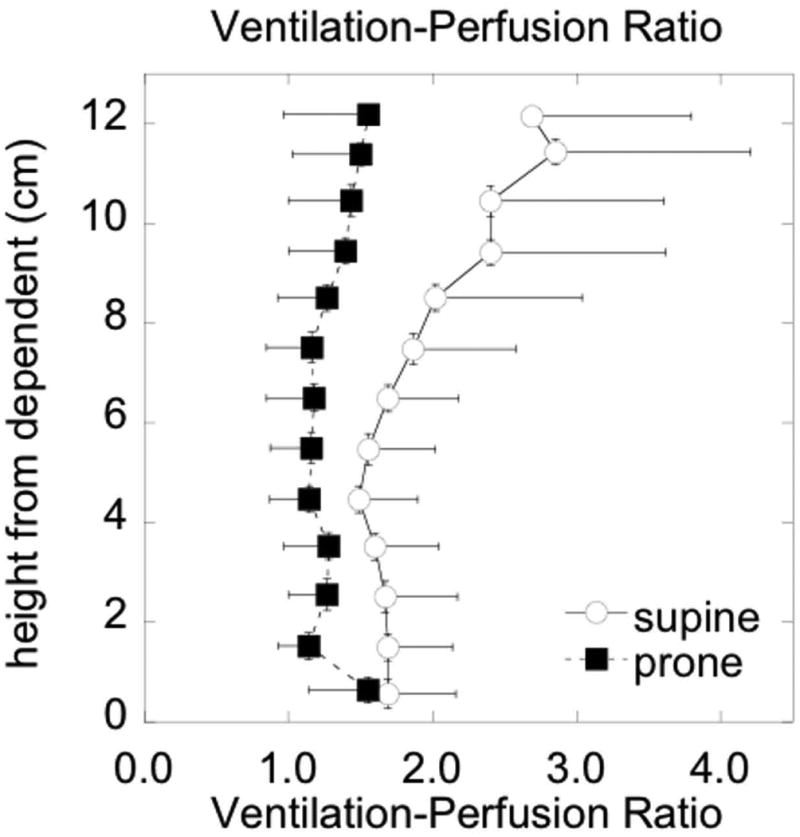
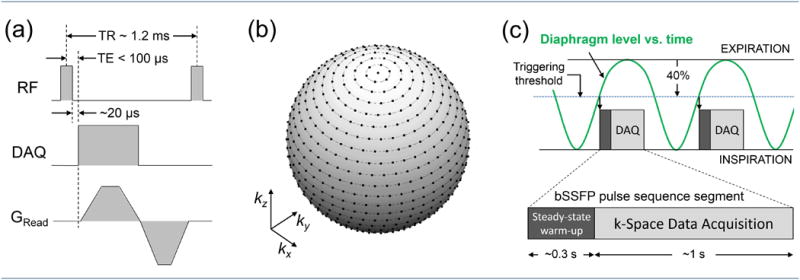
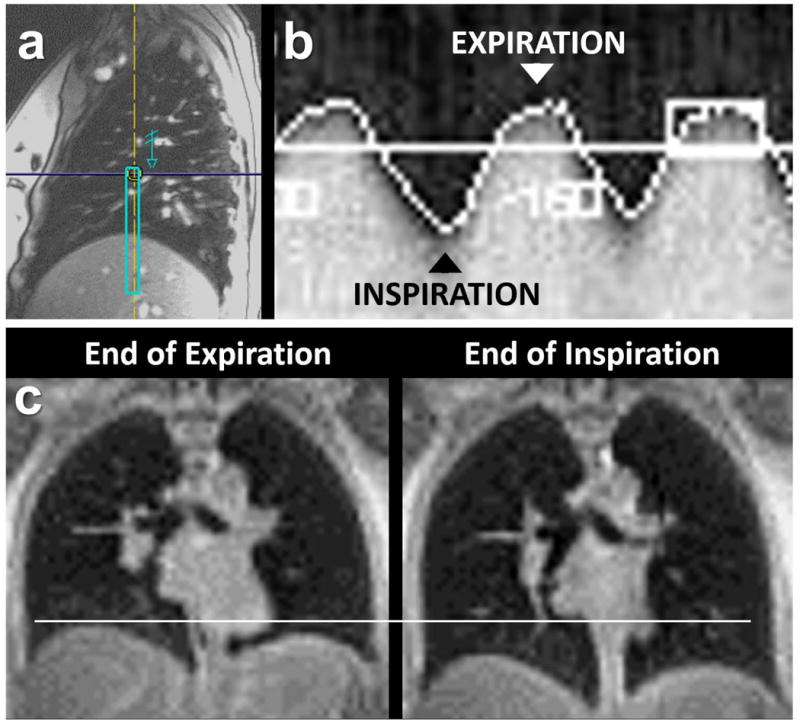
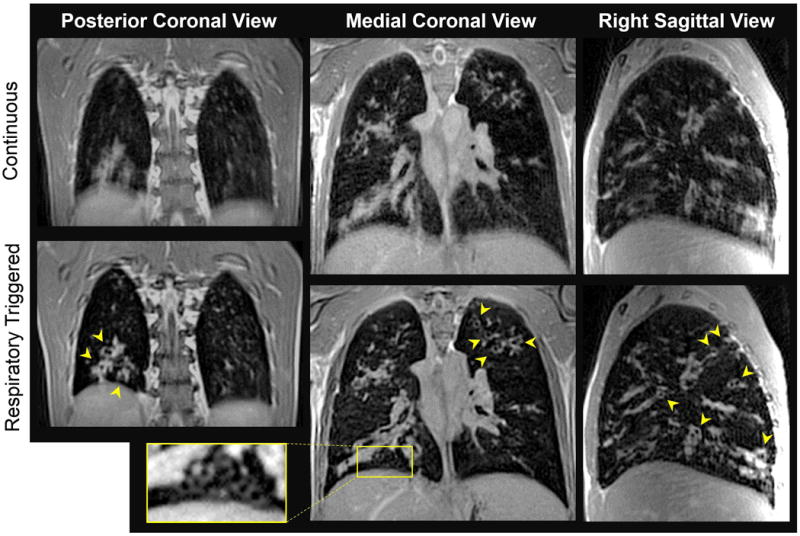
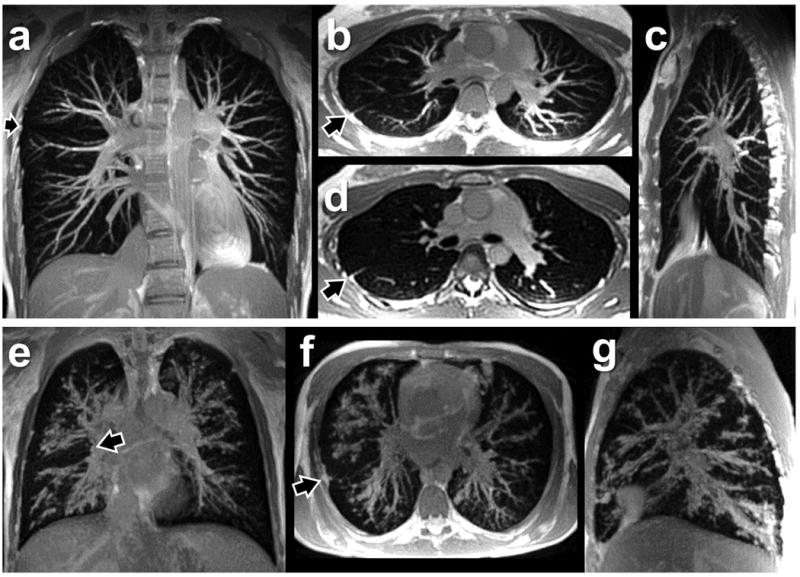
The field of proton lung MRI is advancing on a variety of fronts. In the realm of functional imaging, it is now possible to use arterial spin labeling (ASL) and oxygen-enhanced imaging techniques to quantify regional perfusion and ventilation, respectively, in standard units of measurement. By combining these techniques into a single scan, it is also possible to quantify the local ventilation-perfusion ratio, which is the most important determinant of gas-exchange efficiency in the lung. To demonstrate potential for accurate and meaningful measurements of lung function, this technique was used to study gravitational gradients of ventilation, perfusion, and ventilation-perfusion ratio in healthy subjects, yielding quantitative results consistent with expected regional variations. Such techniques can also be applied in the time domain, providing new tools for studying temporal dynamics of lung function. Temporal ASL measurements showed increased spatial-temporal heterogeneity of pulmonary blood flow in healthy subjects exposed to hypoxia, suggesting sensitivity to active control mechanisms such as hypoxic pulmonary vasoconstriction, and illustrating that to fully examine the factors that govern lung function it is necessary to consider temporal as well as spatial variability. Further development to increase spatial coverage and improve robustness would enhance the clinical applicability of these new functional imaging tools. In the realm of structural imaging, pulse sequence techniques such as ultrashort echo-time radial k-space acquisition, ultrafast steady-state free precession, and imaging-based diaphragm triggering can be combined to overcome the significant challenges associated with proton MRI in the lung, enabling high-quality three-dimensional imaging of the whole lung in a clinically reasonable scan time. Images of healthy and cystic fibrosis subjects using these techniques demonstrate substantial promise for non-contrast pulmonary angiography and detailed depiction of airway disease. Although there is opportunity for further optimization, such approaches to structural lung imaging are ready for clinical testing.
Keywords: arterial spin labeling; functional lung imaging; oxygen-enhanced pulmonary MRI; respiratory triggering; specific ventilation imaging; structural lung imaging; ultrashort echo time; ventilation-perfusion ratio.
Copyright © 2014 John Wiley & Sons, Ltd.
Figures
Similar articles
-
Magnetic resonance imaging quantification of pulmonary perfusion using calibrated arterial spin labeling.J Vis Exp. 2011 May 30;(51):2712. doi: 10.3791/2712. J Vis Exp. 2011. PMID: 21673635 Free PMC article.
-
Measurement of the distribution of ventilation-perfusion ratios in the human lung with proton MRI: comparison with the multiple inert-gas elimination technique.J Appl Physiol (1985). 2017 Jul 1;123(1):136-146. doi: 10.1152/japplphysiol.00804.2016. Epub 2017 Mar 9. J Appl Physiol (1985). 2017. PMID: 28280105 Free PMC article.
-
Assessing the pulmonary vascular responsiveness to oxygen with proton MRI.J Appl Physiol (1985). 2024 Apr 1;136(4):853-863. doi: 10.1152/japplphysiol.00747.2023. Epub 2024 Feb 22. J Appl Physiol (1985). 2024. PMID: 38385182 Free PMC article.
-
Outracing Lung Signal Decay - Potential of Ultrashort Echo Time MRI.Rofo. 2019 May;191(5):415-423. doi: 10.1055/a-0715-2246. Epub 2018 Sep 26. Rofo. 2019. PMID: 30257269 English.
-
Proton MRI of the Lung: How to Tame Scarce Protons and Fast Signal Decay.J Magn Reson Imaging. 2021 May;53(5):1344-1357. doi: 10.1002/jmri.27122. Epub 2020 Mar 12. J Magn Reson Imaging. 2021. PMID: 32166832 Review.
Cited by
-
Establishing a 4D-CT lung function related volumetric dose model to reduce radiation pneumonia.Sci Rep. 2024 Jun 1;14(1):12589. doi: 10.1038/s41598-024-63251-0. Sci Rep. 2024. PMID: 38824238 Free PMC article.
-
Multimodality molecular imaging of the lung.Clin Transl Imaging. 2014 Oct;2(5):391-401. doi: 10.1007/s40336-014-0084-9. Epub 2014 Oct 16. Clin Transl Imaging. 2014. PMID: 28164069 Free PMC article.
-
A review of the role of MRI in diagnosis and treatment of early stage lung cancer.Clin Transl Radiat Oncol. 2020 Jun 6;24:16-22. doi: 10.1016/j.ctro.2020.06.002. eCollection 2020 Sep. Clin Transl Radiat Oncol. 2020. PMID: 32596518 Free PMC article. Review.
-
Quantification of Ventilation and Gas Uptake in Free-Breathing Mice With Hyperpolarized 129Xe MRI.IEEE Trans Med Imaging. 2019 Sep;38(9):2081-2091. doi: 10.1109/TMI.2019.2911293. Epub 2019 Apr 15. IEEE Trans Med Imaging. 2019. PMID: 30990426 Free PMC article.
-
Lung magnetic resonance imaging for pneumonia in children.Pediatr Radiol. 2017 Oct;47(11):1420-1430. doi: 10.1007/s00247-017-3865-2. Epub 2017 Sep 21. Pediatr Radiol. 2017. PMID: 29043418 Review.
References
-
- Bergin CJ, Pauly JM, Macovsk A. Lung parenchyma: projection reconstruction MR imaging. Radiology. 1991;179:777–781. - PubMed
-
- Robson MD, Gatehouse PD, Bydder M, Bydder GM. Magnetic resonance: an introduction to ultrashort TE (UTE) imaging. J Comput Assist Tomogr. 2003;27:825–846. - PubMed
-
- Schmidt MA, Yang GZ, Keegan J, Jhooti P, Gatehouse PD, Carr DH, Hansell DM, Firmin DN. Non-breath-hold lung magnetic resonance imaging with real-time navigation. MAGMA. 1997;5:123–128. - PubMed
Publication types
MeSH terms
Substances
Grants and funding
LinkOut - more resources
Full Text Sources
Other Literature Sources
Medical
