. 2014 Jul;42(13):8777-88.
doi: 10.1093/nar/gku572. Epub 2014 Jul 2.

Structural dynamics of the two-component response regulator RstA in recognition of promoter DNA element

Affiliations

Structural dynamics of the two-component response regulator RstA in recognition of promoter DNA element

Yi-Chuan Li et al. Nucleic Acids Res. 2014 Jul.

Abstract

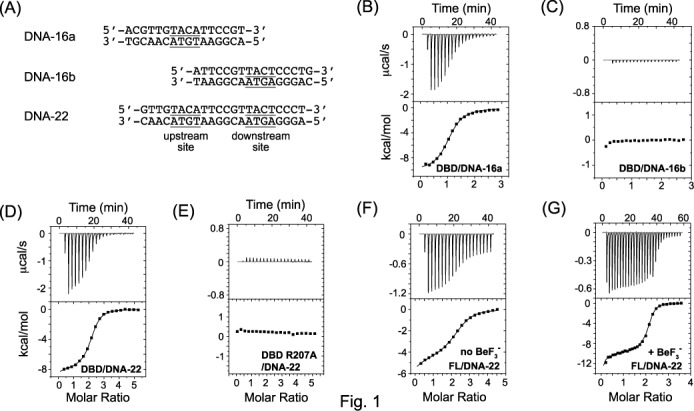
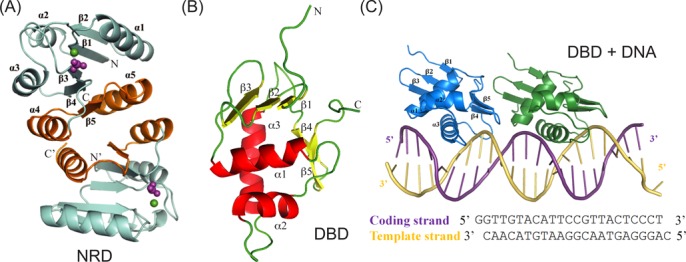
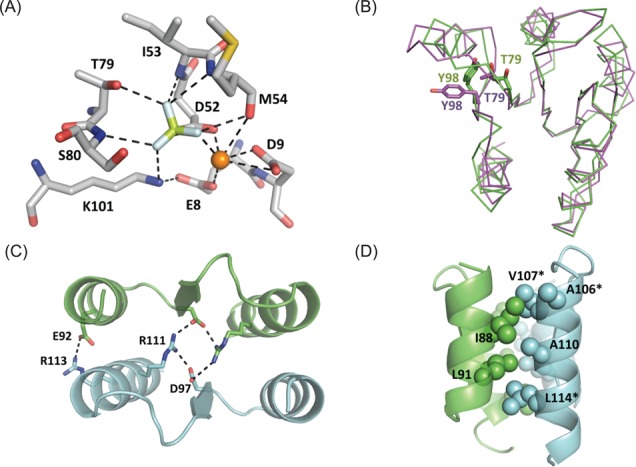
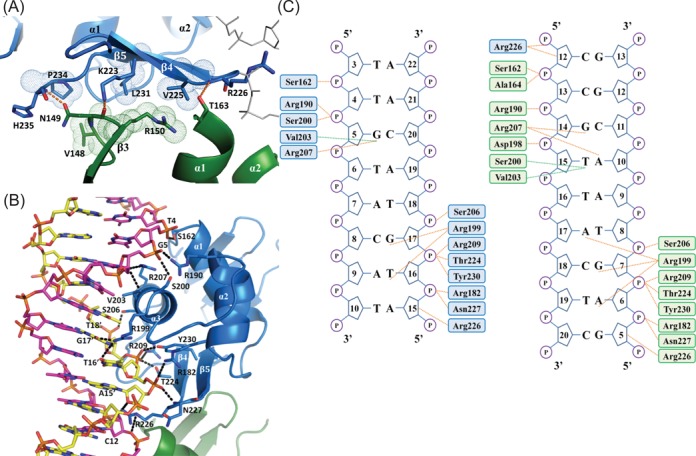
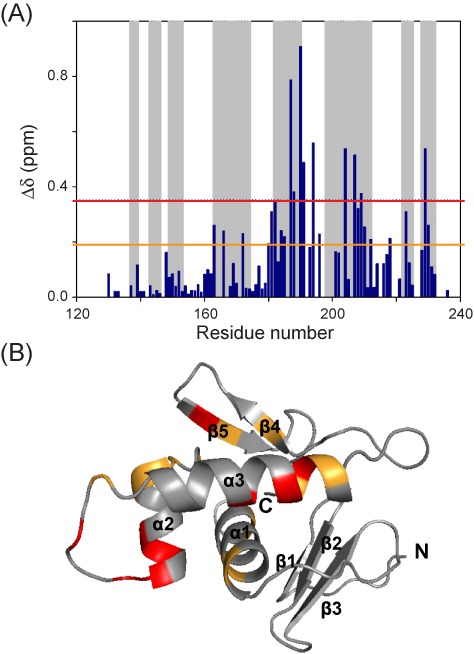
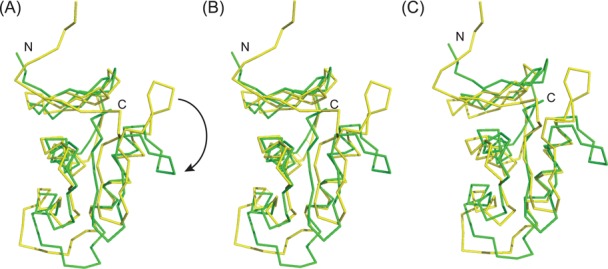
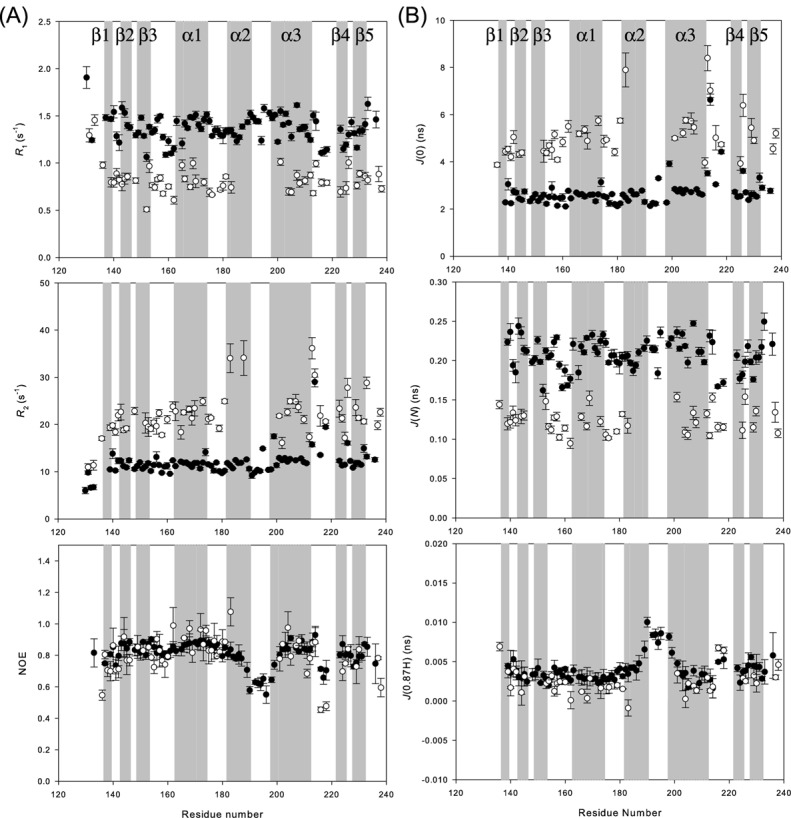
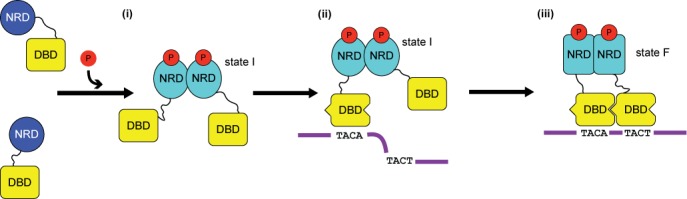
The RstA/RstB system is a bacterial two-component regulatory system consisting of the membrane sensor, RstB and its cognate response regulator (RR) RstA. The RstA of Klebsiella pneumoniae (kpRstA) consists of an N-terminal receiver domain (RD, residues 1-119) and a C-terminal DNA-binding domain (DBD, residues 130-236). Phosphorylation of kpRstA induces dimerization, which allows two kpRstA DBDs to bind to a tandem repeat, called the RstA box, and regulate the expression of downstream genes. Here we report the solution and crystal structures of the free kpRstA RD, DBD and DBD/RstA box DNA complex. The structure of the kpRstA DBD/RstA box complex suggests that the two protomers interact with the RstA box in an asymmetric fashion. Equilibrium binding studies further reveal that the two protomers within the kpRstA dimer bind to the RstA box in a sequential manner. Taken together, our results suggest a binding model where dimerization of the kpRstA RDs provides the platform to allow the first kpRstA DBD protomer to anchor protein-DNA interaction, whereas the second protomer plays a key role in ensuring correct recognition of the RstA box.


Figures

Figure 1.
Figure 1.
Determination of binding isotherm of kpRstA DBD with various RstA box DNA by isothermal titration calorimetry. The sequences of the duplex DNA used in this study are listed in (A). Binding of kpRstA DBD to DNA-16a (B) and DNA-16b (C) or DNA-22 (D) are shown with the ITC traces in the upper panel and the binding isotherms in the lower panel. The binding isotherm of the kpRstA DBD R207A mutant to DNA-16a is shown in (E). Binding of full-length kpRstA to DNA-22 is shown in (F) and that of kpRstA in the presence of BeF3 is shown in (G). Detailed fitting parameters are listed in Table 1.
Figure 2.
Figure 2.
Structural overview of kpRstA domains. (A) Crystal structure of the kpRstA RD dimer in the presence of BeF3. Dimer formation is mediated by the α4-β5-α5 interfaces highlighted in gold. The ligands within the phosphorylation site are shown as spheres with Mg2+ in green and BeF3- in magenta. (B) Solution structure of kpRstA DBD with the helices and β-strands highlighted in red and yellow, respectively. (C) Crystal structure of kpRstA DBD in complex with DNA-23, which contains the same sequence as DNA-22 with overhanging G bases to facilitate crystallization. Each DNA-23 binds to two DBD molecules, with the upstream and downstream protomers colored in blue and green, respectively.
Figure 3.
Figure 3.
(A) Interactions between beryllium fluoride and kpRstA RD phosphorylation site. (B) Structural alignment of kpRstA RD in the presence of BeF3 (green) and inactivated PhoP RD (magenta) shows significant conformational changes of the switch residues Thr79 and Tyr98. (C) The intermolecular interface is stabilized by two salt bridges formed between Asp97 (β5)–Arg111 (α5) and Glu92 (α4)–Arg113 (α5). Salt bridges are shown as dotted lines. (D) The α4 and α5 helices are packed together through a hydrophobic patch (spheres) formed by Ile88, Leu91, Ala106, Val107, Ala110 and Leu114. Stars (*) denote non-conserved residues among the OmpR/PhoB subfamily.
Figure 4.
Figure 4.
Intermolecular interactions in the kpRstA DBD/DNA-23 complex. (A) Protein–protein interactions between the upstream (blue) and downstream (green) DBDs. Hydrogen bonds and hydrophobic interactions are shown in orange dashes and space-fill dots, respectively. (B) Interactions between the upstream DBD protomer and DNA-23. The coding and template strands are colored magenta and yellow, respectively. (C) Schematic of the interactions between the DBDs and DNA-23. The upstream and downstream DBDs are represented by blue and green colors, respectively. Orange dots represent hydrogen bonds and salt bridges, and green dots represent van der Waals interactions. Residues involved in nonspecific interactions are located at helices α1 (Ser162), α2 (Arg182, Arg190), α3 (Ser200, Ser206, Arg209), the C-terminal β-hairpin (Thr224, Asn226, Asn227) and β5 (Tyr230).
Figure 5.
Figure 5.
Interaction between kpRstA DBD and DNA-16a. The normalized chemical shift perturbations (CSP) of kpRstA DBD induced by binding to DNA are shown in (A). Residues with CSP above the upper (red) and lower (orange) lines are mapped to the DBD structure in (B).
Figure 6.
Figure 6.
Conformational changes of kpRstA DBD upon binding to the RstA box DNA. (A) Superposition of the DNA-free (yellow) and DNA-bound (green) structures of the DBD. The apex of the α3–β4 loop swings down towards the α3 helix (shown in arrow). (B) Superposition of the same structures as (A) by superimposing the N-terminal region (res. 135–190). (C) Superposition of the same structures as (A) by superimposing the C-terminal region (res. 191–235).
Figure 7.
Figure 7.
Dynamics of kpRstA DBD as probed by NMR. (A) Sequence variations of the 1H-, 15N-R1 (top), 15N-R2 (middle) and 15N NOE (bottom) of kpRstA DBD (filled circles) and kpRstA DBD/DNA-16a complex (open circles). (B) Sequence variations of the reduced spectral density functions J(0) (top), J(N) (middle) and J(0.87H) (bottom) deduced from the dynamic data shown in (A).
Figure 8.
Figure 8.
Proposed structure-based model for binding of kpRstA to the RstA box DNA. (i) phosphorylation of the RD results in formation of kpRstA dimers with an intermediate RD–RD interface conformation (state I). Due to the presence of two DBDs close in space, the DNA-binding affinity is increased compared to the unphosphorylated form. (ii) Binding of the first DBD to the upstream half-site of the RstA box causes conformational changes in the first DBD, ‘priming’ it for interaction with the second DBD. (iii) The second DBD binds to the downstream half-site and ‘locks’ the complex through DBD–DBD and RD–RD interactions. At the same time, the RD–RD dimer assumes its final conformation (state F), providing the entropic energy required for the second binding event.

References

    1. Chang C., Stewart R.C. The two-component system. Regulation of diverse signaling pathways in prokaryotes and eukaryotes. Plant Physiol. 1998;117:723–731. - PMC - PubMed
    1. Groisman E.A. The pleiotropic two-component regulatory system PhoP-PhoQ. J. Bacteriol. 2001;183:1835–1842. - PMC - PubMed
    1. Nixon B.T., Ronson C.W., Ausubel F.M. Two-component regulatory systems responsive to environmental stimuli share strongly conserved domains with the nitrogen assimilation regulatory genes ntrB and ntrC. Proc. Natl. Acad. Sci. U.S.A. 1986;83:7850–7854. - PMC - PubMed
    1. Parkinson J.S., Kofoid E.C. Communication modules in bacterial signaling proteins. Annu. Rev. Genet. 1992;26:71–112. - PubMed
    1. Wuichet K., Cantwell B.J., Zhulin I.B. Evolution and phyletic distribution of two-component signal transduction systems. Curr. Opin. Microbiol. 2010;13:219–225. - PMC - PubMed

Publication types

MeSH terms