

The regulatory T cell effector molecule fibrinogen-like protein 2 is necessary for the development of rapamycin-induced tolerance to fully MHC-mismatched murine cardiac allografts
- PMID: 24990517
- PMCID: PMC4264913
- DOI: 10.1111/imm.12354
The regulatory T cell effector molecule fibrinogen-like protein 2 is necessary for the development of rapamycin-induced tolerance to fully MHC-mismatched murine cardiac allografts
Abstract
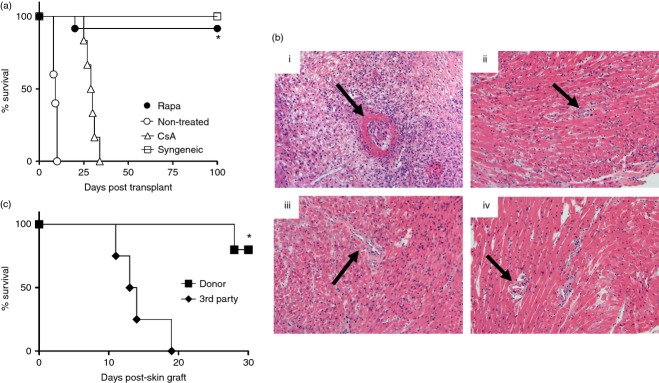
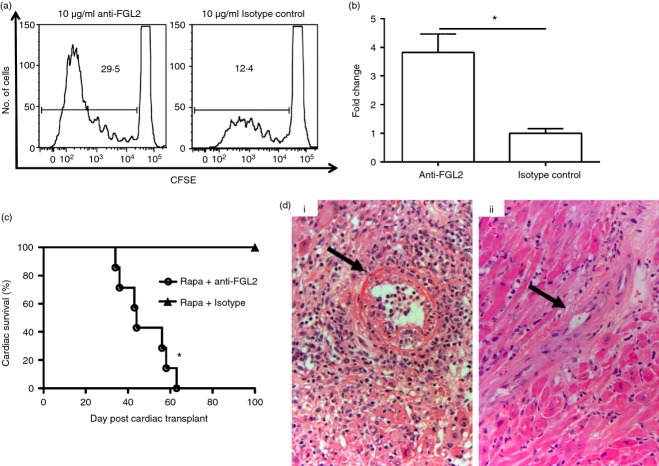
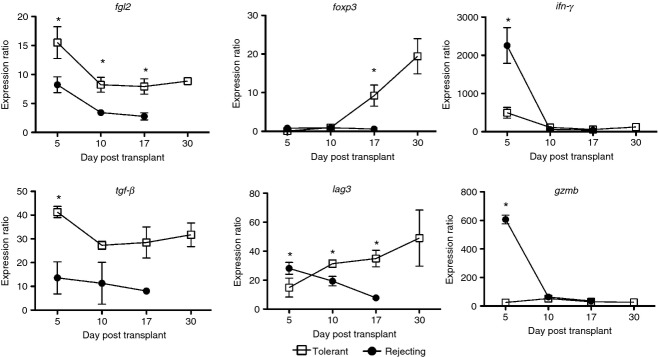
Therapies that promote tolerance in solid organ transplantation will improve patient outcomes by eliminating the need for long-term immunosuppression. To investigate mechanisms of rapamycin-induced tolerance, C3H/HeJ mice were heterotopically transplanted with MHC-mismatched hearts from BALB/cJ mice and were monitored for rejection after a short course of rapamycin treatment. Mice that had received rapamycin developed tolerance with indefinite graft survival, whereas untreated mice all rejected their grafts within 9 days. In vitro, splenic mononuclear cells from tolerant mice maintained primary CD4(+) and CD8(+) immune responses to donor antigens consistent with a mechanism that involves active suppression of immune responses. Furthermore, infection with lymphocytic choriomeningitis virus strain WE led to loss of tolerance suggesting that tolerance could be overcome by infection. Rapamycin-induced, donor-specific tolerance was associated with an expansion of regulatory T (Treg) cells in both the spleen and allograft and elevated plasma levels of fibrinogen-like protein 2 (FGL2). Depletion of Treg cells with anti-CD25 (PC61) and treatment with anti-FGL2 antibody both prevented tolerance induction. Tolerant allografts were populated with Treg cells that co-expressed FGL2 and FoxP3, whereas rejecting allografts and syngeneic grafts were nearly devoid of dual-staining cells. We examined the utility of an immunoregulatory gene panel to discriminate between tolerance and rejection. We observed that Treg-associated genes (foxp3, lag3, tgf-β and fgl2) had increased expression and pro-inflammatory genes (ifn-γ and gzmb) had decreased expression in tolerant compared with rejecting allografts. Taken together, these data strongly suggest that Treg cells expressing FGL2 mediate rapamycin-induced tolerance. Furthermore, a gene biomarker panel that includes fgl2 can distinguish between rejecting and tolerant grafts.
Keywords: fgl2; regulatory T cell; tolerance; transplantation.
© 2014 John Wiley & Sons Ltd.
Figures
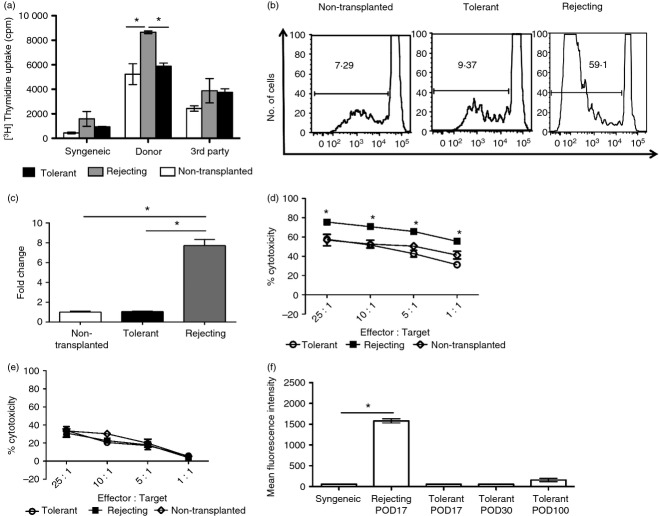
 ), and POD 100 rapamycin-treated and tolerant (▪) C3H/HeJ mice and co-cultured with irradiated SMNC from syngeneic (C3H/HeJ), donor (BALB/cJ) or third-party (C57BL/6J) mice. *P < 0·05 versus rejecting group. (b) CFSE proliferation profiles of (i) non-transplanted, (ii) POD 30 tolerant, and (iii) POD 30 rejecting C3H/HeJ SMNC stimulated with irradiated donor SMNC. (c) Quantification of CFSE proliferation data. Proliferation of SMNC from the different groups is shown as a fold change compared with SMNC from non-transplanted mice (mean ± SEM). *P < 0·05 versus rejecting group. (d, e) Cytotoxic T lymphocyte (CTL) assay. SMNC were isolated from non-transplanted controls (♢), POD 100 tolerant (
 ) and POD 100 rejecting (▪) C3H/HeJ graft recipients and co-cultured with donor A20 (d) or third-party EL4 (e) target cells. *P < 0·05 versus rejecting group. (f) Sera from syngeneic, tolerant and rejecting recipients were analysed for the presence of donor-specific antibody (DSA) by flow cytometry. Data are expressed as mean ± SEM. *P < 0·05 versus syngeneic control. Data for (a), (c) and (f) have three or four mice per group. Data for (b), (d) and (e) are representative of three independent experiments performed in triplicate. Rapa, rapamycin.
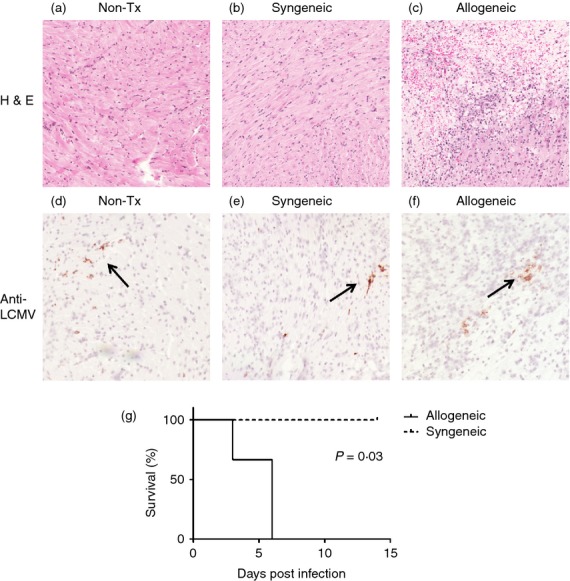
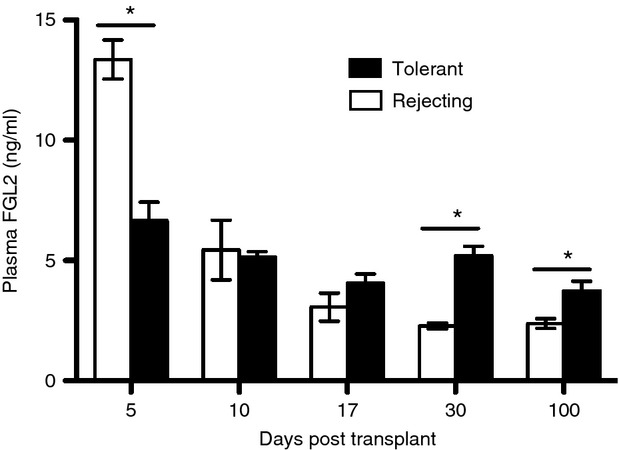
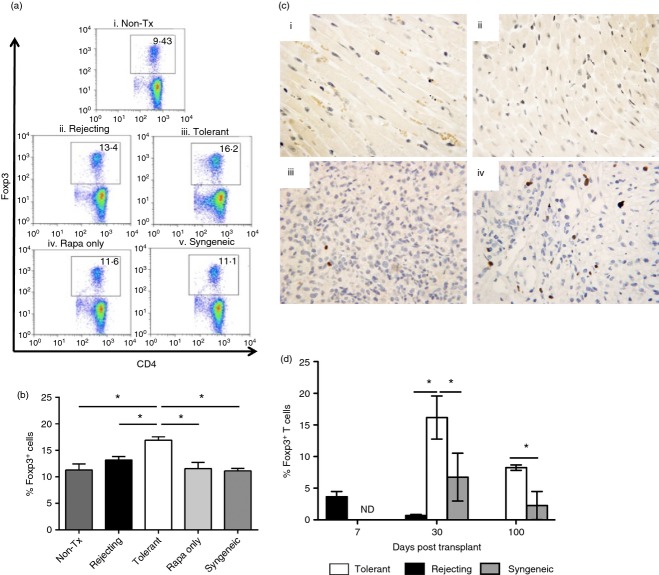 ), tolerant (□) and rejecting (▪) groups at different time-points after transplantation. A minimum of three mice per group at each time-point. Data are expressed as the mean ± SEM. *P < 0·05 versus rejecting group or syngeneic group. ND, not determined.
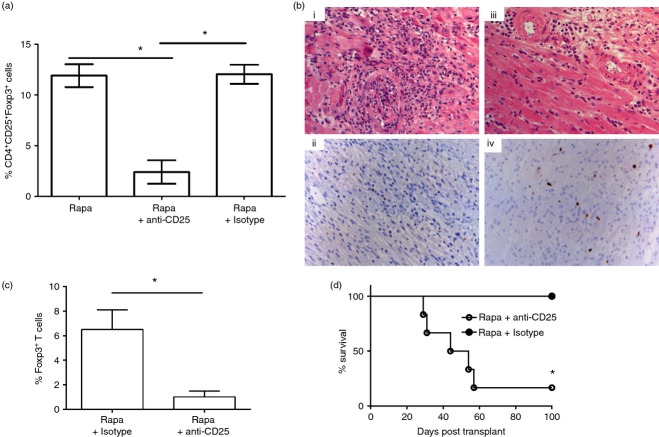

Similar articles
-
Identification of a novel biomarker gene set with sensitivity and specificity for distinguishing between allograft rejection and tolerance.Liver Transpl. 2012 Apr;18(4):444-54. doi: 10.1002/lt.22480. Liver Transpl. 2012. PMID: 22162188
-
Overexpression of Fibrinogen-Like Protein 2 Promotes Tolerance in a Fully Mismatched Murine Model of Heart Transplantation.Am J Transplant. 2016 Jun;16(6):1739-50. doi: 10.1111/ajt.13696. Epub 2016 Mar 17. Am J Transplant. 2016. PMID: 26718313
-
Unraveling the Crucial Roles of FoxP3+ Regulatory T Cells in Vascularized Composite Allograft Tolerance Induction and Maintenance.Transplantation. 2021 Jun 1;105(6):1238-1249. doi: 10.1097/TP.0000000000003509. Transplantation. 2021. PMID: 33141809
-
TGF-β in transplantation tolerance.Curr Opin Immunol. 2011 Oct;23(5):660-9. doi: 10.1016/j.coi.2011.07.003. Epub 2011 Aug 10. Curr Opin Immunol. 2011. PMID: 21839624 Review.
-
T helper subsets & regulatory T cells: rethinking the paradigm in the clinical context of solid organ transplantation.Int J Immunogenet. 2014 Jun;41(3):185-94. doi: 10.1111/iji.12106. Epub 2014 Feb 3. Int J Immunogenet. 2014. PMID: 24495112 Review.
Cited by
-
Role of Regulatory T Cells (Treg) and the Treg Effector Molecule Fibrinogen-like Protein 2 in Alloimmunity and Autoimmunity.Rambam Maimonides Med J. 2015 Jul 30;6(3):e0024. doi: 10.5041/RMMJ.10209. Rambam Maimonides Med J. 2015. PMID: 26241231 Free PMC article.
-
The role of sildenafil in the development of transplant arteriosclerosis in rat aortic grafts.Am J Transl Res. 2017 Nov 15;9(11):4914-4924. eCollection 2017. Am J Transl Res. 2017. PMID: 29218089 Free PMC article.
-
Gene expression meta-analysis reveals immune response convergence on the IFNγ-STAT1-IRF1 axis and adaptive immune resistance mechanisms in lymphoma.Genome Med. 2015 Sep 11;7(1):96. doi: 10.1186/s13073-015-0218-3. Genome Med. 2015. PMID: 26362649 Free PMC article.
-
Overexpression of fibrinogen-like protein 2 alleviates acute rejection in rat models of liver transplantation.Ann Transl Med. 2021 Mar;9(5):408. doi: 10.21037/atm-20-7881. Ann Transl Med. 2021. PMID: 33842629 Free PMC article.
-
Soluble fibrinogen like protein 2 (sFGL2), the novel effector molecule for immunoregulation.Oncotarget. 2017 Jan 10;8(2):3711-3723. doi: 10.18632/oncotarget.12533. Oncotarget. 2017. PMID: 27732962 Free PMC article. Review.
References
-
- Lechler RI, Sykes M, Thomson AW, Turka LA. Organ transplantation – how much of the promise has been realized? Nat Med. 2005;11:605–13. - PubMed
-
- Battaglia M, Stabilini A, Migliavacca B, Horejs-Hoeck J, Kaupper T, Roncarolo MG. Rapamycin promotes expansion of functional CD4+ CD25+ FOXP3+ regulatory T cells of both healthy subjects and type 1 diabetic patients. J Immunol. 2006;177:8338–47. - PubMed
-
- Battaglia M, Stabilini A, Roncarolo MG. Rapamycin selectively expands CD4+ CD25+ FoxP3+ regulatory T cells. Blood. 2005;105:4743–8. - PubMed
Publication types
MeSH terms
Substances
Grants and funding
LinkOut - more resources
Full Text Sources
Other Literature Sources
Medical
Research Materials
Miscellaneous
