

Fast and accurate imputation of summary statistics enhances evidence of functional enrichment
- PMID: 24990607
- PMCID: PMC4184260
- DOI: 10.1093/bioinformatics/btu416
Fast and accurate imputation of summary statistics enhances evidence of functional enrichment
Abstract
Motivation: Imputation using external reference panels (e.g. 1000 Genomes) is a widely used approach for increasing power in genome-wide association studies and meta-analysis. Existing hidden Markov models (HMM)-based imputation approaches require individual-level genotypes. Here, we develop a new method for Gaussian imputation from summary association statistics, a type of data that is becoming widely available.
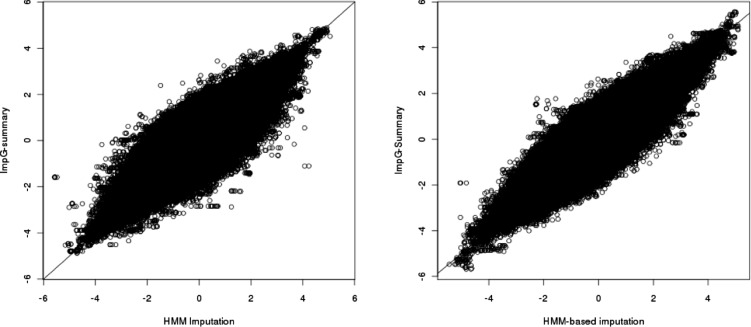
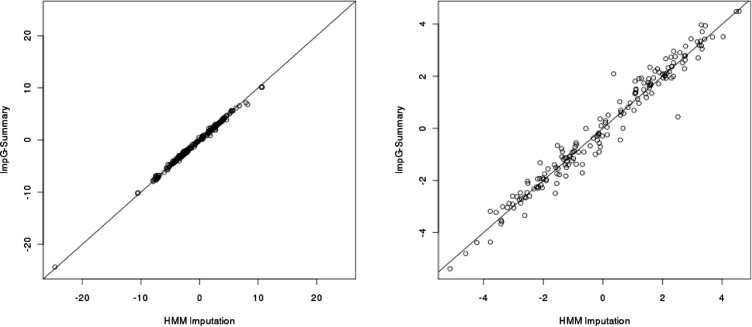
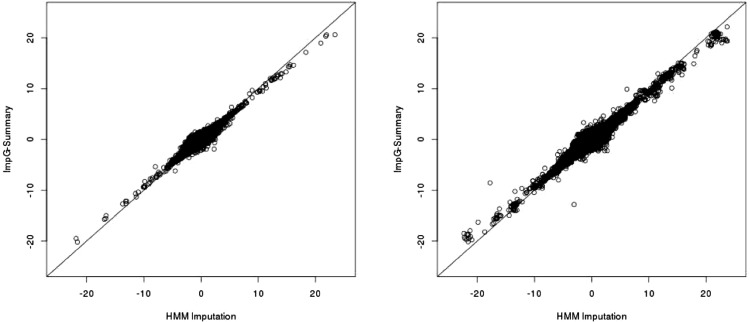
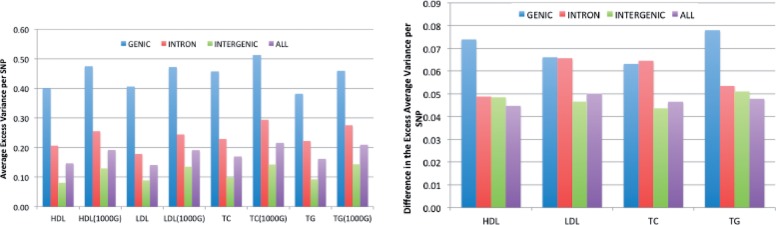
Results: In simulations using 1000 Genomes (1000G) data, this method recovers 84% (54%) of the effective sample size for common (>5%) and low-frequency (1-5%) variants [increasing to 87% (60%) when summary linkage disequilibrium information is available from target samples] versus the gold standard of 89% (67%) for HMM-based imputation, which cannot be applied to summary statistics. Our approach accounts for the limited sample size of the reference panel, a crucial step to eliminate false-positive associations, and it is computationally very fast. As an empirical demonstration, we apply our method to seven case-control phenotypes from the Wellcome Trust Case Control Consortium (WTCCC) data and a study of height in the British 1958 birth cohort (1958BC). Gaussian imputation from summary statistics recovers 95% (105%) of the effective sample size (as quantified by the ratio of [Formula: see text] association statistics) compared with HMM-based imputation from individual-level genotypes at the 227 (176) published single nucleotide polymorphisms (SNPs) in the WTCCC (1958BC height) data. In addition, for publicly available summary statistics from large meta-analyses of four lipid traits, we publicly release imputed summary statistics at 1000G SNPs, which could not have been obtained using previously published methods, and demonstrate their accuracy by masking subsets of the data. We show that 1000G imputation using our approach increases the magnitude and statistical evidence of enrichment at genic versus non-genic loci for these traits, as compared with an analysis without 1000G imputation. Thus, imputation of summary statistics will be a valuable tool in future functional enrichment analyses.
Availability and implementation: Publicly available software package available at http://bogdan.bioinformatics.ucla.edu/software/.
Contact: bpasaniuc@mednet.ucla.edu or aprice@hsph.harvard.edu
Supplementary information: Supplementary materials are available at Bioinformatics online.
© The Author 2014. Published by Oxford University Press. All rights reserved. For Permissions, please e-mail: journals.permissions@oup.com.
Figures
References
Publication types
MeSH terms
Grants and funding
LinkOut - more resources
Full Text Sources
Other Literature Sources
