. 2014 Aug 15;289(33):22798-22814.
doi: 10.1074/jbc.M114.568535. Epub 2014 Jul 2.

Suppression of the DHX9 helicase induces premature senescence in human diploid fibroblasts in a p53-dependent manner

Affiliations

Suppression of the DHX9 helicase induces premature senescence in human diploid fibroblasts in a p53-dependent manner

Teresa Lee et al. J Biol Chem. .

Abstract

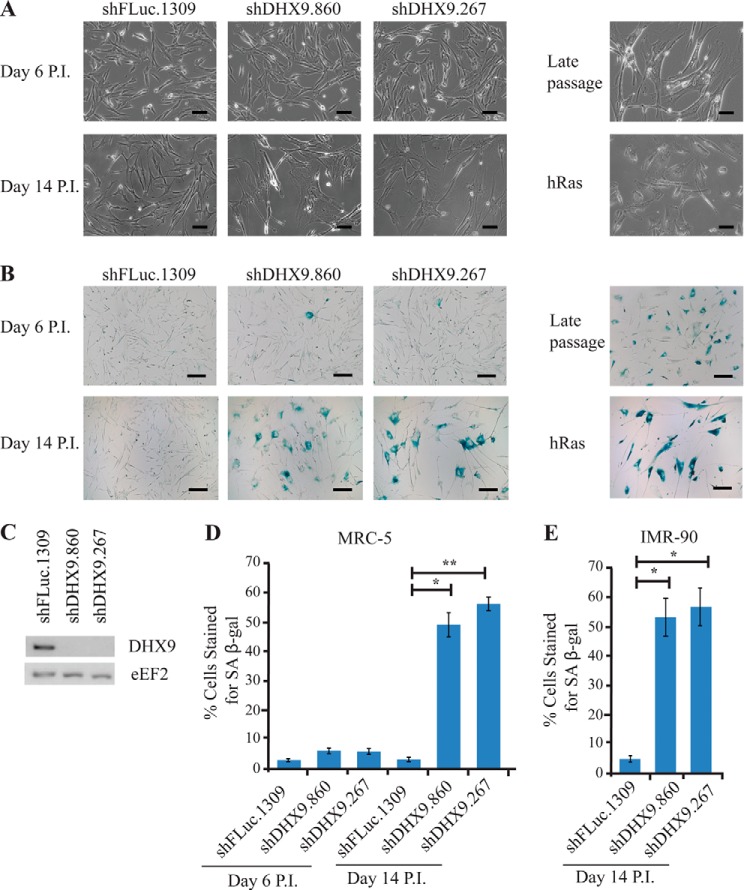
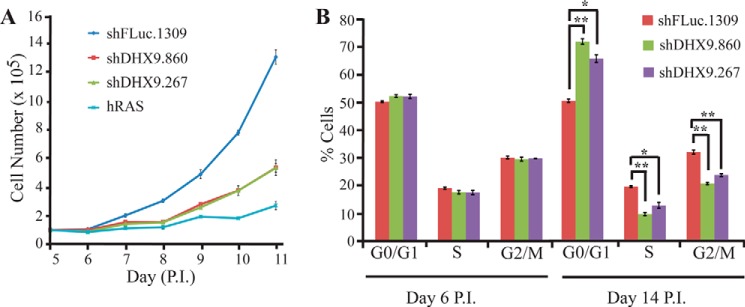
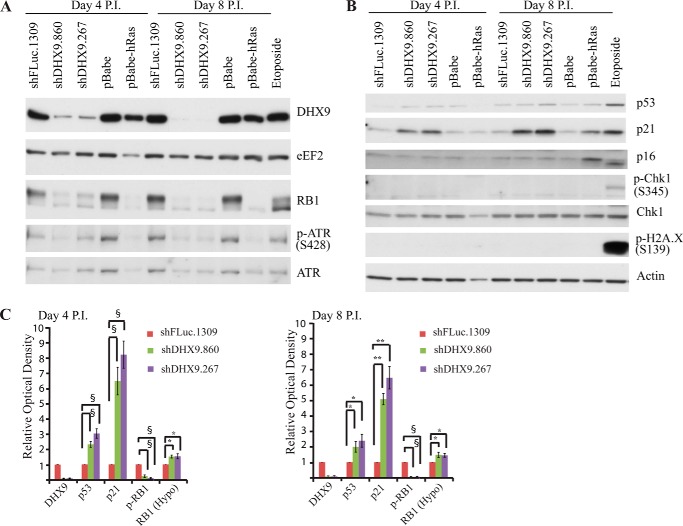
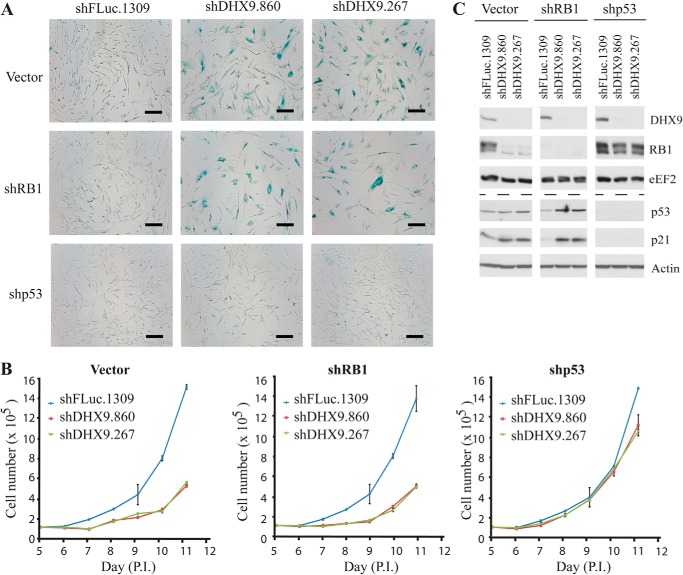
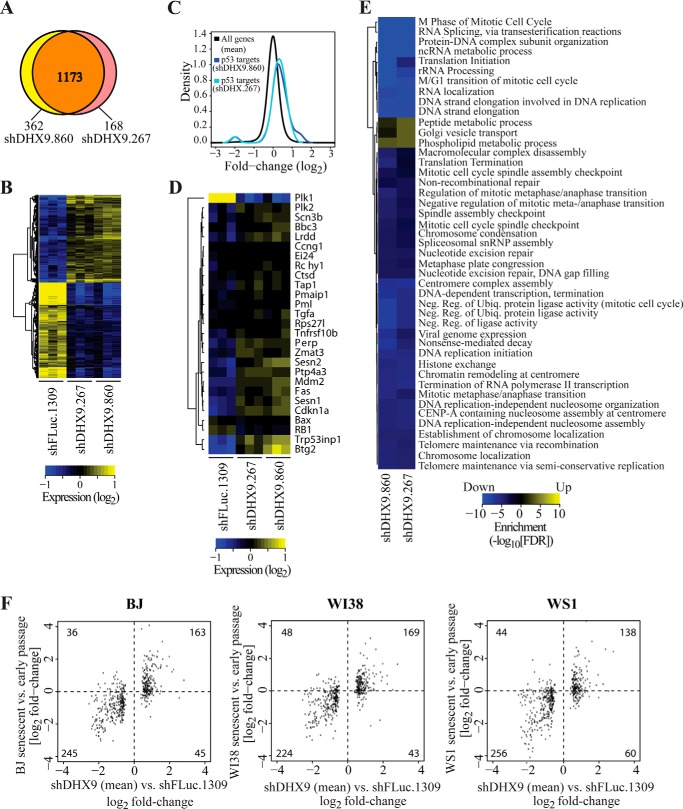
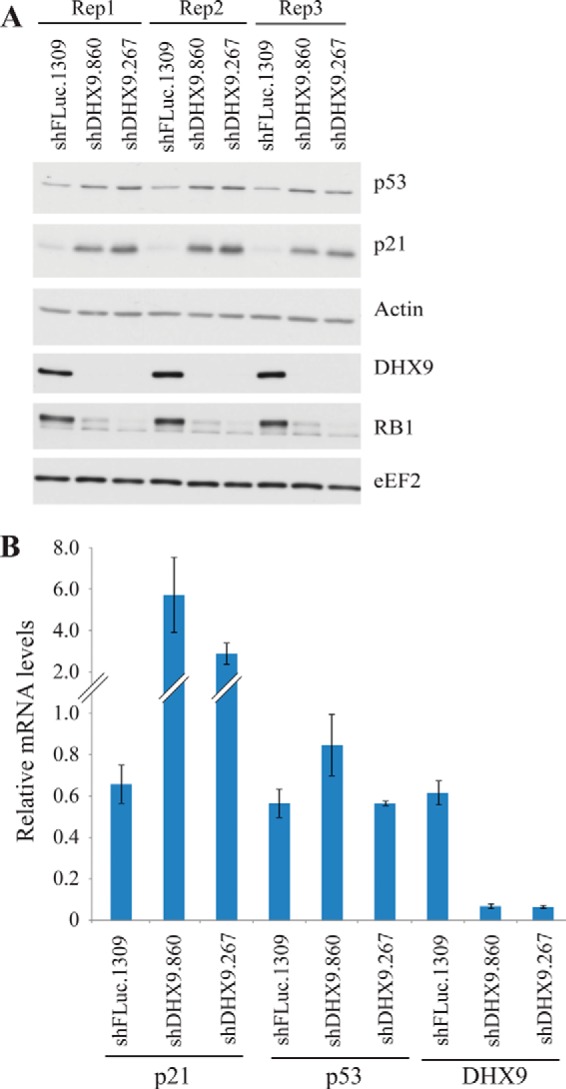
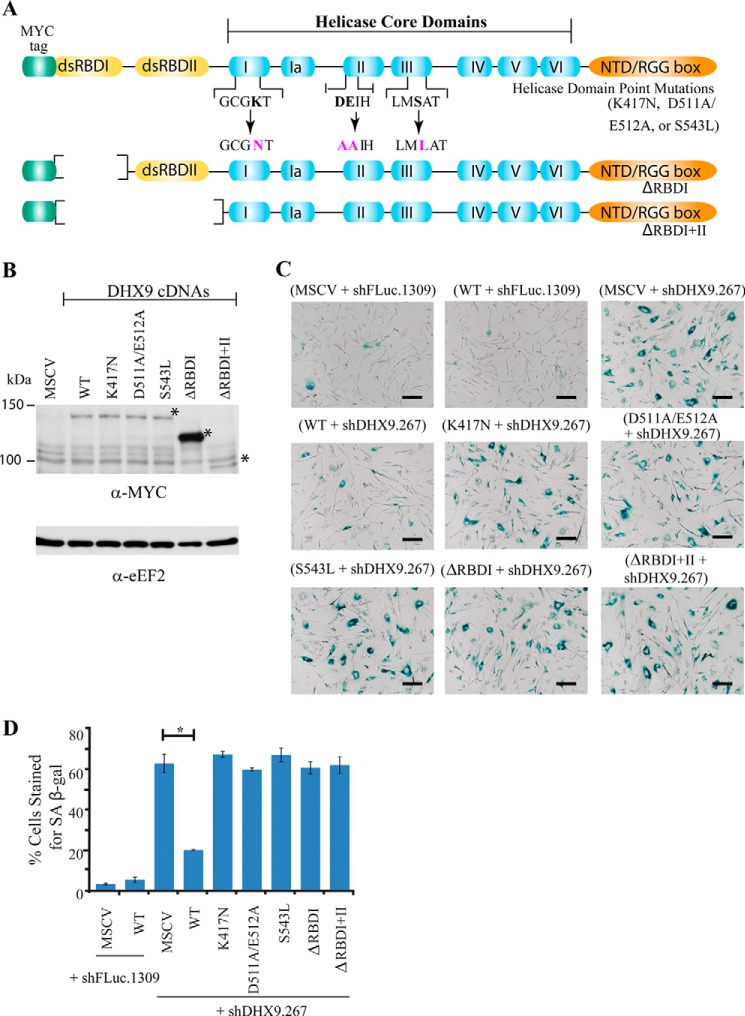
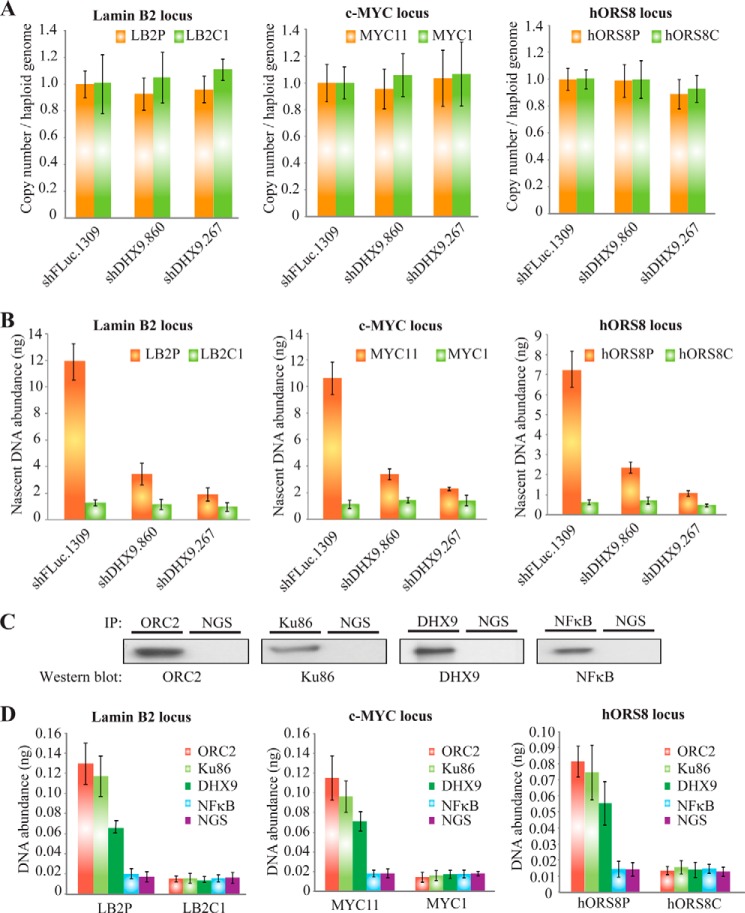
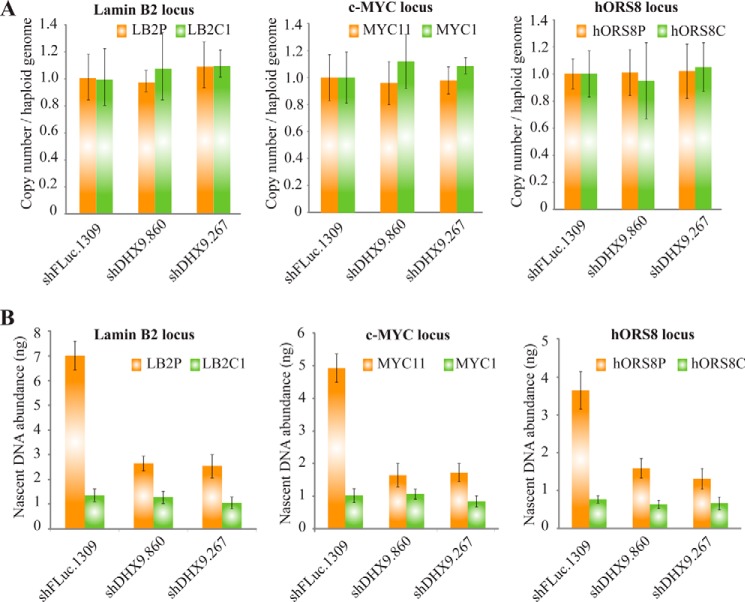
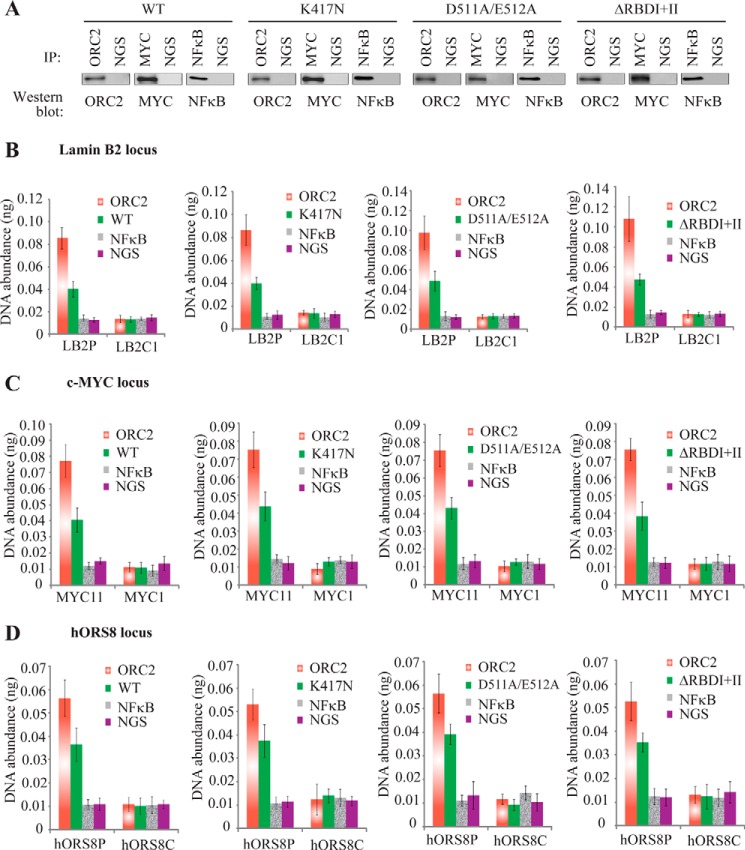
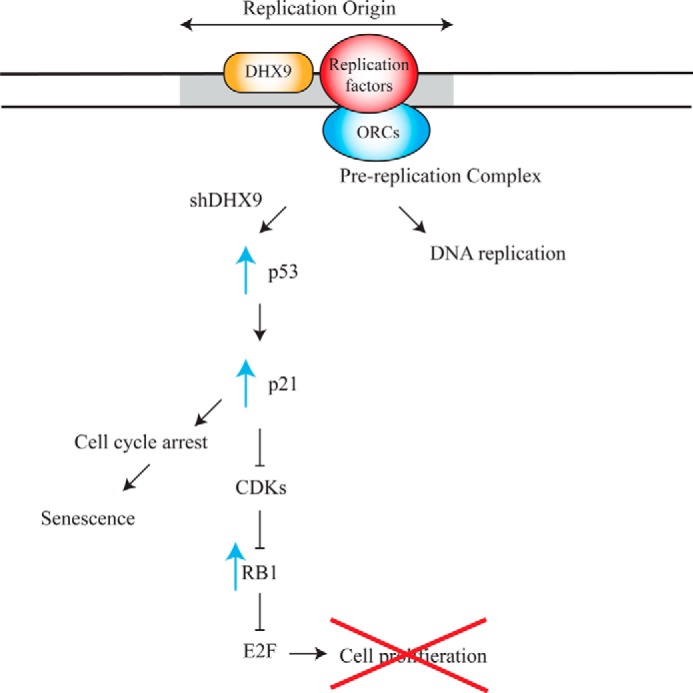
DHX9 is an ATP-dependent DEXH box helicase with a multitude of cellular functions. Its ability to unwind both DNA and RNA, as well as aberrant, noncanonical polynucleotide structures, has implicated it in transcriptional and translational regulation, DNA replication and repair, and maintenance of genome stability. We report that loss of DHX9 in primary human fibroblasts results in premature senescence, a state of irreversible growth arrest. This is accompanied by morphological defects, elevation of senescence-associated β-galactosidase levels, and changes in gene expression closely resembling those encountered during replicative (telomere-dependent) senescence. Activation of the p53 signaling pathway was found to be essential to this process. ChIP analysis and investigation of nascent DNA levels revealed that DHX9 is associated with origins of replication and that its suppression leads to a reduction of DNA replication. Our results demonstrate an essential role of DHX9 in DNA replication and normal cell cycle progression.

Keywords: Cell Cycle; Cell Growth; DNA Replication; Helicase; Senescence; p53.


Figures

FIGURE 1.
FIGURE 1.
DHX9 knockdown results in morphological changes and increased senescence-associated β-galactosidase staining in primary human cells. A, phase images, and B, β-galactosidase staining of MRC-5 cells transduced with lentivirus expressing the indicated shRNAs or hRAS V12 cDNA, harvested 6 and 14 days P.I. Late passage MRC-5 cells and senescent cells induced by hRAS V12 transduction are shown for comparison. Bars represents 100 μm for the phase images and 200 μm for the β-galactosidase-stained images. C, Western blot showing knockdown efficiencies of DHX9 shRNAs in MRC-5 cells following transduction with lentiviral vectors. Extracts were prepared from cells 8 days following infection, fractionated by SDS-PAGE, transferred to PVDF membrane, and probed with antibodies to the indicated proteins. D, quantitation of β-galactosidase staining from B. Cells from at least five independent fields/experiment were quantitated. Error bars represent S.E., n = 3. *, p < 0.01; **, p < 0.001. E, quantitation of β-galactosidase staining from IMR-90 cells transduced with the indicated shRNAs. Cells from at least five independent fields/experiment were quantitated. Error bars represent S.E., n = 3. *, p < 0.01.
FIGURE 2.
FIGURE 2.
DHX9 knockdown results in a pronounced growth arrest in MRC-5 cells. A, growth curves for MRC-5 cells transduced with hRAS V12 cDNA, shFLuc.1309, or DHX9 shRNAs. Cells were counted between days 5 and 11 P.I. Error bars represent S.E., n = 3. B, cell cycle analysis of MRC-5 cells transduced with control or DHX9 shRNAs at 6 and 14 days P.I. Error bars represent S.E., n = 3. *, p < 0.01; **, p < 0.001.
FIGURE 3.
FIGURE 3.
Effect of DHX9 suppression on cell cycle regulatory and DNA-damage response proteins. Western blot analysis of extracts from MRC-5 cells transduced with control (shFLuc.1309) or DHX9 shRNAs, 4 and 8 days P.I. pBabe-hRAS-infected and etoposide-treated cells were used as controls. Extracts were fractionated on 6% (A) or 15% (B) polyacrylamide gels. Blots were probed with antibodies to the proteins indicated at right. eEF2 and actin are used as loading controls. C, quantitation of the relative optical densities of Western blot bands from extracts prepared 4 and 8 days post-infection. Shown are extracts from MRC-5 cells transduced with shRNA against FLuc.1309, DHX9.860, or DHX9.267, probed with various antibodies. Error bars represent S.E., n = 3–6. The optical densities of the shDHX9.860 and shDHX9.267 bands are normalized to that of the shFLuc.1309 bands. *, p < 0.05; **, p < 0.01; and §, p < 0.001.
FIGURE 4.
FIGURE 4.
DHX9-induced senescence is p53-dependent. A, β-galactosidase staining of MRC-5 cells transduced with virus expressing the indicated shRNAs, 14 days post-transduction. Bars represent 200 μm. B, growth curves of MRC-5 cells transduced with virus expressing the indicated shRNAs. Cells were counted between days 5 and 11 post-transduction. C, Western blot analysis of p53, p21, RB1, and DHX9 from MRC-5 cells transduced with virus expressing the indicated shRNAs.
FIGURE 5.
FIGURE 5.
Gene expression signature induced by DHX9 suppression resembles that of replicative senescence. A and B, gene expression signatures in cells transduced with shDHX9.267 or shDHX9.860 overlap. Shown is a Venn diagram highlighting the number of common and distinct differentially expressed genes from cells transduced with either of the two DHX9 shRNAs (A) and a heatmap showing a reproducible and concordant expression pattern (B). C, reduced expression of DHX9 induces a p53 gene expression program. Densities of fold-changes (DHX9 shRNAs versus FLuc.1309 shRNA) for all genes and a subset of p53 target genes are shown. D, heatmap of the p53 target genes identified in C. E, highly significant enrichment of biological processes among genes that are differentially expressed upon reduced DHX9 expression. A heatmap indicating the significances of enrichments (FDRs for cells transduced with each DHX9 shRNA separately) for nonredundant biological processes defined by the Gene Ontology Consortium is presented. F, comparison between genes differentially expressed by reduced expression of DHX9 compared with previously described signatures of replicative senescence in fibroblasts. Shown is a scatterplot of fold-changes for specific genes. The number of genes in each quadrant is indicated. The p values for the comparison between the number of genes showing concordant regulation (i.e. elevated or repressed in both comparisons) to what is expected by chance (i.e. equal distribution of the genes in all quadrants) are: BJ, p value = 2.46e-29; WI38, p value = 8.14e-25; WS1, p value = 5.24e-22.
FIGURE 6.
FIGURE 6.
A, Western blot analysis of MRC-5 cells transduced with a control (shFLuc. 1309) or DHX9 shRNAs, corresponding to the samples used for microarray analysis presented in Fig. 5. B, quantitative RT-PCR analysis of selected genes regulated by DHX9 suppression. Error bars indicate S.E., n = 3.
FIGURE 7.
FIGURE 7.
Functional analysis of DHX9 using various mutant cDNA constructs. A, schematic diagram of DHX9 cDNA and mutants used in this study. B, Western blot analysis of WT DHX9 and mutants expressed in MRC-5 cells. The empty vector, MSCV, is used as a control. * denotes position of migration of recombinant protein. C, β-galactosidase staining of MRC-5 cells transduced with lentivirus expressing the indicated shRNAs in combination with various DHX9 cDNAs. D, quantitation of β-galactosidase staining from C. Cells from at least five independent fields/experiment were quantitated. Error bars represent S.E., n = 3. *, p < 0.01.
FIGURE 8.
FIGURE 8.
Loss of DHX9 inhibits DNA replication. A, copy number per haploid genome at the indicated chromosomal loci in MRC-5 cells transduced with a control (shFLuc.1309) or DHX9 shRNAs and harvested 6 days post-infection. Results are normalized to the shFLuc.1309 sample. Error bars represent S.D.; n = 3. B, quantification by qPCR of nascent DNA abundance (nanograms) at the indicated loci in MRC-5 cells transduced with a control (shFLuc.1309) or DHX9 shRNAs, 6 days post-transduction. The location and sequence information of the primers used for the amplification of the origin-containing regions (LB2P, Myc11, and hOrs8P; orange bars) and the non-origin-containing control regions (LB2C, Myc1, and hOrs8C; green bars) are as described in Table 1. Error bars represent S.D.; n = 3. C, Western blot analysis of the ChIP performed with the indicated proteins. Following ChIP, an aliquot of the IP was fractionated by SDS-PAGE, transferred to Immobilon-P, and probed with antibodies to the indicated proteins. D, quantification by qPCR of immunoprecipitated DNA abundance (nanograms) at the indicated chromosomal loci in MRC-5 cells transduced with a control (shFLuc.1309) or DHX9 shRNAs. Chromatin IP was performed with antibodies directed against ORC2 (red bars), Ku86 (light green bars), DHX9 (dark green bars), and NFκB (blue bars); NGS (purple bars) was used as a negative control. Error bars represent S.D.; n = 3.
FIGURE 9.
FIGURE 9.
Inhibition of DNA replication occurs before DHX9-induced senescence. A, copy number per haploid genome at the indicated chromosomal loci in MRC-5 cells transduced with a p53 shRNA in combination with a control (shFLuc.1309) or DHX9 shRNAs. Results are normalized to the shFLuc.1309 sample. Error bars represent S.D.; n = 3. B, quantification by qPCR of nascent DNA abundance (nanograms) at the indicated loci in MRC-5 cells transduced with a p53 shRNA and either a control (FLuc.1309) or DHX9 shRNAs, 6 days post-transduction. The location and sequence information of the primers used for the amplification of the origin-containing regions (LB2P, Myc11, and hOrs8P; orange bars) and the non-origin-containing control regions (LB2C, Myc1, and hOrs8C; green bars) are as described in Table 1. Error bars represent S.D.; n = 3.
FIGURE 10.
FIGURE 10.
Binding of DHX9 to origins is not dependent on its helicase or RNA-binding domains. A, Western blot analysis of the ChIP performed with the indicated proteins. MRC-5 cells were transduced with a Myc-tagged construct expressing either the WT DHX9 cDNA or the K417N, D511A/E512A, or ΔRBDI+II mutants. Following ChIP, an aliquot of the IP was fractionated by SDS-PAGE, transferred to Immobilon-P, and probed with antibodies to the indicated proteins. B–D, quantification by qPCR of immunoprecipitated DNA abundance (nanograms) at the Lamin B2 (B), c-Myc (C), or hORS8 (D) chromosomal loci in MRC-5 cells expressing either the WT DHX9 cDNA or the K417N, D511A/E512A, or ΔRBDI+II mutants. Chromatin IP was performed with antibodies directed against ORC2 (red bars), Myc (green bars), and NFκB (gray bars). NGS (purple bars) was used as a negative control. Error bars represent S.D.; n = 3.
FIGURE 11.
FIGURE 11.
Model highlighting the mechanism by which DHX9 suppression leads to senescence. Under normal cellular conditions, DHX9 facilitates DNA replication at origins of replication. Loss of DHX9 leads to inhibition of DNA replication at origins of replication. This results in a defect in downstream recruitment of factors onto chromatin, which activates a p53 stress response leading to transcriptional activation of p21. Activation of p21 inhibits downstream CDKs and prevents RB1 phosphorylation, which inhibits E2F and blocks transcription of genes required for proliferation. Additionally, p21 may affect cell cycle arrest independent of RB1. Genes involved in DNA replication, cell cycle progression, and mitosis are down-regulated upon DHX9 knockdown, contributing to the growth arrest (see “Discussion” for details).

Similar articles

Cited by

References

    1. Hayflick L., Moorhead P. S. (1961) The serial cultivation of human diploid cell strains. Exp. Cell Res. 25, 585–621 - PubMed
    1. Olovnikov A. M. (1971) Principle of marginotomy in template synthesis of polynucleotides. Dokl. Akad. Nauk SSSR 201, 1496–1499 - PubMed
    1. Watson J. D. (1972) Origin of concatemeric T7 DNA. Nat. New Biol. 239, 197–201 - PubMed
    1. Herbig U., Jobling W. A., Chen B. P., Chen D. J., Sedivy J. M. (2004) Telomere shortening triggers senescence of human cells through a pathway involving ATM, p53, and p21(CIP1), but not p16(INK4a). Mol. Cell 14, 501–513 - PubMed
    1. Robles S. J., Buehler P. W., Negrusz A., Adami G. R. (1999) Permanent cell cycle arrest in asynchronously proliferating normal human fibroblasts treated with doxorubicin or etoposide but not camptothecin. Biochem. Pharmacol. 58, 675–685 - PubMed

Publication types

MeSH terms