. 2014 Sep;88(18):10725-37.
doi: 10.1128/JVI.00928-14. Epub 2014 Jul 2.

Tobacco etch virus protein P1 traffics to the nucleolus and associates with the host 60S ribosomal subunits during infection

Affiliations

Tobacco etch virus protein P1 traffics to the nucleolus and associates with the host 60S ribosomal subunits during infection

Fernando Martínez et al. J Virol. 2014 Sep.

Abstract

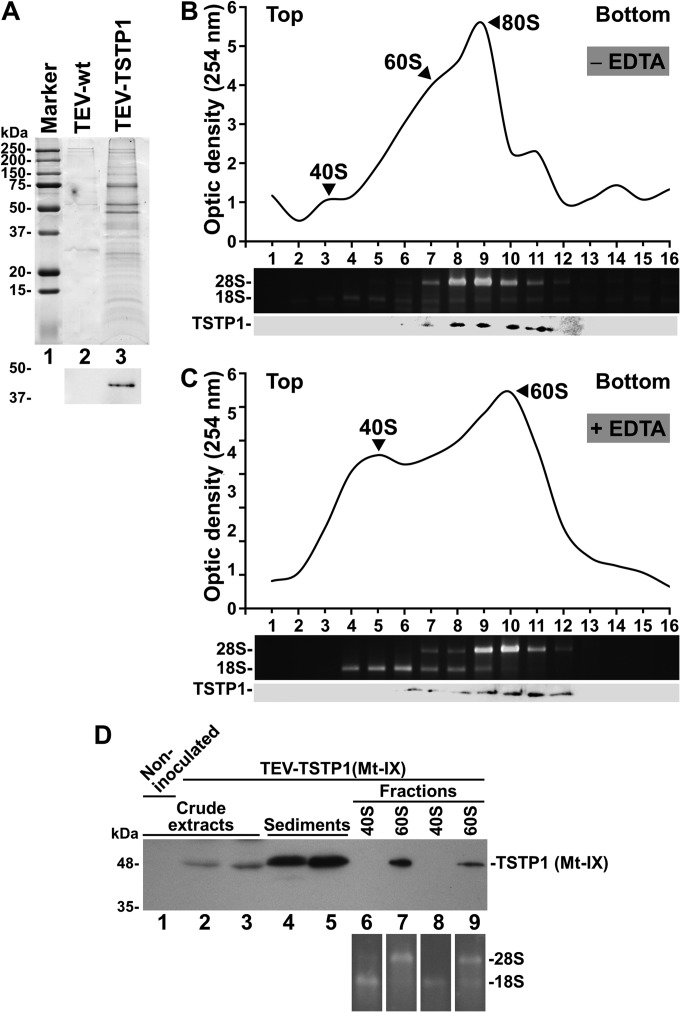
The genus Potyvirus comprises a large group of positive-strand RNA plant viruses whose genome encodes a large polyprotein processed by three viral proteinases. P1 protein, the most amino-terminal product of the polyprotein, is an accessory factor stimulating viral genome amplification whose role during infection is not well understood. We infected plants with Tobacco etch virus (TEV; genus Potyvirus) clones in which P1 was tagged with a fluorescent protein to track its expression and subcellular localization or with an affinity tag to identify host proteins involved in complexes in which P1 also takes part during infection. Our results showed that TEV P1 exclusively accumulates in infected cells at an early stage of infection and that the protein displays a dynamic subcellular localization, trafficking in and out of the nucleus and nucleolus during infection. Inside the nucleolus, P1 particularly targets the dense granular component. Consistently, we found functional nucleolar localization and nuclear export signals in TEV P1 sequence. Our results also indicated that TEV P1 physically interacts with the host 80S cytoplasmic ribosomes and specifically binds to the 60S ribosomal subunits during infection. In vitro translation assays of reporter proteins suggested that TEV P1 stimulates protein translation, particularly when driven from the TEV internal ribosome entry site. These in vitro assays also suggested that TEV helper-component proteinase (HC-Pro) inhibits protein translation. Based on these findings, we propose that TEV P1 stimulates translation of viral proteins in infected cells.

Importance: In this work, we researched the role during infection of tobacco etch virus P1 protease. P1 is the most mysterious protein of potyviruses, a relevant group of RNA viruses infecting plants. Our experiments showed that the viral P1 protein exclusively accumulates in infected cells at an early stage of infection and moves in and out of the nucleus of infected cells, particularly targeting the nucleolus. Our experiments also showed that P1 protein binds host ribosomes during infection. Based on these findings and other in vitro experiments we propose that P1 protein stimulates translation of viral proteins during infection.


Figures

FIG 1
FIG 1
Expression of P1 protein during TEV infectious cycle. (A) Schematic representation of recombinant TEV infectious clones: TEV-wt, TEV-VenusP1, TEV-GFP, and TEV-VenusP1-mCherryNIb and TEV-TSTP1. Lines represent viral 5′ and 3′ UTRs, and white boxes represent viral cistrons P1, HC-Pro, P3, 6K1, CI, 6K2, VPg, NIaPro, NIb, and CP, as indicated. P3N-PIPO is represented by white (P3N) and dashed (PIPO) boxes. Light green, dark green, and red boxes represent Venus, GFP, and mCherry cDNAs, as indicated. The blue box represents twin-Strep-tag (TST) cDNA. (B) Fluorescence images taken under a stereomicroscope of N. benthamiana leaves showing TEV-GFP and TEV-VenusP1 infection foci at 3 dpi. Scale bars correspond to 500 and 50 μm at low and high magnification, respectively. (C) Fluorescence images taken under a stereomicroscope of a TEV-VenusP1-mCherryNIb infection focus on an N. benthamiana leaf at 3 dpi. Scale bar, 50 μm. (D) Time course analysis of TEV TSTP1 and CP accumulation in the third leaf of N. benthamiana plants above the leaf agroinoculated with TEV-TSTP1. Samples taken at different days postinoculation (dpi), as indicated, were separated by SDS-PAGE and analyzed by Western blotting. (E) Plots of TEV TSTP1 and CP accumulation (measured by Western blot analysis in arbitrary units [au]) versus days postinoculation in the third leaf of N. benthamiana plants above the leaf agroinoculated with TEV-TSTP1. Bars indicate the standard deviations of the measures taken in triplicate plants.
FIG 2
FIG 2
N. benthamiana plants inoculated with various recombinant TEV clones. (A) Pictures taken at 8 dpi of representative N. benthamiana plants mock inoculated and inoculated with TEV-wt, TEV-VenusP1, TEV-GFP, TEV-VenusP1-mCherryNIb, and TEV-TSTP1, as indicated. (B) Analysis by RT-PCR of the viral progeny in plants infected by various recombinant TEV clones. Viral cDNAs were amplified by RT-PCR from RNA preparations from infected tissues at 10 dpi. Amplification products were analyzed by electrophoresis in 1% agarose gels, followed by ethidium bromide staining. Products of the upper and lower gels were amplified with primer pairs flanking the P1 (primer I, 5′-TTATTCGCATGCCTAAGGATTTCCC-3′; and primer II, 5′-AGGAACGCCTCTCTATTAAGTCGAC-3′) and the NIb (primer III, 5′-CTATTGCAGCAATTTAAATCATTTC-3′; and primer IV, 5′-CTCTTGCCATGGGTGAGCGCGCGAC-3′) cistrons, respectively. Lane 1, RT-PCR negative control; lanes 2 to 11, RT-PCR products from RNA preparations from tissues from individual plants infected by TEV-wt (lane 2), TEV-TSTP1 (lanes 3 to 5), TEV-VenusP1 (lanes 6 to 8), and TEV-VenusP1-mCherryNIb (lanes 9 to 11); lane 12, DNA marker ladder with the size (in kbp) of the components indicated on the right.
FIG 3
FIG 3
P1 and NIb subcellular localization during the TEV infectious cycle. (A) Schematic representation of an infection focus with cells (I to V) at different stages of infection. (B) Green and red fluorescence images taken under a confocal microscope of N. benthamiana leaf cells infected by TEV-VenusP1-mCherryNIb at 3 dpi. Rows I to V correspond to the positions of the cells in the infection focus, from the periphery to the epicenter. Each series includes the green and red fluorescence images at low and high magnifications and a merged image at high magnification. Scale bars correspond to 16 and 8 μm at low and high magnifications, respectively.
FIG 4
FIG 4
Colocalization of A. thaliana AtFib2 and AtRPL24B nucleolar marker proteins and P1 during TEV infection. N. benthamiana leaves were inoculated with TEV-VenusP1 virions and infiltrated with A. tumefaciens cultures to transitorily express AtFib2mRFP and AtRPL24BmCherry. Green and red fluorescence images were taken under a confocal microscope 3 days later. A merged image is also shown. (A) Transient expression of AtFib2mRFP in a cell infected by TEV-VenusP1. Arrows point to the nucleolus (No) and a Cajal body (CB). (B) Transient expression of AtRPL24B in a cell infected by TEV-VenusP1. (C) Schematic representation of a plant nucleolus for a better interpretation of results: nucleolar cavity (NC), fibrillar component (FC), dense fibrillar component (DFC), and granular component (GC). Scale bar, 8 μm.
FIG 5
FIG 5
Identification of a nucleolar localization signal (NoLS) and a nuclear export signal (NES) in TEV P1 sequence (GenBank accession number ABJ16044). (A) NoLS prediction per residue displayed by the NoD algorithm. (B) NES prediction in the 65 carboxy-terminal amino acids of TEV P1 displayed by the NetNES algorithm. HMM, hidden Markov model. (C) Amino acid sequence of TEV P1 with the predicted NoLS and NES underlined and highlighted over light and dark gray backgrounds, respectively.
FIG 6
FIG 6
Transient expression of Venus, VenusP1 and a series of VenusP1 mutants in N. benthamiana. Leaves were infiltrated with A. tumefaciens cultures to express the different constructs. (A) Schematic representation of the expressed constructs (I to X). The green and white boxes represent Venus and TEV P1 cDNAs, respectively. The gray and black boxes represent TEV P1 NoLS and NES, as indicated. The black arrow and hexagon represent the CaMV 35S promoter (P35S) and terminator (t35S), respectively. Black lines represent the Cowpea mosaic virus (CPMV) RNA-2 5′ and 3′ UTRs, as indicated. Mutations in NoLS and NES sequences are represented in red. (B) Green fluorescence images of selected cells taken under a confocal microscope at 3 days after infiltration with constructs I to X. Some cells were imaged at two different magnifications. Scale bars correspond to 20 and 8 μm at low and high magnifications, respectively.
FIG 7
FIG 7
Effect of mutations in the P1 cistron on TEV infectivity and accumulation. (A) Number of symptomatic N. benthamiana plants versus day postagroinoculation of wild-type (WT) and P1 mutant TEV clones including the Ros1 marker. (B) Viral load at 3 days after symptoms emerged, measured as anthocyanin accumulation (absorbance at 530 nm), in plants infected by wild-type and P1 mutant TEV clones including the Ros1 marker. Error bars indicate the standard deviations of the three sampled plants. Wild-type and mutant P1 (Mt-VII, Mt-VIII, Mt-IX, Mt-X, Mt-X+NIaPro, Mt-H214A, and Mt-H214A+NIaPro) sequences are shown in Fig. S3 in the supplemental material.
FIG 8
FIG 8
Identification of host proteins physically associated to P1 during TEV infection. TSTP1 was purified from N. benthamiana tissues infected with TEV-TSTP1 by liquid chromatography using a Strep-Tactin column under native conditions. (A) Proteins eluting from the column were precipitated, separated by SDS-PAGE, and the gel stained with Coomassie blue. Lane 1, protein standards with their molecular masses in kDa on the left; lane 2, negative control of proteins purified from tissues infected by TEV-wt; lane 3, proteins purified from tissues infected by TEV-TSTP1. The lower panel corresponds to Western blot analysis using an anti-TST antibody. (B, C, and D) Fractionation of polysomal preparations from N. benthamiana tissues infected by TEV-TSTP1 (B and C) or TEV-TSTP1 (mutant Mt-IX) (D). A polysomal preparation from tissue infected with TEV-TSTP1 was nontreated (B) or treated with EDTA (C) and subjected to centrifugation in sucrose gradients. The fractionated gradient profiles were obtained by measuring the optical density of the different fractions at 254 nm. Ribosomal 18S and 28S RNAs were detected in the fractions of the gradients by agarose electrophoresis and staining with ethidium bromide. The presence of TSTP1 was revealed by SDS-PAGE separation and Western blot analysis. The positions of the 80S ribosomes and the 60S and 40S ribosomal subunits are indicated in the profile. The positions of the viral TSTP1 and the ribosomal 28S and 18S RNAs are indicated. (D) Two independent polysomal preparations from tissues infected with TEV-TSTP1 (Mt-IX) were treated with EDTA and fractionated by centrifugation in sucrose gradients. Ribosomal RNAs and TSTP1 (Mt-IX) were detected as indicated for panels B and C. Lanes 1 to 3, crude extracts from a noninoculated plant and two independent plants infected with TEV-TSTP1 (Mt-IX), respectively; lanes 4 and 5, high-speed sediments previous to fractionation from both infected tissues; lanes 6 to 9, peak fractions with the ribosomal 40S (lanes 6 and 8) and 60S (lanes 7 and 9) subunits for both infected samples. The positions of the viral TSTP1 (Mt-IX) and the ribosomal 28S and 18S RNAs are indicated.
FIG 9
FIG 9
Effect of TEV P1 on in vitro translation of reporter systems. (A) Schematic representation of the monocistronic and bicistronic reporter cassettes and the cassettes to express firefly luciferase (Fluc), a truncated form of TEV P1 (ΔP1; 155 initial amino acids), P1, HC-Pro and the P1–HC-Pro polyprotein. The black and gray rectangles represent the SP6 bacteriophage promoter and the poly(A) tail, respectively. Light and dark gray boxes represent Fluc and hemagglutinin-tagged Venus cDNAs, respectively. White boxes represent cDNAs corresponding to ΔP1 (the nontranslated part due to an in-frame insertion of three stop codons inserted in frame is indicated in a dashed box), P1, and HC-Pro, as indicated. Black lines represent the CPMV RNA-2 5′ and 3′ UTRs, as indicated. The TEV 5′ UTR is represented by a black rectangle, as indicated. (B) Production of Venus in in vitro translation reactions in which Fluc, TEV ΔP1, P1, HC-Pro, and P1–HC-Pro were cotranslationally produced. In vitro translation products in the presence of [35S]Met were separated by SDS-PAGE and quantified by phosphorimager analysis. Venus amounts were normalized by those obtained in the reaction cotranslating Fluc. (C) Production of upstream Fluc (light gray bars) and downstream Venus (dark gray bars) in in vitro translation reactions in which TEV ΔP1, P1, HC-Pro, and P1–HC-Pro were cotranslationally produced. The Fluc and Venus amounts were normalized by those obtained in the reaction cotranslating TEV ΔP1. In panels B and C, error bars indicate the standard deviations in three independent experiments, and the different letters over the columns indicate a significant statistical difference (least significant difference [LSD] test, P < 0.05). (D and E) Analysis of proteins and reporter mRNA produced during the coupled in vitro transcription-translation experiment. Two aliquots of the coupled in vitro transcription-translation reaction products were taken at 40 min for protein and reporter mRNA analysis. (D) Proteins were separated by PAGE (12.5% polyacrylamide, 0.05% SDS), the gel was dried, and the proteins were visualized by autoradiography. (E) RNAs were separated by electrophoresis in an agarose gel under denaturing conditions and electroblotted to a positively charged nylon membrane, and the Venus mRNA was detected with a cRNA probe labeled with 32P. Reactions were programmed to produce Venus reporter and Fluc (lane 1), TEV P1 (lane 2), a truncated form of TEV P1 (ΔP1, lane 3), TEV HC-Pro (lane 4), or the P1–HC-Pro polyprotein (lane 5). The positions of the different proteins are indicated on the left and right of panel D. Note that the P1–HC-Pro polyprotein partially self-cleaves during the reaction. The position of the Venus reporter mRNA is indicated on the right of panel E.

Similar articles

Cited by

References

    1. Riechmann JL, Laín S, García JA. 1992. Highlights and prospects of potyvirus molecular biology. J. Gen. Virol. 73:1–16. 10.1099/0022-1317-73-1-1 - DOI - PubMed
    1. Chung BYW, Miller WA, Atkins JF, Firth AE. 2008. An overlapping essential gene in the Potyviridae. Proc. Natl. Acad. Sci. U. S. A. 105:5897–5902. 10.1073/pnas.0800468105 - DOI - PMC - PubMed
    1. Urcuqui-Inchima S, Haenni AL, Bernardi F. 2001. Potyvirus proteins: a wealth of functions. Virus Res. 74:157–175. 10.1016/S0168-1702(01)00220-9 - DOI - PubMed
    1. Kasschau KD, Carrington JC. 1998. A counterdefensive strategy of plant viruses: suppression of posttranscriptional gene silencing. Cell 95:461–470. 10.1016/S0092-8674(00)81614-1 - DOI - PubMed
    1. Guo B, Lin J, Ye K. 2011. Structure of the autocatalytic cysteine protease domain of potyvirus helper-component proteinase. J. Biol. Chem. 286:21937–21943. 10.1074/jbc.M111.230706 - DOI - PMC - PubMed

Publication types