. 2014 Jun 9;6(3):32.
doi: 10.1186/alzrt262. eCollection 2014.

β-amyloid deposition is shifted to the vasculature and memory impairment is exacerbated when hyperhomocysteinemia is induced in APP/PS1 transgenic mice

Affiliations

β-amyloid deposition is shifted to the vasculature and memory impairment is exacerbated when hyperhomocysteinemia is induced in APP/PS1 transgenic mice

Tiffany L Sudduth et al. Alzheimers Res Ther. .

Abstract

Introduction: Vascular dementia is the second most common cause of dementia after Alzheimer's disease (AD). In addition, it is estimated that almost half of all AD patients have significant cerebrovascular disease comorbid with their AD pathology. We hypothesized that cerebrovascular disease significantly impacts AD pathological progression.

Methods: We used a dietary model of cerebrovascular disease that relies on the induction of hyperhomocysteinemia (HHcy). HHcy is a significant clinical risk factor for stroke, cardiovascular disease and type 2 diabetes. In the present study, we induced HHcy in APP/PS1 transgenic mice.

Results: While total β-amyloid (Aβ) load is unchanged across groups, Congophilic amyloid deposition was decreased in the parenchyma and significantly increased in the vasculature as cerebral amyloid angiopathy (CAA; vascular amyloid deposition) in HHcy APP/PS1 mice. We also found that HHcy induced more microhemorrhages in the APP/PS1 mice than in the wild-type mice and that it switched the neuroinflammatory phenotype from an M2a biased state to an M1 biased state. Associated with these changes was an induction of the matrix metalloproteinase protein 2 (MMP2) and MMP9 systems. Interestingly, after 6 months of HHcy, the APP/PS1 mice were cognitively worse than wild-type HHcy mice or APP/PS1 mice, indicative of an additive effect of the cerebrovascular pathology and amyloid deposition.

Conclusions: These data show that cerebrovascular disease can significantly impact Aβ distribution in the brain, favoring vascular deposition. We predict that the presence of cerebrovascular disease with AD will have a significant impact on AD progression and the efficacy of therapeutics.


Figures
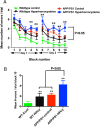
Figure 1
Figure 1
Cognitive deficits are additive when hyperhomocysteinemia is induced in APP/PS1 transgenic mice. (A) Two-day radial arm water maze data are graphed. The mean number of errors per trial were calculated for blocks 1 to 10 (each block comprised three trials). Asterisks indicate significant differences for hyperhomocysteinemia (HHcy) wild-type (WT) mice (n = 16), APP/PS1 control mice (n = 20) and HHcy APP/PS1 mice (n = 20) compared to WT control mice (n = 16). **P < 0.01. (B) Final block data only are graphed (block 10). Asterisks indicate significance compared to WT controls. **P < 0.01.
Figure 2
Figure 2
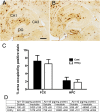
Total β-amyloid is unaltered by hyperhomocysteinemia in APP/PS1 transgenic mice. Total β-amyloid (Aβ) immunohistochemistry in the hippocampus of APP/PS1 mice on either the control diet (A) or the hyperhomocysteinemia (HHcy) diet (B). (A) shows the CA1, CA3 and dentate gyrus (DG) for orientation. Original magnification = 40×. Scale = 120 μm. (C) Quantification of percent area occupied by positive staining for Aβ in the hippocampus (HPC) and frontal cortex (FCX) of APP/PS1 transgenic mice fed either the control diet (n = 20, black bars) or the HHcy diet (n = 20, white bars). Error bars show SEM. (D) Biochemical quantification of Aβ1–38, Aβ1–40 and Aβ1–42 in both the soluble and insoluble protein extracts ± SEM.
Figure 3
Figure 3
Amyloid is redistributed to the vasculature in the hyperhomocysteinemia APP/PS1 transgenic mice. Congo red staining in the hippocampi of APP/PS1 mice fed the control diet (A) or the hyperhomocysteinemia (HHcy) diet (B). (A) shows the CA1, CA3 and dentate gyrus (DG) for orientation. Scale bar = 120 μm for (A) and (B). (C) Quantification of percent area occupied by positive Congo red staining in the hippocampus and frontal cortex of APP/PS1 transgenic mice on either control (Cont) diet (n = 20, black bars) or the HHcy diet (n = 20, white bars). Each graph shows total Congo red, parenchymal Congo red and cerebral amyloid angiopathy (CAA) Congo red. **P < 0.01 compared to APP/PS1 control. Error bars show SEM.
Figure 4
Figure 4
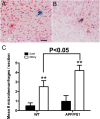
Microhemorrhages are increased by hyperhomocysteinemia in both wild-type and APP/PS1 transgenic mice. (A) and (B) Prussian blue–positive microhemorrhages in the cerebral cortices of APP/PS1 mice fed the hyperhomocysteinemia (HHcy) diet. Both images were obtained at 200× original magnification with a neutral red background stain. Scale bar = 25 μm. (C) Mean number of microhemorrhages per section for wild-type (WT) and APP/PS1 transgenic mice fed the control (n = 16 for WT mice and n = 20 for APP/PS1 mice, black bars) and the HHcy diet (n = 16 for WT mice and n = 20 for APP/PS1 mice, white bars). **P < 0.01 compared to the control group for the given genotype. Error bars show SEM.
Figure 5
Figure 5
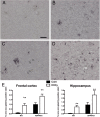
CD45 expression by microglial cells is increased by hyperhomocysteinemia in both wild-type and APP/PS1 mice. CD45 immunohistochemical staining in the frontal cortices of wild-type (WT) mice fed the control diet (A) or the hyperhomocysteinemia (HHcy) diet (B) and APP/PS1 mice fed the control diet (C) or the HHcy diet (D). Original magnification = 200×. Scale bar = 25 μm. (E) Quantification of percent area occupied by positive CD45 immunoreactivity in the frontal cortex and hippocampus of WT and APP/PS1 mice on both control (n = 16 for WT and n = 20 for APP/PS1, black bars) and HHcy diet (n = 16 for WT and n = 20 for APP/PS1, white bars). **P < 0.01 compared to the control group for a given genotype. Error bars show SEM.
Figure 6
Figure 6
Hyperhomocysteinemia induces an inflammatory phenotype shift in the APP/PS1 transgenic mice away from M2a and toward M1. The graph shows fold changes for each gene relative to the wild-type control mice. The dashed line at 1 indicates the normal wild-type expression of these genes. IL, Interleukin; TNF, Tumor necrosis factor; IL1rn, Interleukin 1 receptor antagonist; Arg1, Arginase type 1; TGF, Transforming growth factor; FcgR1, Fc gamma receptor 1 *P < 0.05, **P < 0.01 compared to APP/PS1 control (n = 16 for each wild-type group and n = 20 for each APP/PS1 group). Error bars show SEM.
Figure 7
Figure 7
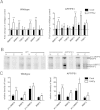
Matrix metalloproteinases 2 and 9 are activated by hyperhomocysteinemia in wild-type and APP/PS1 transgenic mice. (A) Graphed quantitative RT-PCR results for components of the matrix metalloproteinases 2 and 9 (MMP2 and MMP9) systems in both the wild-type (WT) and APP/PS1 mice. TIMP, Tissue inhibitor of metalloproteinase. **P < 0.01 compared to control (Cont) for the given genotype. (B) Gelatin zymogram color-inverted to highlight the digested bands in black. As indicated to the right, on the basis of molecular weight, we can determine that the bands highlighted correspond to pro-MMP9, MMP9, pro-MMP2 and MMP2. H, Hyperhomocysteinemia (HHcy) mice; C, control mice. (C) Quantification of band density for bands of interest highlighted in (B) for wild-type and control mice. *P < 0.05, **P < 0.01 compared to the control group for the given genotype (n = 16 for each wild-type group and n = 20 for each APP/PS1 group). Error bars show SEM.

Similar articles

Cited by

References

    1. Gorelick PB, Scuteri A, Black SE, DeCarli C, Greenberg SM, Iadecola C, Launer LJ, Laurent S, Lopez OL, Nyenhuis D, Petersen RC, Schneider JA, Tzourio C, Arnett DK, Bennett DA, Chui HC, Higashida RT, Lindquist R, Nilsson PM, Roman GC, Sellke FW, Seshadri S. on behalf of the American Heart Association Stroke Council, Council on Epidemiology and Prevention, Council on Cardiovascular Nursing, Council on Cardiovascular Radiology and Intervention, and Council on Cardiovascular Surgery and Anesthesia. Vascular contributions to cognitive impairment and dementia: a statement for healthcare professionals from the American Heart Association/American Stroke Association. Stroke. 2011;42:2672–2713. - PMC - PubMed
    1. Bowler JV, Munoz DG, Merskey H, Hachinski V. Fallacies in the pathological confirmation of the diagnosis of Alzheimer’s disease. J Neurol Neurosurg Psychiatry. 1998;64:18–24. - PMC - PubMed
    1. Zekry D, Hauw JJ, Gold G. Mixed dementia: epidemiology, diagnosis, and treatment. J Am Geriatr Soc. 2002;50:1431–1438. - PubMed
    1. Langa KM, Foster NL, Larson EB. Mixed dementia: emerging concepts and therapeutic implications. JAMA. 2004;292:2901–2908. - PubMed
    1. Sudduth TL, Powell DK, Smith CD, Greenstein A, Wilcock DM. Induction of hyperhomocysteinemia models vascular dementia by induction of cerebral microhemorrhages and neuroinflammation. J Cereb Blood Flow Metab. 2013;33:708–715. - PMC - PubMed

LinkOut - more resources