. 2014 Jul 3;10(7):e1004189.
doi: 10.1371/journal.ppat.1004189. eCollection 2014 Jul.

Tetherin can restrict cell-free and cell-cell transmission of HIV from primary macrophages to T cells

Affiliations

Tetherin can restrict cell-free and cell-cell transmission of HIV from primary macrophages to T cells

Sebastian Giese et al. PLoS Pathog. .

Abstract

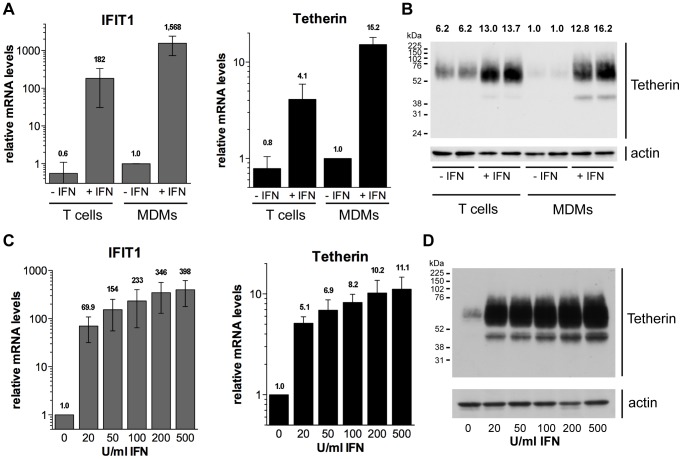
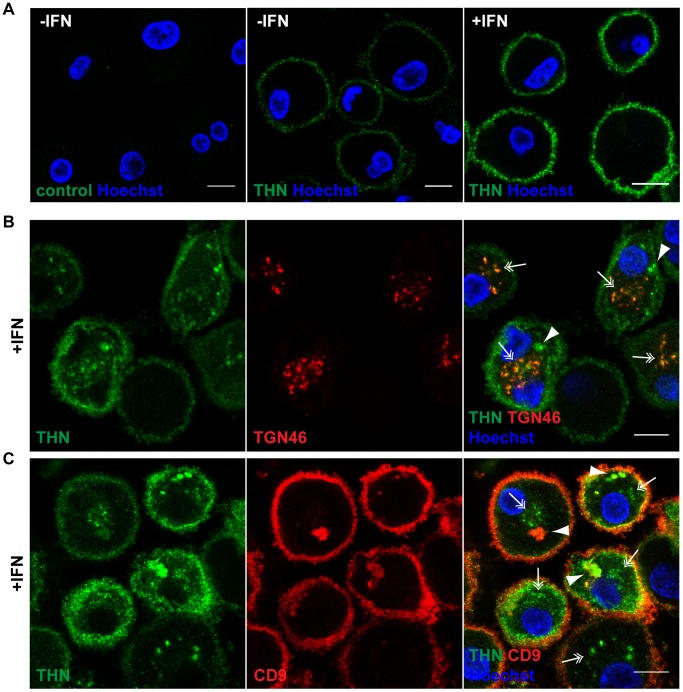
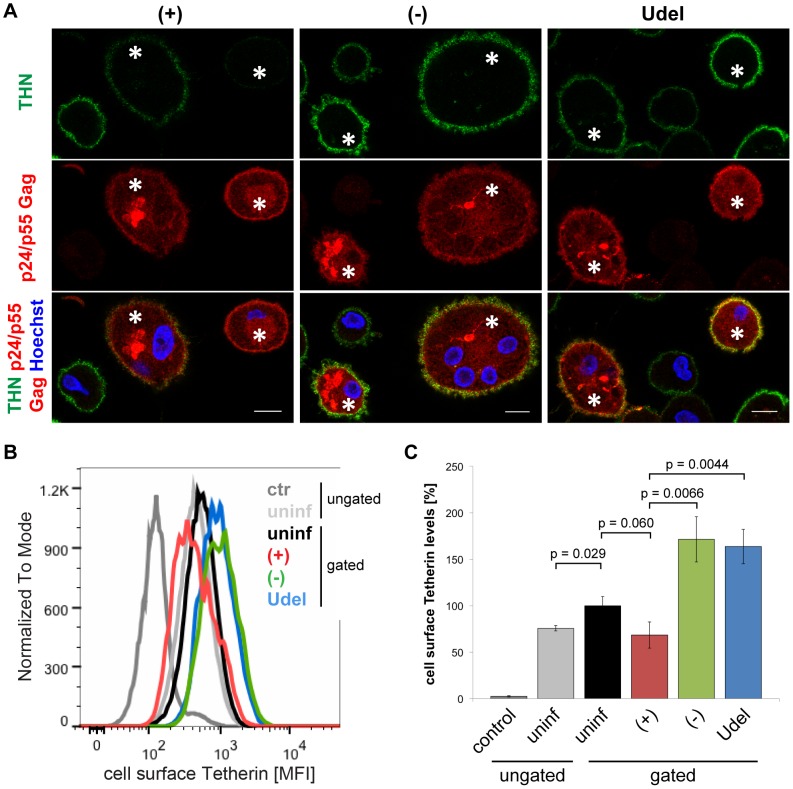
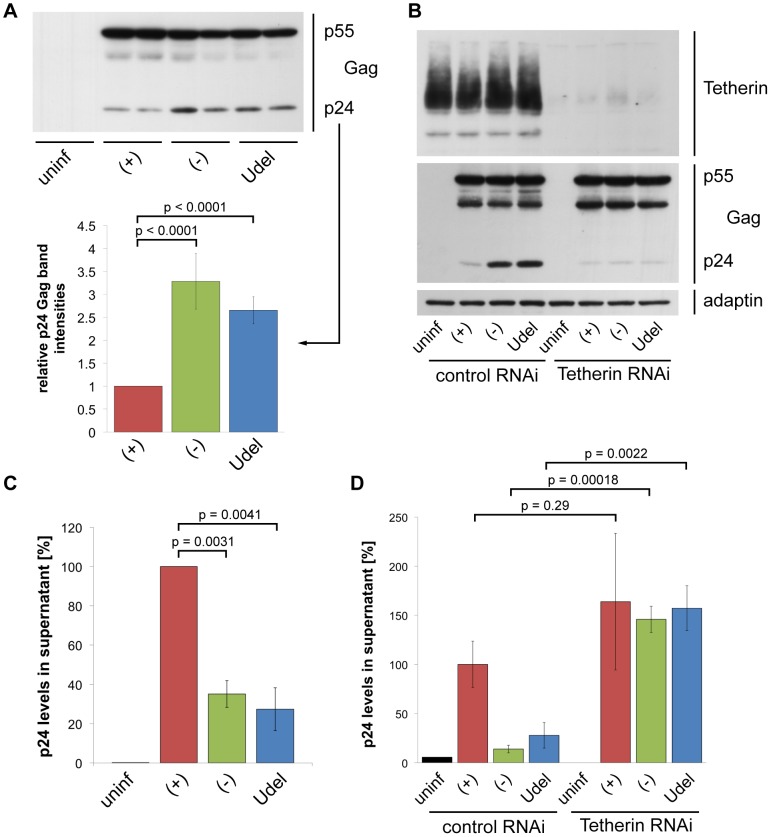
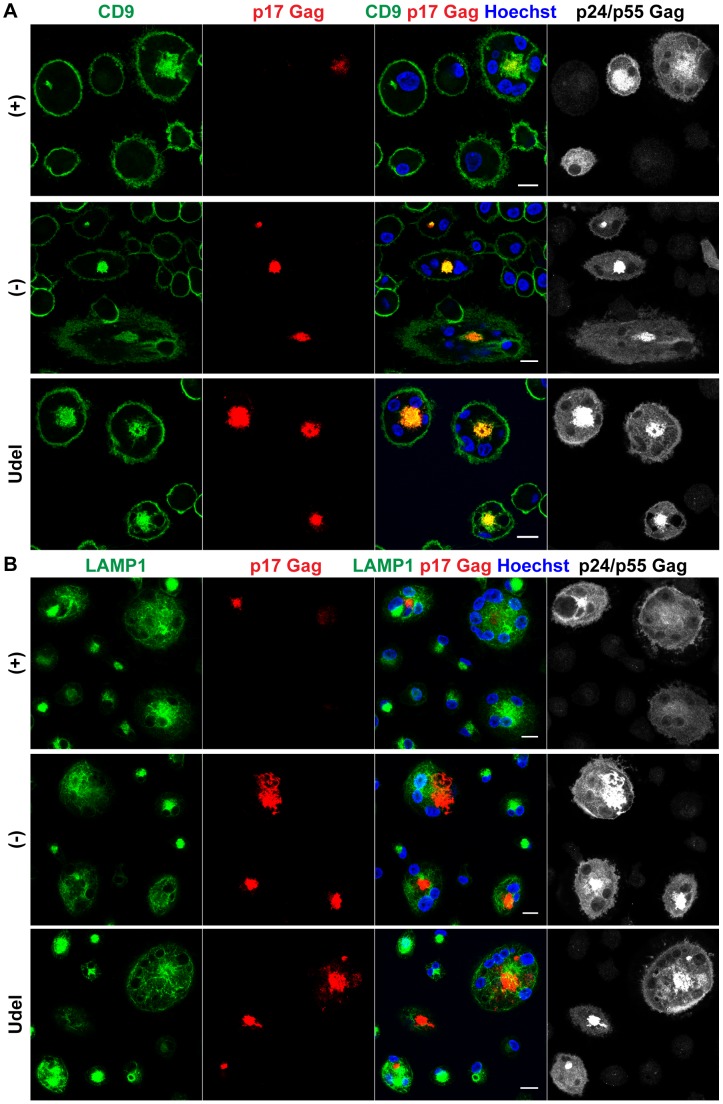
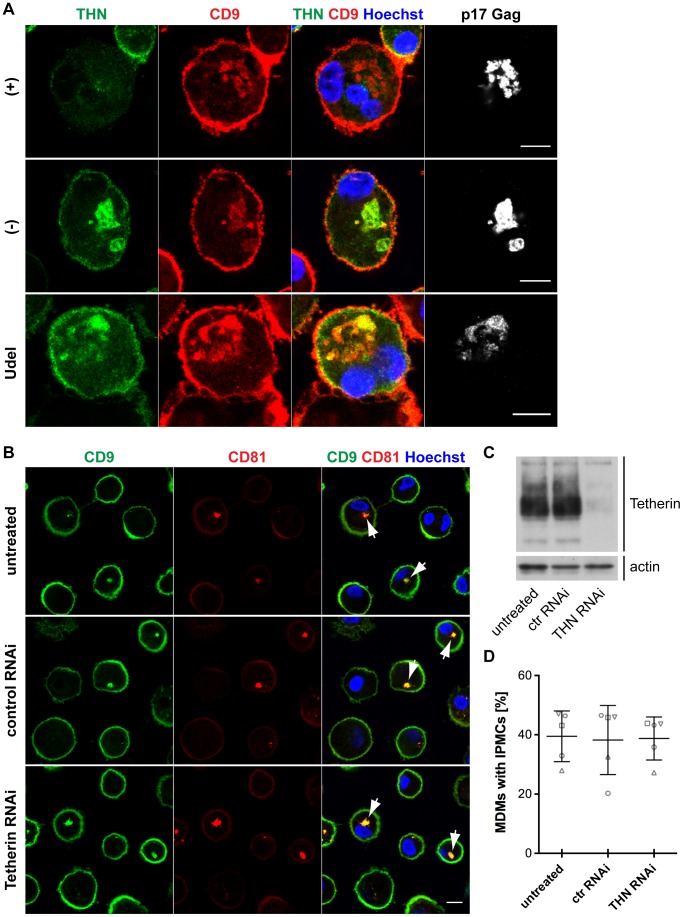
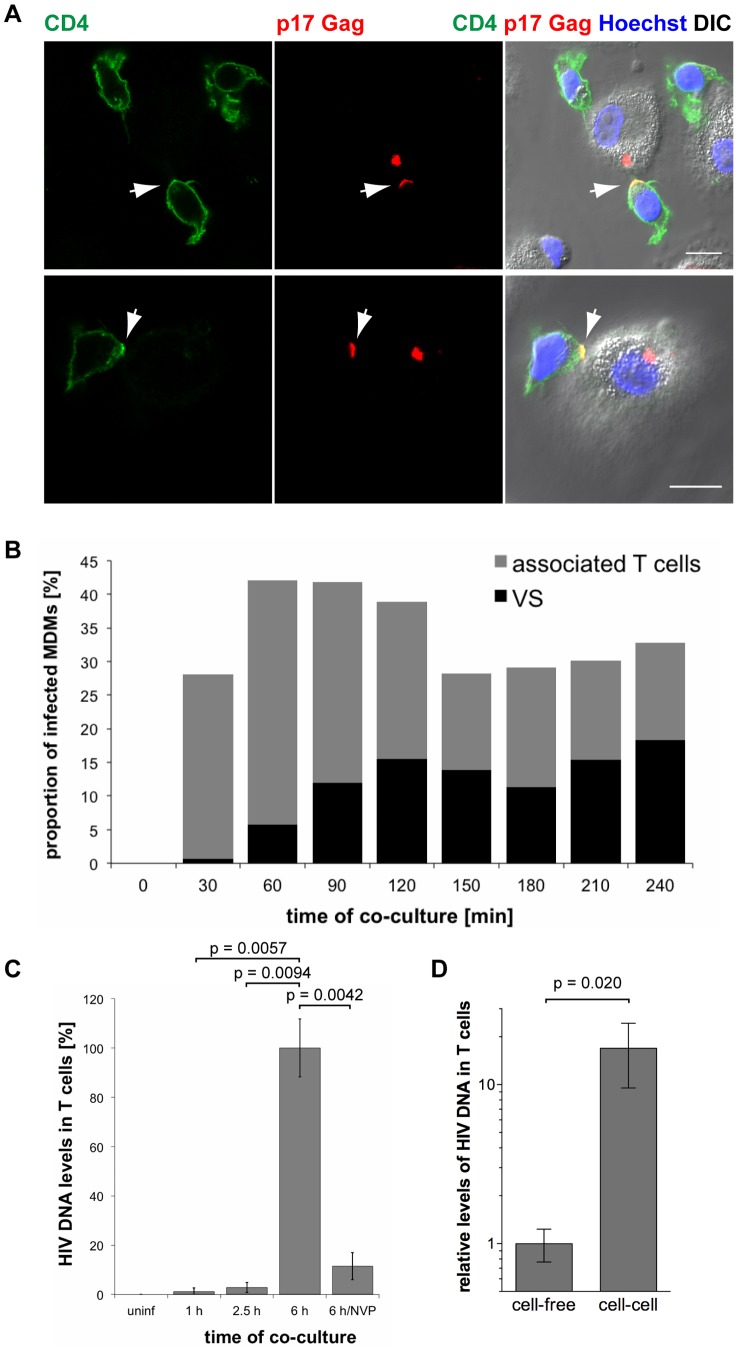
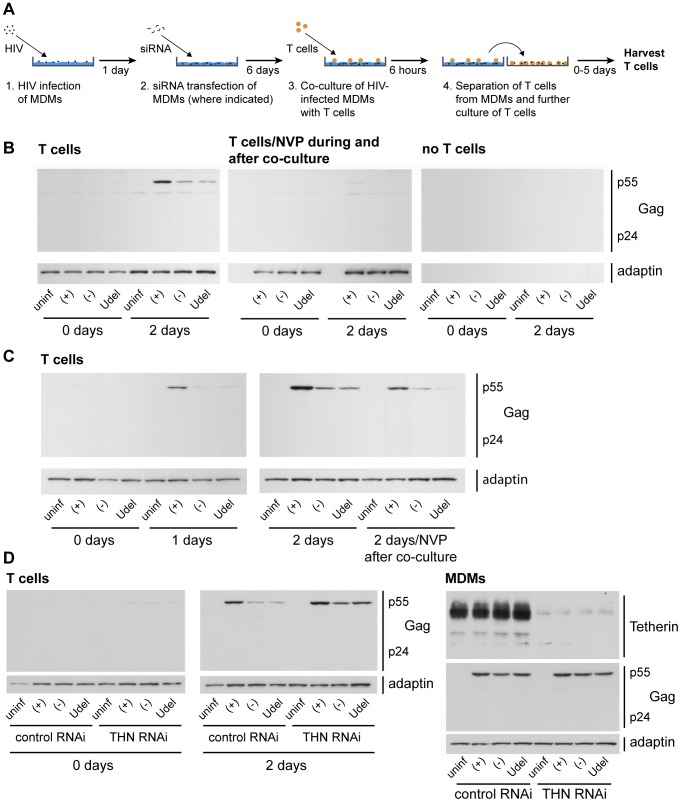
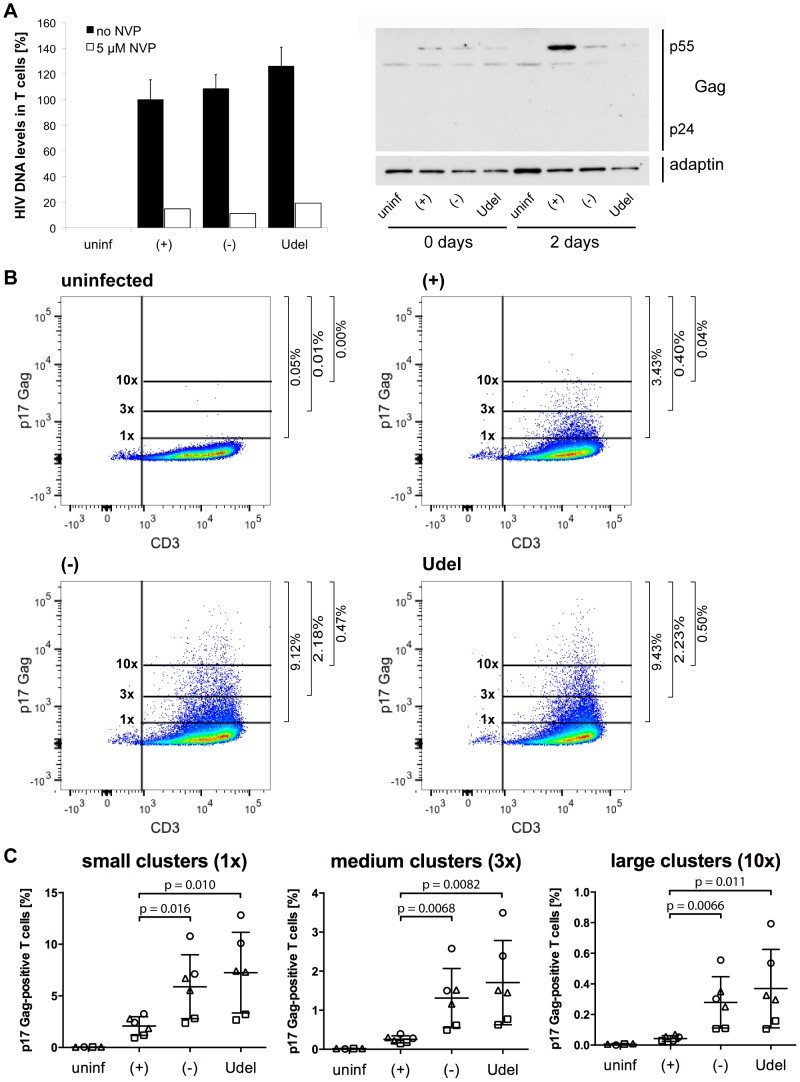
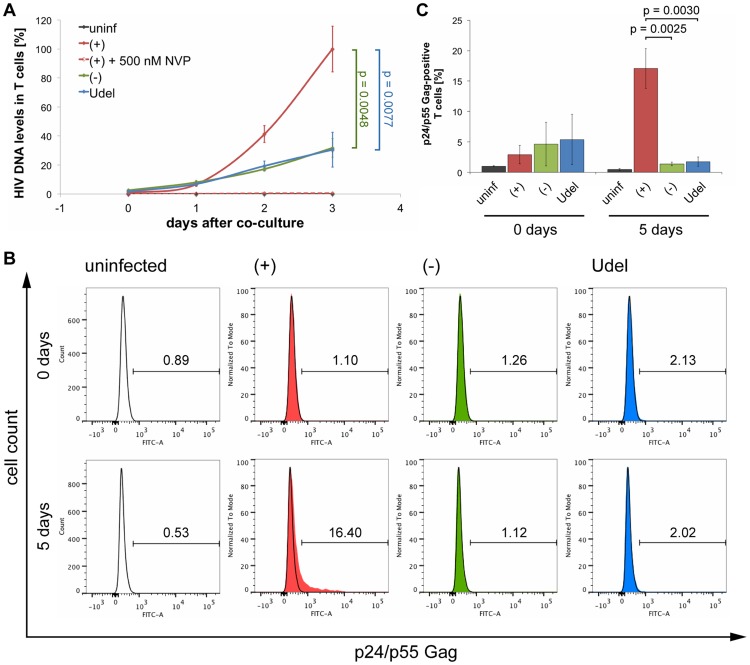
Bst-2/Tetherin inhibits the release of HIV by tethering newly formed virus particles to the plasma membrane of infected cells. Although the mechanisms of Tetherin-mediated restriction are increasingly well understood, the biological relevance of this restriction in the natural target cells of HIV is unclear. Moreover, whether Tetherin exerts any restriction on the direct cell-cell spread of HIV across intercellular contacts remains controversial. Here we analyse the restriction endogenous Tetherin imposes on HIV transmission from primary human macrophages, one of the main targets of HIV in vivo. We find that the mRNA and protein levels of Tetherin in macrophages are comparable to those in T cells from the same donors, and are highly upregulated by type I interferons. Improved immunocytochemistry protocols enable us to demonstrate that Tetherin localises to the cell surface, the trans-Golgi network, and the macrophage HIV assembly compartments. Tetherin retains budded virions in the assembly compartments, thereby impeding the release and cell-free spread of HIV, but it is not required for the maintenance of these compartments per se. Notably, using a novel assay to quantify cell-cell spread, we show that Tetherin promotes the transfer of virus clusters from macrophages to T cells and thereby restricts the direct transmission of a dual-tropic HIV-1. Kinetic analyses provide support for the notion that this direct macrophage-T cell spread is mediated, at least in part, by so-called virological synapses. Finally, we demonstrate that the viral Vpu protein efficiently downregulates the cell surface and overall levels of Tetherin, and thereby abrogates this HIV restriction in macrophages. Together, our study shows that Tetherin, one of the most potent HIV restriction factors identified to date, can inhibit virus spread from primary macrophages, regardless of the mode of transmission.


Conflict of interest statement

The authors have declared that no competing interests exist.

Figures

Figure 1
Figure 1. Type I interferons upregulate Tetherin expression in primary macrophages.
(A–B) Primary MDMs and autologous lectin/IL-2-activated CD4+ T cells were stimulated for 24 h with 544 U/ml (2 ng/ml) IFN-β eight days post isolation from buffy coats. (A) IFIT1 and Tetherin mRNA levels were determined by RT-qPCR and normalised to GAPDH. Bars represent the means ± standard deviations (SD) from four donors relative to untreated MDMs (−IFN, set at 1). (B) Tetherin protein levels were determined by western blot analysis of whole cell lysates containing equal amounts of total protein. Numbers above each lane indicate the Tetherin band intensities relative to untreated MDMs (−IFN, set at 1). (C–D) MDMs were stimulated for 24 h with 0–500 U/ml IFN-β eight days post isolation from buffy coats. (C) mRNA levels were determined as described for (A). Bars represent the means ± SD from three donors relative to untreated MDMs (set at 1). (D) Tetherin protein levels were determined by western blot analysis of whole cell lysates.
Figure 2
Figure 2. Tetherin localises to the cell surface, TGN, and IPMCs.
(A) Untreated MDMs (−IFN), or MDMs treated for 24 h with 544 U/ml IFN-β (+IFN), were incubated for 1 h on ice in media containing 10 µg/ml polyclonal Tetherin (THN) antibody (B02P), or VSV-G antibody as a negative control. Cells were fixed and labelled with a fluorescent secondary antibody. (B–C) IFN-β-treated MDMs were incubated for 20 min on ice with 10 µg/ml polyclonal Tetherin antibody (B02P) and 2.5 µg/ml anti-TGN46, or with 10 µg/ml monoclonal Tetherin antibody (M15) and 2 µg/ml anti-CD9, in the presence of 0.05% saponin. Cells were fixed and labelled with fluorescent secondary antibodies. Arrowheads point at structures reminiscent of IPMCs, double arrows indicate TGN-like staining patterns. All images are single confocal sections. Scale bars = 10 µm.
Figure 3
Figure 3. Vpu efficiently antagonises Tetherin in MDMs.
(A) Schematic representation of the R3A molecular clones used in this study. R3A-(+) expresses a Vpu protein, R3A-(−) and -Udel do not. (B) MDMs were infected with R3A-(+), -(−), or -Udel for seven days, lysed, and analysed by western blotting. The Tetherin band intensities were quantified and normalised to the γ-adaptin levels, respectively. Bars represent the means ± SD of duplicate samples from three donors relative to R3A-(+) (set at 1). (C) Cell-free culture supernatants from R3A-infected MDMs were collected, p24 Gag levels adjusted, and single-cycle infectivities determined using TZM-bl cells. Bars represent the means ± SD of triplicate samples from four donors relative to R3A-(+) (set at 100%).
Figure 4
Figure 4. Vpu antagonises cell surface Tetherin in MDMs.
(A) R3A-infected MDMs were incubated for 1 h on ice in media containing 10 µg/ml polyclonal Tetherin (THN) antibody (B02P). Cells were fixed, permeabilised, labelled with a p24/p55 Gag antiserum, and stained with fluorescent secondary antibodies. Asterisks mark infected cells. Single confocal sections are shown. Scale bars = 10 µm. (B–C) Cell surface Tetherin on uninfected and R3A-infected MDMs was labelled as described for (A), uninfected MDMs were incubated with VSV-G antibody as a negative control, and all cells were analysed by flow cytometry. Uninfected cell populations were left ungated, infected cell populations gated on the uninfected or infected subpopulations. (B) shows the results of a representative experiment, the bars in (C) represent the average Tetherin mean fluorescence intensities (MFI) ± SD from three donors relative to the gated, uninfected subpopulations (set at 100%).
Figure 5
Figure 5. Tetherin retains HIV on infected MDMs.
(A) MDMs were infected with R3A-(+), -(−), or -Udel for seven days, lysed, and analysed by western blotting. Note that the γ-adaptin blot from this donor is shown in Fig. 3B. The p24 Gag band intensities were quantified and normalised to the p55 Gag levels. Bars represent the means ± SD of duplicate samples from three donors relative to R3A-(+) (set at 1). (B) MDMs were infected with R3A and transfected with control or Tetherin siRNA the next day. Cells were lysed six days later and analysed by western blotting. (C) p24 Gag concentrations in cell-free culture supernatants from R3A-infected MDMs were determined using ELISAs. Bars represent the means ± SD of triplicate samples from three donors relative to R3A-(+) (set at 100%). p values were calculated using a paired Student's t-test before normalisation. (D) p24 Gag concentrations in cell-free culture supernatants from R3A-infected, siRNA-treated MDMs were determined using ELISAs. Bars represent the means ± SD of triplicate samples from a representative experiment, relative to control RNAi/R3A-(+) (set at 100%).
Figure 6
Figure 6. In the absence of Vpu, HIV accumulates in IPMCs.
(A–B) MDMs were infected with R3A-(+),-(−), or -Udel for seven days, fixed, and immunostained for the indicated proteins. Single confocal sections are shown. Scale bars = 15 µm.
Figure 7
Figure 7. Tetherin is not required to maintain IPMCs.
(A) IFN-β-treated MDMs were incubated for 20 min on ice with 10 µg/ml monoclonal Tetherin antibody (M15) and 2 µg/ml anti-CD9 in the presence of 0.05% saponin. Cells were fixed, labelled with anti-HIV-1 p17 Gag, and immunostained with fluorescent secondary antibodies in the presence of 0.1% Triton X-100. Scale bars = 10 µm. (B) MDMs were left untreated, or transfected with Tetherin or control siRNA for seven days. All cells were fixed and immunostained for CD9 and CD81. Arrowheads point at examples of structures identified as IPMCs. All images are single confocal sections. Scale bar = 10 µm. (C) Parallel cultures to the ones shown in (B) were lysed seven days after siRNA treatment and analysed by western blotting. (D) MDMs were treated as described for (B), and the proportion of cells showing any intracellular CD9/CD81 co-localisation was quantified on nine random confocal stacks for each condition. Between 255 and 407 cells were counted for each data point. The graphs show the means ± SD from five donors, and each donor is represented by differently shaped data points.
Figure 8
Figure 8. HIV is transmitted from MDMs to T cells via virological synapses.
(A) MDMs were infected with HIV-1 BaL for seven days, co-cultured with autologous CD4+ T cells for 2.5 h, fixed and immunostained for the indicated proteins. Arrows indicate VS. Scale bars = 10 µm. (B) BaL-infected MDMs were co-cultured with autologous T cells for the indicated times, fixed, and immunostained for p17 Gag and CD4. No T cells were added to a control sample of MDMs (0 min). The proportion of infected MDMs that associated with T cells (black+grey bars), and formed VS (black bars) was counted on seven random confocal images with a total of 146–208 infected MDMs for each time point. (C) BaL-infected MDMs were co-cultured with autologous T cells for the indicated times, the T cells were washed off the MDMs, and Gag DNA levels in the T cells were quantified by qPCR. As controls, T cells were incubated for 6 h with uninfected MDMs (uninf), or with infected MDMs in the presence of 500 nM NVP (6 h/NVP). (D) Autologous CD4+ T cells were incubated for 6 h with BaL-infected MDMs, or with cell-free supernatants collected from the same MDMs during the preceding 6 h period. All T cells were collected and Gag DNA levels in the T cells quantified by qPCR. (C–D) Gag DNA levels were normalised to GAPDH. For cell-cell transmission experiments, the levels of contaminating MDM-derived Gag and GAPDH DNA were subtracted from the total DNA levels. Graphs show the means ± SD of triplicate samples from a representative experiment relative to 6 h (set at 100%), or cell-free (set at 1).
Figure 9
Figure 9. Tetherin restricts cell-cell transmission of a dual-tropic HIV-1 from MDMs to T cells.
(A) Schematic outline of the assay used to quantify cell-cell transmission from MDMs to autologous CD4+ T cells. (B) R3A-(+), -(−), or -Udel-infected MDMs, or uninfected control MDMs, were co-cultured with autologous CD4+ T cells for 6 h, the T cells were washed off the MDMs with PBS and lysed immediately (0 days), or after another two day-incubation (2 days). As a control, 500 nM NVP was added to parallel MDM-T cell co-cultures, and to the T cells after the co-culture (T cells/NVP during and after co-culture). No T cells were added to infected MDMs, and the culture supernatants treated as the T cells, as another control (no T cells). All T cell lysates were analysed by western blotting. (C) T cells were co-cultured with R3A-infected MDM for 6 h, separated from the MDMs, and incubated for another zero to two days (0–2 days), or for two days in the presence of 500 nM NVP (2 days/NVP after co-culture). The T cells were lysed and analysed by western blotting. Note that parallel cultures of the MDMs used for the experiments in (B) and (C) were analysed by western blotting to confirm equal infection levels (Fig. S11). (D) MDMs were infected with R3A and transfected with control (control RNAi) or Tetherin (Tetherin RNAi) siRNA the next day. Six days later, autologous T cells were co-cultured with the infected MDMs for 6 h, separated from the MDMs, and lysed immediately (0 days) or incubated for another two days in the presence of 500 nM NVP (2 days). The T cell lysates (T cells), and lysates of the MDMs (MDMs) used for the experiment, were analysed by western blotting. Note that residual Tetherin levels in the MDMs had to be <5% to see a rescue of the T cell infection with R3A-(−) and -Udel.
Figure 10
Figure 10. Tetherin promotes the transfer of infectious HIV clusters to T cells.
(A) R3A-(+), -(−), or -Udel-infected MDMs, or uninfected control MDMs, were co-cultured with autologous CD4+ T cells for 6 h. As a control, 5 µM NVP was added to parallel MDM-T cell co-cultures. All T cells were separated from the MDMs, and aliquoted for qPCR and western blot analyses. For qPCR analysis, T cells were lysed immediately, and Gag DNA levels quantified by qPCR and normalised to GAPDH. The levels of contaminating MDM-derived Gag and GAPDH DNA were subtracted from the total DNA levels. Graphs for the “no NVP” samples show the means ± SD of triplicate samples from a representative experiment relative to R3A-(+) (set at 100%). Single values are shown for the “5 µM NVP” samples. For western blot analyses, T cells were lysed immediately (0 days), or after another two day-incubation (2 days). (B–C) T cells were co-cultured with R3A-infected MDMs for 6 h, separated from the MDMs, fixed, immunostained for p17 Gag and CD3, and analysed by flow cytometry. (B) shows the results of a representative experiment, and the numbers next to the gates indicate the proportions of cells with small (1×), medium (3×), and large (10×) p17 Gag clusters. (C) shows the mean proportions of cells with small (1×), medium (3×), and large (10×) p17 Gag clusters ± SD of duplicate samples from three donors, normalised to the MDM infection levels. Each donor is represented by differently shaped data points.
Figure 11
Figure 11. Tetherin can prevent MDMs from initiating a spreading infection in T cells.
(A) R3A-(+), -(−), or -Udel-infected MDMs, or uninfected control MDMs, were co-cultured with autologous CD4+ T cells for 6 h, the T cells separated from the MDMs and lysed immediately (0 days), or after another one to three day-incubation (1–3 days). Gag DNA levels in the T cells were quantified by qPCR and normalised to GAPDH. As a control, 500 nM NVP was added to parallel MDM-T cell co-cultures, and to the T cells after the co-culture [(+)+500 nM NVP]. The levels of contaminating MDM-derived Gag and GAPDH DNA were subtracted from the total DNA levels. Graphs show the means ± SD of triplicate samples from a representative experiment relative to R3A-(+) after three days (set at 100%). (B–C) T cells were co-cultured with R3A-infected MDMs for 6 h, separated from the MDMs and fixed immediately (0 days), or incubated for another five days (5 days). The T cells were immunostained for p24/p55 Gag and CD3, and analysed by flow cytometry. (B) shows the results of a representative experiment, and the numbers above the gates indicate the proportions of Gag-positive cells. (C) shows the mean proportions of Gag-positive cells ± SD from three donors.

References

    1. Yan N, Chen ZJ (2012) Intrinsic antiviral immunity. Nat Immunol 13: 214–222. - PMC - PubMed
    1. Neil SJD, Zang T, Bieniasz PD (2008) Tetherin inhibits retrovirus release and is antagonized by HIV-1 Vpu. Nature 451: 425–430. - PubMed
    1. Van Damme N, Goff D, Katsura C, Jorgenson RL, Mitchell R, et al. (2008) The interferon-induced protein BST-2 restricts HIV-1 release and is downregulated from the cell surface by the viral Vpu protein. Cell Host Microbe 3: 245–252. - PMC - PubMed
    1. Sauter D, Schindler M, Specht A, Landford WN, Munch J, et al. (2009) Tetherin-driven adaptation of Vpu and Nef function and the evolution of pandemic and nonpandemic HIV-1 strains. Cell Host Microbe 6: 409–421. - PMC - PubMed
    1. Rollason R, Korolchuk V, Hamilton C, Schu P, Banting G (2007) Clathrin-mediated endocytosis of a lipid-raft-associated protein is mediated through a dual tyrosine motif. J Cell Sci 120: 3850–3858. - PubMed

Publication types

LinkOut - more resources