. 2014 Jul 2;83(1):69-86.
doi: 10.1016/j.neuron.2014.05.035.

A quantitative framework to evaluate modeling of cortical development by neural stem cells

Affiliations

A quantitative framework to evaluate modeling of cortical development by neural stem cells

Jason L Stein et al. Neuron. .

Abstract

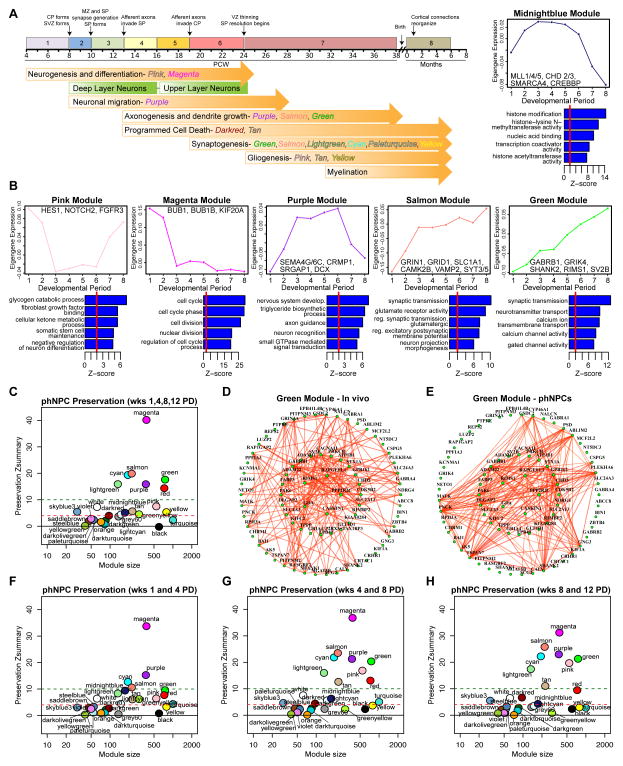
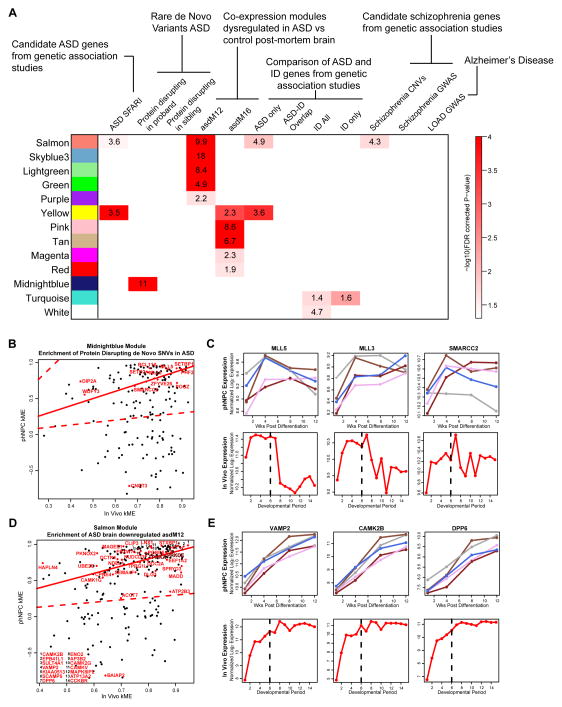
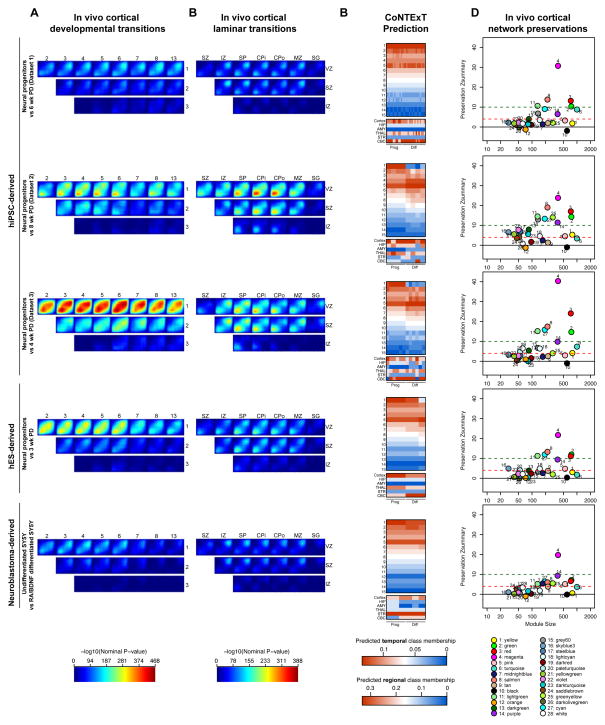
Neural stem cells have been adopted to model a wide range of neuropsychiatric conditions in vitro. However, how well such models correspond to in vivo brain has not been evaluated in an unbiased, comprehensive manner. We used transcriptomic analyses to compare in vitro systems to developing human fetal brain and observed strong conservation of in vivo gene expression and network architecture in differentiating primary human neural progenitor cells (phNPCs). Conserved modules are enriched in genes associated with ASD, supporting the utility of phNPCs for studying neuropsychiatric disease. We also developed and validated a machine learning approach called CoNTExT that identifies the developmental maturity and regional identity of in vitro models. We observed strong differences between in vitro models, including hiPSC-derived neural progenitors from multiple laboratories. This work provides a systems biology framework for evaluating in vitro systems and supports their value in studying the molecular mechanisms of human neurodevelopmental disease.


Figures

Figure 1
Figure 1
phNPCs express canonical telencephalic markers and undergo stereotypical neuronal morphogenesis. (A) Isolation, culture, and differentiation of phNPCs from human fetal cortex. (B,C) Isolated phNPCs express dorsal telencephalic and radial glia markers. Undifferentiated phNPCs were subjected to immunocytochemistry with the indicated antibodies and the DNA-binding dye 4′,6-diamidino-2-phenylindole (DAPI). Telencephalic (FOXG1, 100%, ASCL1, 19%; n=368 cells), dorsal telencephalic and radial glia (PAX6, SOX2; 97%, n=395 cells) and mitotic (Ki-67; 36%, n=395 cells) markers are expressed. (D, E) Differentiation of phNPCs into MAP2+ neurons with concomitant decrease in neural progenitors (Nestin, Ki-67) across the indicated timepoints (n=794 cells; Ki-67, n=1693 cells). (F) phNPCs were infected with a low titer of turboRFP-expressing lentivirus (pTRIPZ) and subjected to immunocytochemistry with MAP2 and turboRFP antibodies at 2, 5 and 12 weeks post-differentiation. Axo-dendritic polarization and increased dendritic complexity is observed over development in vitro. Arrows and arrowheads indicate dendrites and axons, respectively. (G) Quantification of dendrite morphogenesis in MAP2+ neurons treated as in F shows robust dendrite growth and branching over differentiation (n= 23 cells/timepoint in 5 lines from 3 donors; mean ± SE displayed in barplot). Scale bar = 50μm for all panels.
Figure 2
Figure 2
Expression of transcriptomically-defined regional markers in vitro and in vivo. Expression levels of 5 to 20 marker genes enriched in each indicated brain region during late mid fetal in vivo development (Period 6) along with 12 wk PD phNPCs is shown. Genes are shown on the x-axis with colors to indicate the region for which the gene is a marker. The y-axis indicates the in vivo dissected region or in vitro cell line, specified by donor identification number and region identification number. Relative expression is indicated by color within the heat map and normalized for each gene from 0 to 1. Abbreviations: Cortex: OFC, DFC, VFC, MFC, M1C, S1C, IPC, A1C, STC, ITC, V1C; Hippocampus: HIP; Amygdala; AMY; Striatum: STR; Medial Dorsal Nucleus of the Thalamus: MD; Cerebellar Cortex: CBC.
Figure 3
Figure 3
TMAP identifies in vivo developmental period and cortical laminae most similar to differentiating phNPCs. Rank-rank hypergeometric overlap (RRHO) maps (Plaisier et al., 2010) comparing the transitions between in vivo developmental periods (A–C) or laminae in the developing cortex (D–E) to differentiation of phNPCs from 1 to 12 wks. (A,D) Each pixel represents the overlap between in vivo and in vitro transcriptome, color-coded according to the -log10 p-value of a hypergeometric test (step size = 200). On each map, the extent of shared upregulated genes is displayed in the bottom left corner, whereas shared downregulated genes are displayed in the top right corners (see schematic on rightmost panel). (B,E) Venn diagrams display the extent of overlap between in vivo and in vitro transcriptomes at the best matched periods (1 vs 6; B) and between SZ and CPi (E). Gene ontology (GO Elite) analysis shows co-upregulated genes are related to synaptic transmission and nervous system development, whereas co-downregulated genes are involved in mitosis. (C) Selected genes co-upregulated and co-downregulated are graphed through time both in developing phNPCs and in vivo.
Figure 4
Figure 4
CoNTExT predicts developmental period and regional identity in individual phNPC cultures. (A) The CoNTExT algorithm was trained on all samples from a spatio-temporal atlas of human brain expression (Kang et al., 2011) (1340 samples using Affymetrix Exon 1.0 ST Array), and validated in several post-mortem expression datasets. Probability (color in heat map) of each predicted class assignment (y-axis) is shown for each sample of known regional and temporal identity (x-axis). (B) Cross platform accuracy was evaluated in 49 samples spanning all postnatal developmental periods and both cerebellar and cortical regions (Liu et al., 2012) (Affymetrix Gene 1.0 ST Array). Developmental period was classified with 84% (+/− one period) and 100% accuracy in region. (C) The validated machine learning algorithm was applied to one line (Donor: 8 Region: 49) of differentiating phNPCs to predict developmental period and regional identity (Illumina HT-12 Beadchip). A clear maturation across differentiation weeks is seen at the individual sample level, with the culture reaching early to late fetal periods of development. In addition, the cultures are predicted to be cortical, consistent with immunocytochemical profile and expression of regional markers.
Figure 5
Figure 5
Network analysis identifies major neurodevelopmental processes that are preserved in differentiating phNPCs. (A) A weighted gene co-expression network was formed using human cortex samples from embryonic (Period 1) to neonatal periods (Period 8). Timeline of known cellular and histogenetic processes in the developing human brain (Andersen, 2003; Kang et al., 2011) and modules enriched in genes related these processes are labeled. (B) A subset of modules related to key neurodevelopmental processes are highlighted with corresponding GO analysis, selected hub genes, and module eigengene trajectories (see Table 1 for full list). (C) Module preservation (Langfelder et al., 2011) in phNPCs differentiated over 12 weeks shows high preservation (Z 4) of 12 modules. (D,E) The green module, enriched in genes involved in synaptic function, shows a similar pattern of connectivity in vivo (D) and in vitro (E). The width and color of the edges are weighted by the strength of bi-correlation. (F,G,H) Module preservation varies over differentiation time. Early differentiation periods (F) show stronger preservation of chromatin modification genes (midnightblue module) while later time periods (G,H) show stronger preservation of gliogenic (pink, tan modules) and synaptogenic (salmon, green, lightgreen, cyan modules) genes.
Figure 6
Figure 6
phNPC preserved modules are enriched in ASD associated genes. (A) In vivo defined modules preserved in differentiating phNPCs were tested for enrichment of disease associated genes from a curated list of autism-associated genes (ASD SFARI; (Banerjee-Basu and Packer, 2010)), rare de-novo protein disrupting mutations found in ASD and siblings (Iossifov et al., 2012; Neale et al., 2012; O’Roak et al., 2012; Sanders et al., 2012), two ASD associated modules defined in post-mortem brain (asdM12 and asdM16; (Voineagu et al., 2011)), a curated list of genes associated with intellectual disability (ID All) (Inlow and Restifo, 2004; Lubs et al., 2012; Parikshak et al., 2013; Ropers, 2008; van Bokhoven, 2011), the intersection of ASD SFARI with ID (ASD-ID overlap), the relative complement of these (ASD only, ID only), a list of genes disrupted by CNVs in schizophrenia (Levinson et al., 2011), genes near significantly associated loci in GWAS of schizophrenia (Ripke et al., 2013), and genes near significantly associated loci in GWAS of late onset Alzheimer’s disease (Naj et al., 2011). Enrichment was assessed using Fisher’s exact test and the FDR (Benjamini and Hochberg, 1995) correction for multiple comparisons P-value is displayed. (B) Protein disrupting de novo SNVs found in ASD are enriched in the preserved midnightblue module. The correlation of each gene to the module eigengene (kME) is shown for in vivo and phNPC data (1 and 4 wk PD). ASD-associated genes are highlighted in red. Genes close to the solid red line (y=x) have the same kME in vivo and in vitro. The dotted red line represents an in vivo kME value 3 times less than observed in vivo. (C) Several genes that contain ASD-associated de novo SNVs have similar expression patterns in vivo and in vivo. (D) kME is shown for in vivo and phNPC data (1, 4, 8, and 12 wk PD) for the preserved salmon module that is enriched in asdM12 genes (Voineagu et al., 2011). ASD-associated genes in asdM12 are in red and are labeled. (E) Several asdM12 genes show similar expression patterns in vivo and in vitro.
Figure 7
Figure 7
The extent of in vivo overlap observed in multiple in vitro neural stem cell models. The transitions between in vivo developmental periods of neocortex (Kang et al., 2011) (A) or laminae in the developing cortex (Miller et al., 2014) (B) are compared to the transition between proliferative and differentiated neuronal cultures derived from 3 datasets of hiPSC cells, hES (Fathi et al., 2011), and SY5Y neuroblastoma (Nishida et al., 2008) cells. The color bars are on the same scale as Figure 3. Comparisons of in vivo overlap between in vitro systems are found in Figure S6. (C) The machine learning framework CoNTExT was used to predict the regional and temporal identity of each sample. The identity of each sample as progenitor or differentiated is labeled below the heatmaps. The accuracy of CoNTExT predictions is related to the degree of in vitro matching, so low matching systems may not have accurate predictions (Figure S4). (D) Module preservation was used to test which processes were conserved in different in vivo systems on the same scale as Figure 5.

References

    1. Akbarian S, Kim JJ, Potkin SG, Hetrick WP, Bunney WE, Jr, Jones EG. Maldistribution of interstitial neurons in prefrontal white matter of the brains of schizophrenic patients. Arch Gen Psychiatry. 1996;53:425–436. - PubMed
    1. An MC, Zhang N, Scott G, Montoro D, Wittkop T, Mooney S, Melov S, Ellerby LM. Genetic correction of Huntington’s disease phenotypes in induced pluripotent stem cells. Cell stem cell. 2012;11:253–263. - PMC - PubMed
    1. Andersen SL. Trajectories of brain development: point of vulnerability or window of opportunity? Neuroscience and biobehavioral reviews. 2003;27:3–18. - PubMed
    1. Anderson SA, Volk DW, Lewis DA. Increased density of microtubule associated protein 2-immunoreactive neurons in the prefrontal white matter of schizophrenic subjects. Schizophr Res. 1996;19:111–119. - PubMed
    1. Andrews PW, Benvenisty N, McKay R, Pera MF, Rossant J, Semb H, Stacey GN Steering Committee of the International Stem Cell I. The International Stem Cell Initiative: toward benchmarks for human embryonic stem cell research. Nat Biotechnol. 2005;23:795–797. - PubMed

Publication types