. 2014 Nov 15;23(22):2700-11.
doi: 10.1089/scd.2014.0129. Epub 2014 Aug 18.

Rad51 regulates cell cycle progression by preserving G2/M transition in mouse embryonic stem cells

Affiliations

Rad51 regulates cell cycle progression by preserving G2/M transition in mouse embryonic stem cells

Sang-Wook Yoon et al. Stem Cells Dev. .

Abstract

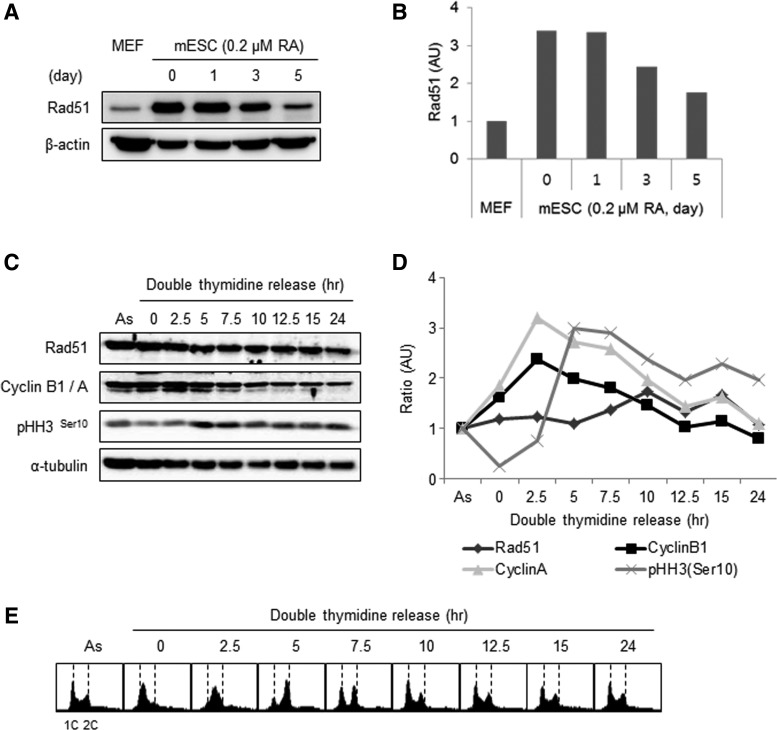
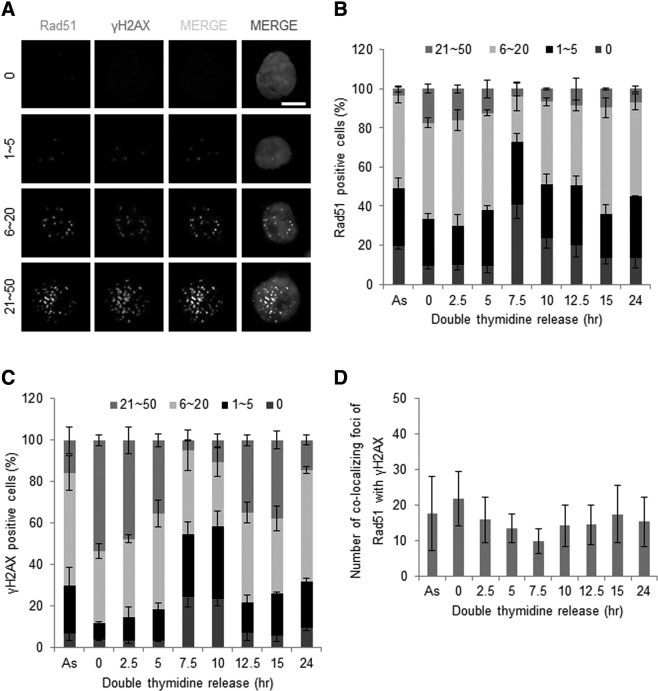
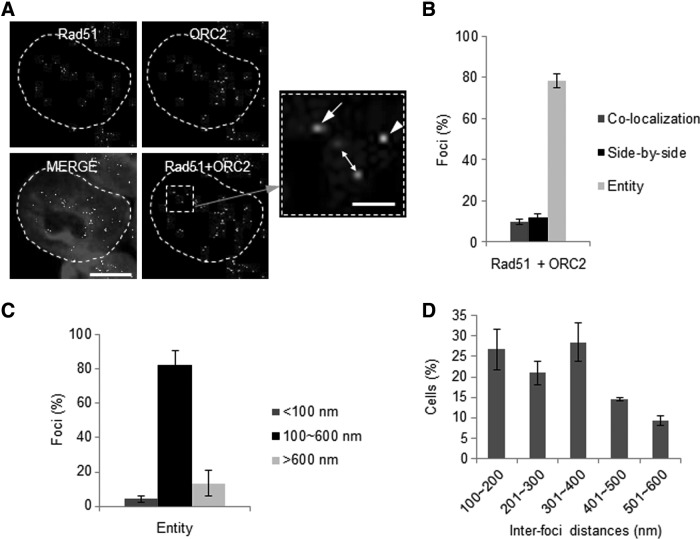
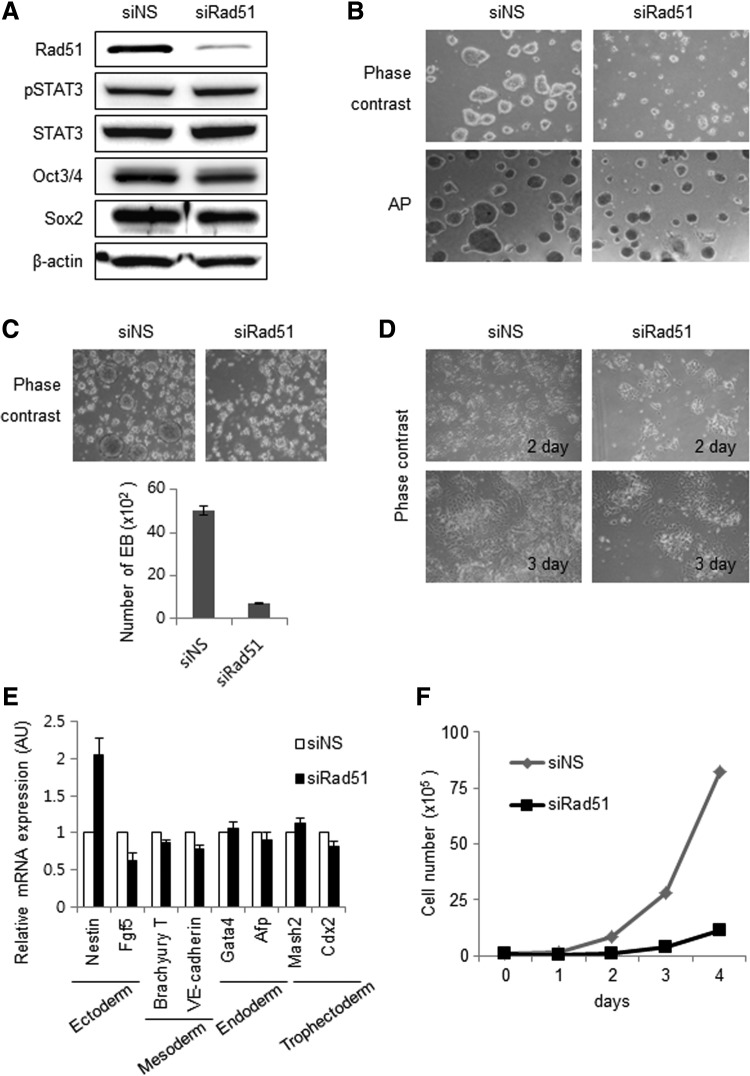
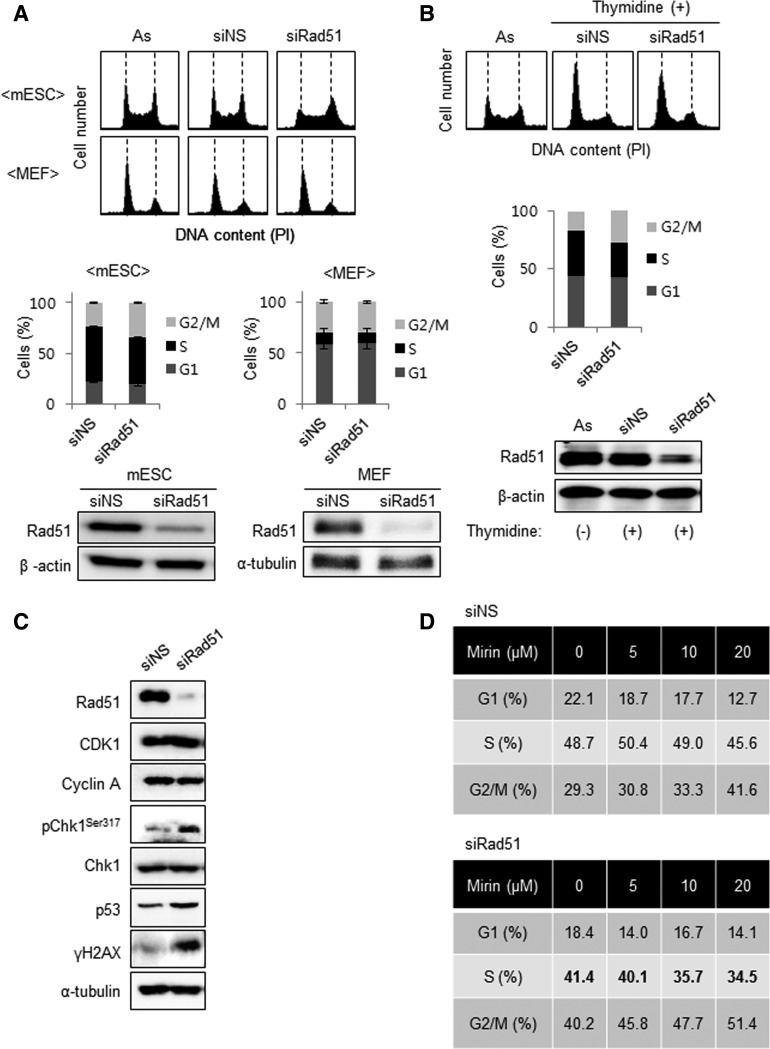
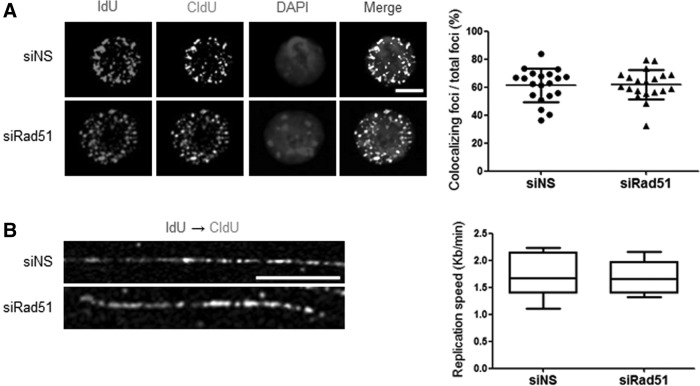
Homologous recombination (HR) maintains genomic integrity against DNA replication stress and deleterious lesions, such as double-strand breaks (DSBs). Rad51 recombinase is critical for HR events that mediate the exchange of genetic information between parental chromosomes in eukaryotes. Additionally, Rad51 and HR accessory factors may facilitate replication fork progression by preventing replication fork collapse and repair DSBs that spontaneously arise during the normal cell cycle. In this study, we demonstrated a novel role for Rad51 during the cell cycle in mouse embryonic stem cells (mESCs). In mESCs, Rad51 was constitutively expressed throughout the cell cycle, and the formation of Rad51 foci increased as the cells entered S phase. Suppression of Rad51 expression caused cells to accumulate at G2/M phase and activated the DNA damage checkpoint, but it did not affect the self-renewal or differentiation capacity of mESCs. Even though Rad51 suppression significantly inhibited the proliferation rate of mESCs, Rad51 suppression did not affect the replication fork progression and speed, indicating that Rad51 repaired DNA damage and promoted DNA replication in S phase through an independent mechanism. In conclusion, Rad51 may contribute to G2/M transition in mESCs, while preserving genomic integrity in global organization of DNA replication fork.


Figures

<b>FIG. 1.</b>
FIG. 1.
Expression of Rad51 throughout the cell cycle in mouse embryonic stem cells (mESCs). (A) Rad51 protein levels in mESCs and mouse embryonic fibroblasts (MEFs). mESCs were spontaneously differentiated by removing leukemia inhibitory factor (LIF) and adding retinoic acid (0.2 μM). (B) Quantification of Rad51 expression in mESCs and MEFs. (C) mESCs were synchronized with a double thymidine and then released from G1/S phase. The cells were collected at 2.5-h intervals, as indicated. Cyclin B1/A and phospho-histone H3Ser10 were used as markers for cell cycle progression. α-Tubulin was used as a loading control. (D) The level of each protein was quantified. Relative ratio of each protein band over the band of α–tubulin was described in each time point. The numerical value of each sample at indicated time point was normalized by the value of asynchronous cells (As). (E) Cell cycle profile was assessed by fluorescence-activated cell sorting (FACS) analysis.
<b>FIG. 2.</b>
FIG. 2.
Rad51 foci formation during the cell cycle in synchronized mESCs. (A) mESCs were synchronized with a double thymidine and then released from G1/S phase as in Fig. 1. Rad51 and γH2AX foci in mESCs were immunostained and visualized with fluorescence microscopy (×1000). Cells displaying fluorescent signals were categorized according to the number of foci per nucleus. The scale bar indicates 10 μm. The number of cells possessing Rad51 (B) and γH2AX (C) foci at each cell cycle phase was quantified. Three independent experiments were performed and, at least, 200 cells were counted for each experiment. (D) The colocalization pattern for the number of Rad51 and γH2AX foci at the indicated time points after release from the double-thymidine block. Error bars indicate mean±standard deviation (SD).
<b>FIG. 3.</b>
FIG. 3.
Analysis of Rad51 foci in DNA replication sites. (A) Representative images of confocal microscopy showing the formation of Rad51 and ORC2 (marker for DNA replication initiation) nuclear foci. The interfoci distances between Rad51 and ORC2 in each cell were measured using Leica Application Suite Advanced Fluorescence software. The scale bar indicates 10 μm. Foci inside the dotted square box were magnified (arrowhead: colocalization; arrow: side-by-side; full duplex arrow: entity). The scale bar in the magnified image is 1 μm. (B) Based on the pattern of nuclear foci formation, cells were divided into three groups and quantified as in (A). (C) Cell populations existing as an independent entity were subdivided into three groups based on the estimated replication factory size [50]. (D) Rad51 foci inside the replication factory. The interfoci distances of entity foci were categorized and quantified every 100 nm. Error bars indicate mean±SD.
<b>FIG. 4.</b>
FIG. 4.
Rad51 knockdown affects the proliferation rate, but not the differentiation of mESCs. (A) The expression of pSTAT3, STAT3, Oct3/4, and Sox2 proteins in mESCs transfected with siNS or siRad51 was detected by immunoblot analysis. β-Actin was used as a loading control. (B) mESCs transfected with siNS or siRad51 were stained to measure alkaline phosphatase (AP) activity. (C) The effect of Rad51 on embryoid body (EB) formation. After transfection with siNS or siRad51, mESCs were incubated in EB media for 72 h, and the degree of EB formation was quantified (bottom). (D) The effect of Rad51 on differentiation of mESCs. mESCs were transfected with siNS or siRad51 and then spontaneously differentiated by the removal of LIF and addition of 0.2 μM of retinoic acid. (E) Quantitative RT-PCR analysis of expression of lineage-specific marker genes in spontaneously differentiated mESCs after siNS or siRad51 transfection. Most of lineage markers, except Nestin, in siRad51-treated cells showed similar expression level with those of control cells transfected with nonspecific siRNA. (F) Effect of Rad51 on proliferation of mESCs. mESCs were transfected with siNS or siRad51, and the viable cells were counted at the indicated times.
<b>FIG. 5.</b>
FIG. 5.
Accumulation of Rad51-knockdown mESCs in G2/M and its effect on DNA damage checkpoint activation. (A) Analysis of cell cycle profiles after Rad51 knockdown in mESCs and MEFs. After siRNA transfection for 48 h, cells were harvested and stained with PI for FACS analysis as described in “Materials and Methods” (As; asynchronous cells). Data were quantified using FlowJo software (bottom). Error bars indicate mean±SD. (B) mESCs transfected with siNS or siRad51 were attempted to synchronize at G1/S phase using double thymidine. The cell cycle profiles of the cells were then analyzed using FACS Calibur. The population of each cell cycle phase was quantified with FlowJo software (middle). The level of Rad51 was determined by immunoblot analysis (bottom). (C) Activation of the DNA damage checkpoint by depletion of Rad51. Cells were harvested 48 h after siRNA transfection, and markers involved in cell cycle control and DNA damage checkpoint signaling were detected by immunoblot analysis. (D) The relative proportion of cells at indicated cell cycle phase after Rad51 siRNA transfection in the presence of mirin.
<b>FIG. 6.</b>
FIG. 6.
S-phase progression after the depletion of Rad51 protein. (A) mESCs transfected with siNS or siRad51 were incubated with 2 mM thymidine for 16 h and then released into fresh media. Two hours later, the thymidine analogs IdU (50 μM) and CldU (200 μM) were successively incorporated into the DNA replication sites. Subsequently, the colocalization of IdU and CldU replication foci was stained with corresponding antibodies and the degree of colocalizing foci areas was quantified in each isolated cell using Image J software (right). (B) mESCs transfected with siNS or siRad51 were successively pulse labeled with IdU and CldU to final concentrations of 100 and 250 μM, respectively, for 20 min. DNA fibers were immunostained with antibodies specific for IdU and CldU. The replication speed was quantified from the mean fork extension rate (kb/min) during sequential pulse labels with IdU (1st label, 20 min) and CldU (2nd label, 20 min) in mESCs.

References

    1. Rossant J. (2001). Stem cells from the Mammalian blastocyst. Stem Cells 19:477–482 - PubMed
    1. Andrews PW. (2002). From teratocarcinomas to embryonic stem cells. Philos Trans R Soc Lond B Biol Sci 357:405–417 - PMC - PubMed
    1. Baker DE, Harrison NJ, Maltby E, Smith K, Moore HD, Shaw PJ, Heath PR, Holden H. and Andrews PW. (2007). Adaptation to culture of human embryonic stem cells and oncogenesis in vivo. Nat Biotechnol 25:207–215 - PubMed
    1. Maitra A, Arking DE, Shivapurkar N, Ikeda M, Stastny V, Kassauei K, Sui G, Cutler DJ, Liu Y, et al. (2005). Genomic alterations in cultured human embryonic stem cells. Nat Genet 37:1099–1103 - PubMed
    1. Savatier P, Lapillonne H, Jirmanova L, Vitelli L. and Samarut J. (2002). Analysis of the cell cycle in mouse embryonic stem cells. Methods Mol Biol 185:27–33 - PubMed

Publication types

Substances

LinkOut - more resources