

Genetic control of water use efficiency and leaf carbon isotope discrimination in sunflower (Helianthus annuus L.) subjected to two drought scenarios
- PMID: 24992022
- PMCID: PMC4081578
- DOI: 10.1371/journal.pone.0101218
Genetic control of water use efficiency and leaf carbon isotope discrimination in sunflower (Helianthus annuus L.) subjected to two drought scenarios
Abstract
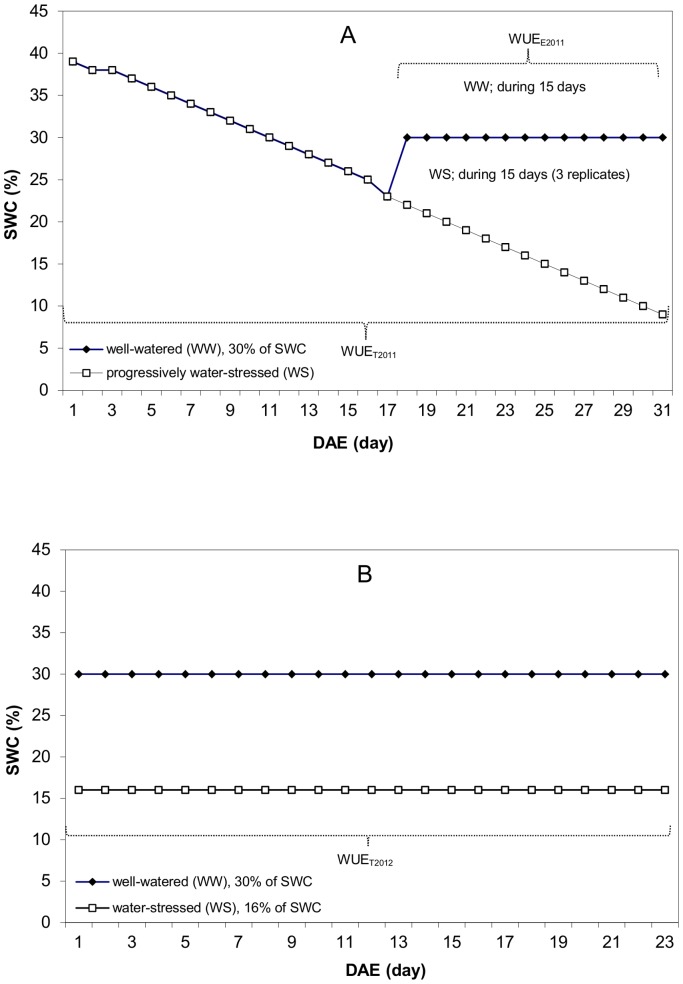
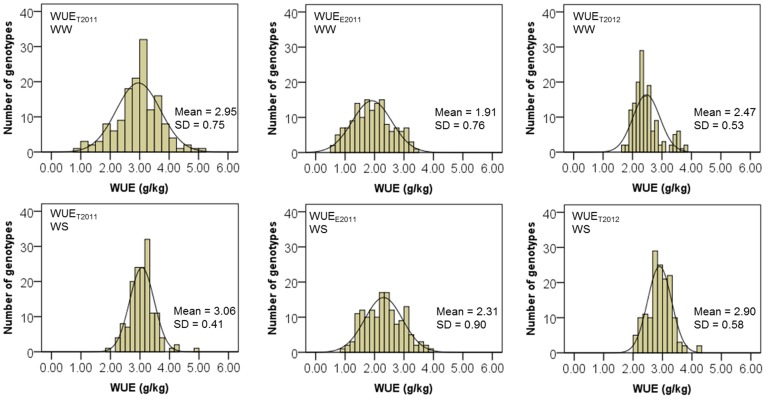
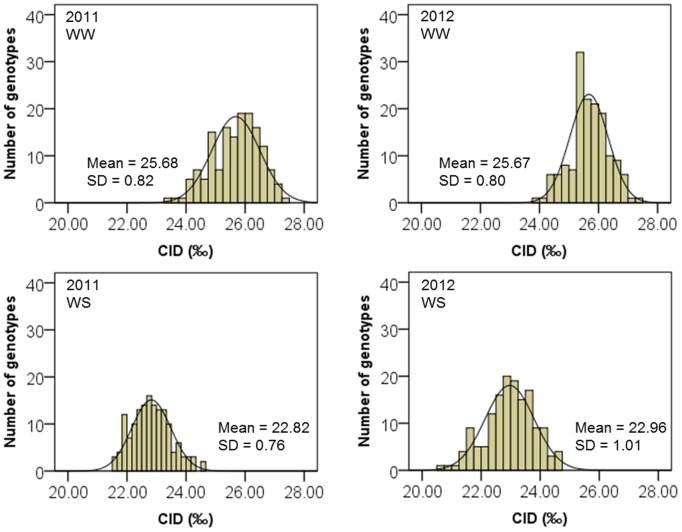
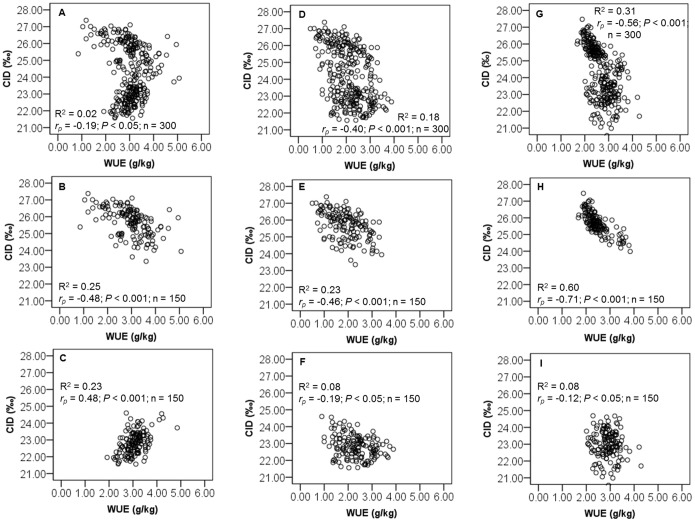
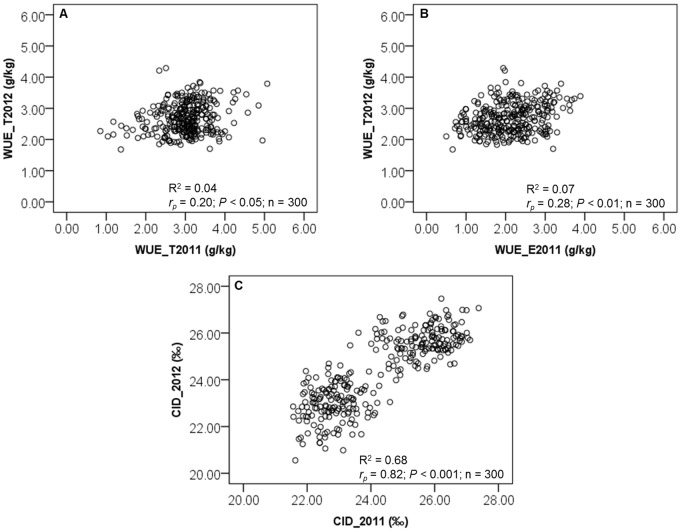
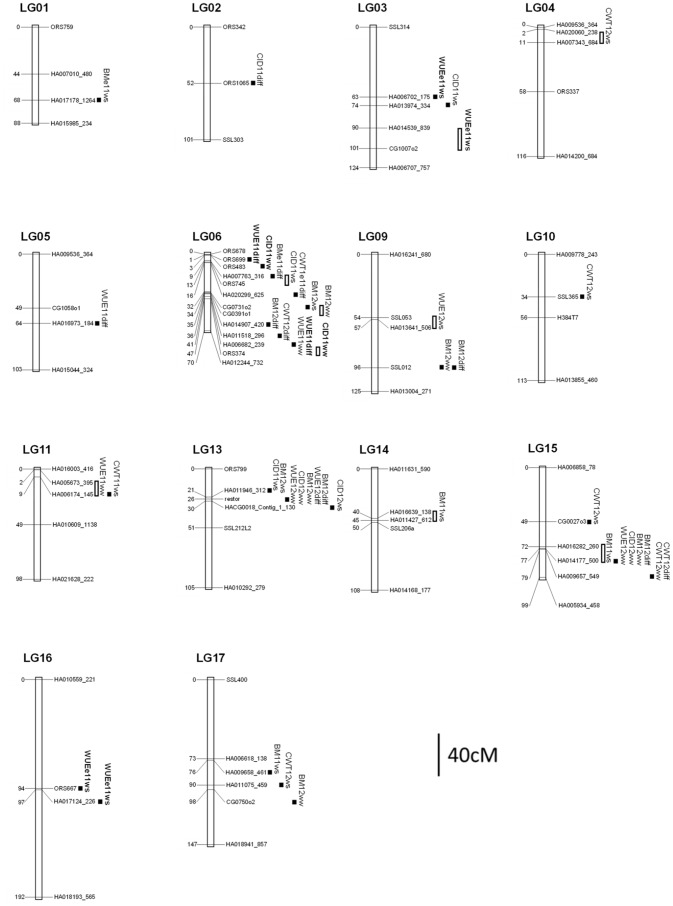
High water use efficiency (WUE) can be achieved by coordination of biomass accumulation and water consumption. WUE is physiologically and genetically linked to carbon isotope discrimination (CID) in leaves of plants. A population of 148 recombinant inbred lines (RILs) of sunflower derived from a cross between XRQ and PSC8 lines was studied to identify quantitative trait loci (QTL) controlling WUE and CID, and to compare QTL associated with these traits in different drought scenarios. We conducted greenhouse experiments in 2011 and 2012 by using 100 balances which provided a daily measurement of water transpired, and we determined WUE, CID, biomass and cumulative water transpired by plants. Wide phenotypic variability, significant genotypic effects, and significant negative correlations between WUE and CID were observed in both experiments. A total of nine QTL controlling WUE and eight controlling CID were identified across the two experiments. A QTL for phenotypic response controlling WUE and CID was also significantly identified. The QTL for WUE were specific to the drought scenarios, whereas the QTL for CID were independent of the drought scenarios and could be found in all the experiments. Our results showed that the stable genomic regions controlling CID were located on the linkage groups 06 and 13 (LG06 and LG13). Three QTL for CID were co-localized with the QTL for WUE, biomass and cumulative water transpired. We found that CID and WUE are highly correlated and have common genetic control. Interestingly, the genetic control of these traits showed an interaction with the environment (between the two drought scenarios and control conditions). Our results open a way for breeding higher WUE by using CID and marker-assisted approaches and therefore help to maintain the stability of sunflower crop production.
Conflict of interest statement
Figures
Similar articles
-
Identification of quantitative trait loci for carbon isotope ratio (δ13C) in a recombinant inbred population of soybean.Theor Appl Genet. 2020 Jul;133(7):2141-2155. doi: 10.1007/s00122-020-03586-0. Epub 2020 Apr 15. Theor Appl Genet. 2020. PMID: 32296861
-
The genetic basis of water-use efficiency and yield in lettuce.BMC Plant Biol. 2021 May 27;21(1):237. doi: 10.1186/s12870-021-02987-7. BMC Plant Biol. 2021. PMID: 34044761 Free PMC article.
-
Deciphering the regulatory network of carbon isotope discrimination in bread wheat through genome-wide association studies and genomic prediction.Theor Appl Genet. 2025 Aug 13;138(9):212. doi: 10.1007/s00122-025-04980-2. Theor Appl Genet. 2025. PMID: 40801956
-
Gene discovery in cereals through quantitative trait loci and expression analysis in water-use efficiency measured by carbon isotope discrimination.Plant Cell Environ. 2011 Dec;34(12):2009-23. doi: 10.1111/j.1365-3040.2011.02397.x. Epub 2011 Aug 16. Plant Cell Environ. 2011. PMID: 21752030 Review.
-
The carbon isotopic signature of C4 crops and its applicability in breeding for climate resilience.Theor Appl Genet. 2021 Jun;134(6):1663-1675. doi: 10.1007/s00122-020-03761-3. Epub 2021 Feb 11. Theor Appl Genet. 2021. PMID: 33575820 Free PMC article. Review.
Cited by
-
Physiological performance of two contrasting rice varieties under water stress.Physiol Mol Biol Plants. 2017 Jan;23(1):85-97. doi: 10.1007/s12298-016-0399-2. Epub 2016 Dec 5. Physiol Mol Biol Plants. 2017. PMID: 28250586 Free PMC article.
-
Plasticity of the Root System Architecture and Leaf Gas Exchange Parameters Are Important for Maintaining Bottle Gourd Responses under Water Deficit.Plants (Basel). 2020 Dec 3;9(12):1697. doi: 10.3390/plants9121697. Plants (Basel). 2020. PMID: 33287101 Free PMC article.
-
Salinity tolerance loci revealed in rice using high-throughput non-invasive phenotyping.Nat Commun. 2016 Nov 17;7:13342. doi: 10.1038/ncomms13342. Nat Commun. 2016. PMID: 27853175 Free PMC article.
-
Nutritional consequences of breeding away from riparian habitats in Bank Swallows: new evidence from multiple endogenous markers.Conserv Physiol. 2021 Jan 19;9(1):coaa140. doi: 10.1093/conphys/coaa140. eCollection 2021. Conserv Physiol. 2021. PMID: 33532072 Free PMC article.
-
Identification of loci associated with water use efficiency and symbiotic nitrogen fixation in soybean.Front Plant Sci. 2023 Nov 16;14:1271849. doi: 10.3389/fpls.2023.1271849. eCollection 2023. Front Plant Sci. 2023. PMID: 38034552 Free PMC article.
References
-
- Ehleringer JR, Hall AE, Farquhar GD (1993) Stable isotopes and plant carbon – water relations. San Diego: Academic Press.
-
- Richards RA, Rebetzke GJ, Condon AG, van Herwaarden AF (2002) Breeding opportunities for increasing the efficiency of water use and crop yield in temperate cereals. Crop Sci 42: 111–121. - PubMed
-
- Cattivelli L, Rizza F, Badeck FW, Mazzucotelli E, Mastrangelo AM, et al. (2008) Drought tolerance improvement in crop plants: an integrated view from breeding to genomics. Field Crops Res 105: 1–14.
-
- Blum A (1996) Crop responses to drought and the interpretation of adaptation. Plant Growth Regul 20: 135–148.
-
- Richards RA (1996) Defining selection criteria to improve yield under drought. Plant Growth Regul 20: 157–166.
Publication types
MeSH terms
Substances
LinkOut - more resources
Full Text Sources
Other Literature Sources
