. 2014 Aug;9(8):1771-91.
doi: 10.1038/nprot.2014.110. Epub 2014 Jul 3.

Using Fourier transform IR spectroscopy to analyze biological materials

Affiliations

Using Fourier transform IR spectroscopy to analyze biological materials

Matthew J Baker et al. Nat Protoc. 2014 Aug.

Abstract

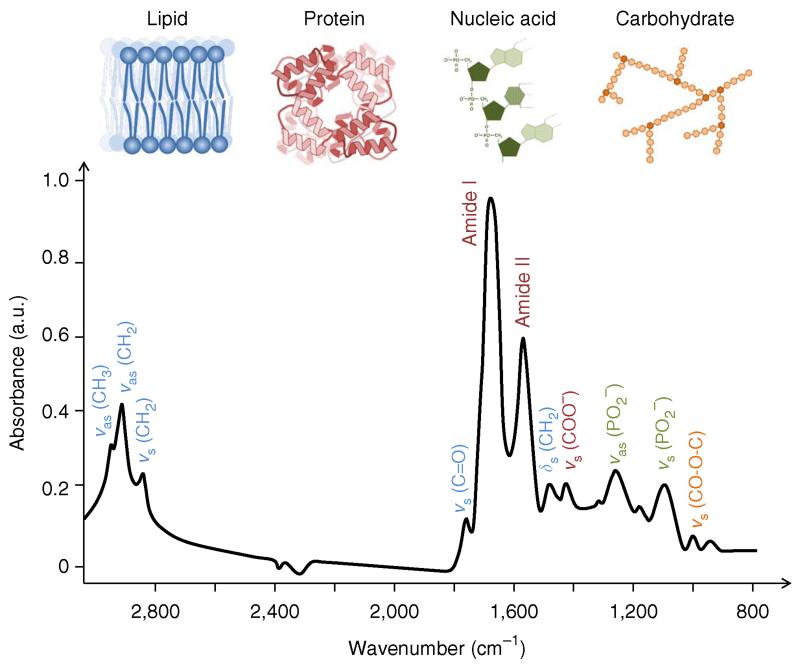
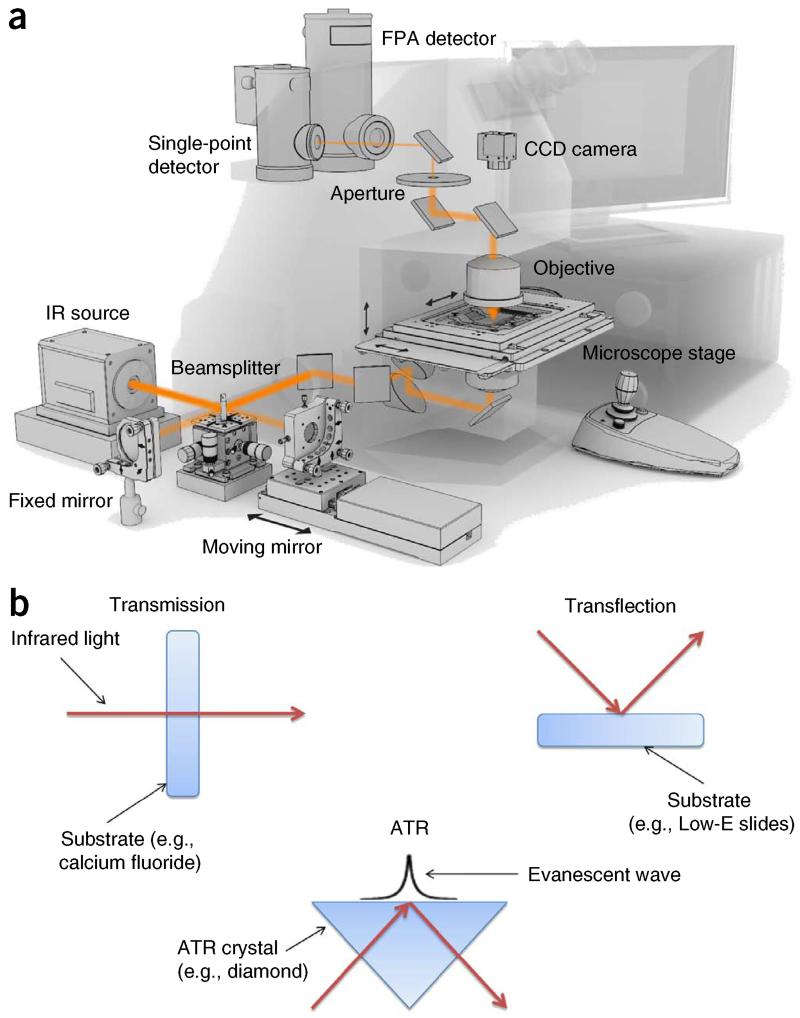
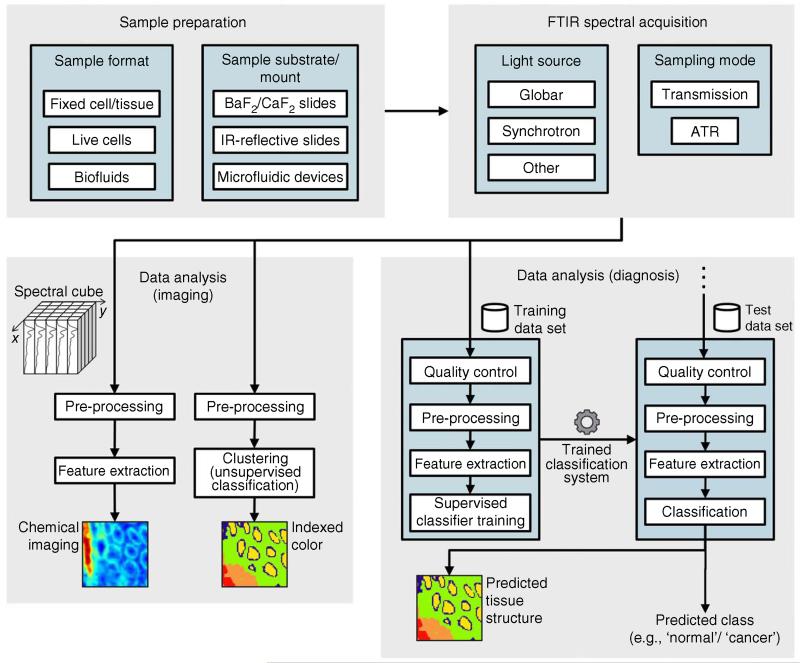
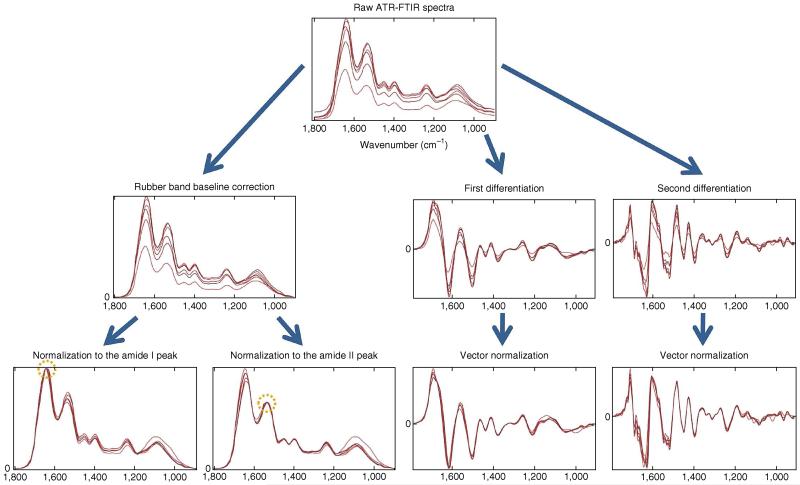
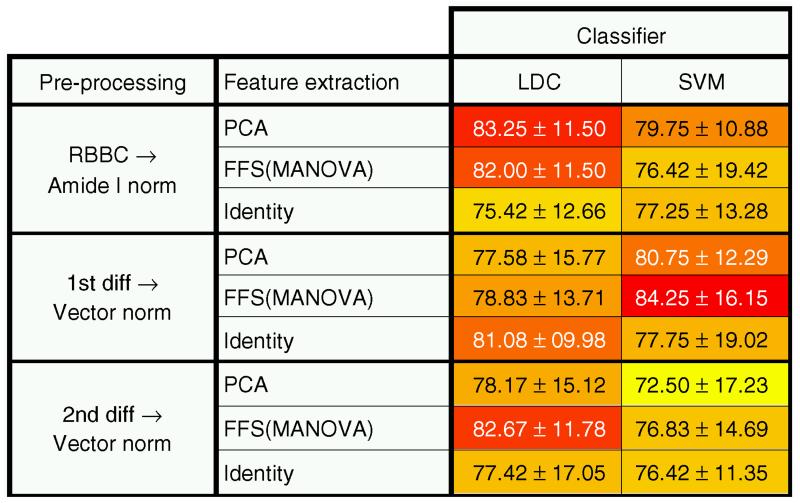
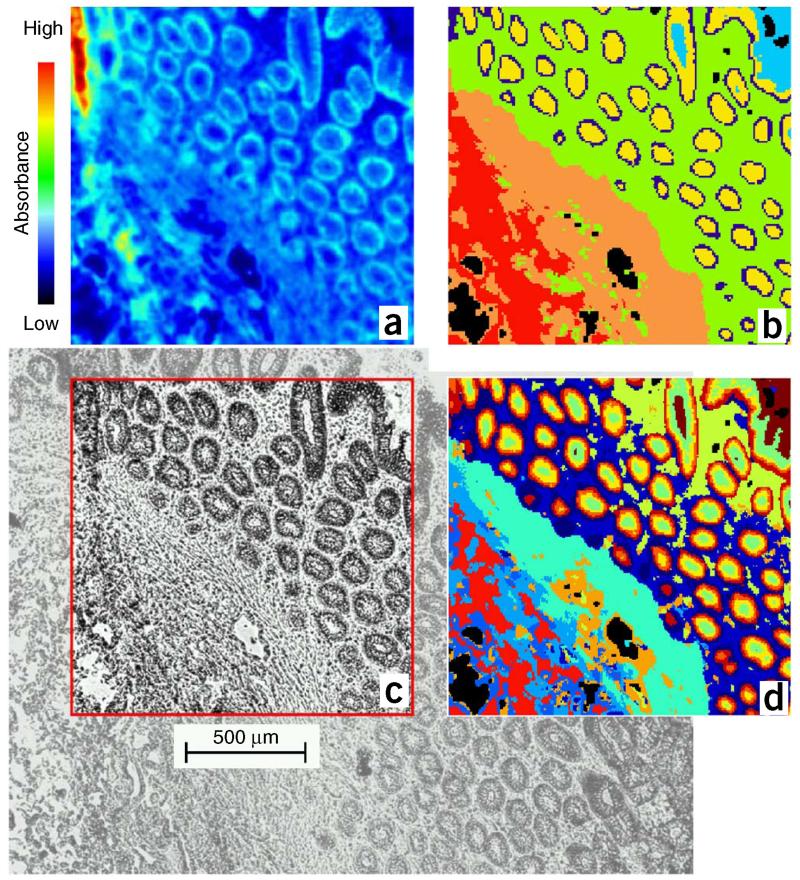
IR spectroscopy is an excellent method for biological analyses. It enables the nonperturbative, label-free extraction of biochemical information and images toward diagnosis and the assessment of cell functionality. Although not strictly microscopy in the conventional sense, it allows the construction of images of tissue or cell architecture by the passing of spectral data through a variety of computational algorithms. Because such images are constructed from fingerprint spectra, the notion is that they can be an objective reflection of the underlying health status of the analyzed sample. One of the major difficulties in the field has been determining a consensus on spectral pre-processing and data analysis. This manuscript brings together as coauthors some of the leaders in this field to allow the standardization of methods and procedures for adapting a multistage approach to a methodology that can be applied to a variety of cell biological questions or used within a clinical setting for disease screening or diagnosis. We describe a protocol for collecting IR spectra and images from biological samples (e.g., fixed cytology and tissue sections, live cells or biofluids) that assesses the instrumental options available, appropriate sample preparation, different sampling modes as well as important advances in spectral data acquisition. After acquisition, data processing consists of a sequence of steps including quality control, spectral pre-processing, feature extraction and classification of the supervised or unsupervised type. A typical experiment can be completed and analyzed within hours. Example results are presented on the use of IR spectra combined with multivariate data processing.


Figures

Figure 1
Figure 1
Typical biological spectrum showing biomolecular peak assignments from 3,000–800 cm−1, where ν = stretching vibrations, δ = bending vibrations, s = symmetric vibrations and as = asymmetric vibrations. The spectrum is a transmission-type micro-spectrum from a human breast carcinoma (ductal carcinoma in situ). The sample was cryosectioned (8 μm thick) and mounted on BaF2 slides (1 mm thick) before IR microspectroscopy. Equipment: Bruker IR scope II, circular diameter of aperture ~60 μm; a.u., arbitrary units.
Figure 2
Figure 2
The instrumentation underlying the main forms of IR spectroscopic sampling. (a) Schematic of modern FTIR-imaging spectrometer. Reproduced with permission from ref. . (b) Schematic representation of the three main sampling modes for FTIR spectroscopy. Reprinted from Trends Biotechnol, 31, Dorling, K.M. and M.J. Baker, Highlighting attenuated total reflection Fourier transform infrared spectroscopy for rapid serum analysis, 327–328, Copyright 2013 with permission from Elsevier (ref. 132).
Figure 3
Figure 3
FTIR spectroscopy work flow for imaging and diagnosis. The three major steps are sample preparation, FTIR spectral acquisition and data analysis. Sample preparation may differ depending on the sample format, requiring different materials and procedures. At FTIR spectral acquisition, several options have to be considered for light source and sampling mode. Data analysis presents different paths depending on the analysis goal (i.e., imaging or diagnosis). The framework for diagnosis is somewhat more complex, involving training of classification systems and validation of these systems using test data sets. Although not illustrated, the data sets used for testing are also obtained through sample preparation followed by FTIR spectral acquisition.
Figure 4
Figure 4
Visual effect of different pre-processing steps on a set of FTIR spectra. Two common pre-processing sequences are rubber band baseline correction followed by normalization to the amide I/II peak and first or second differentiation followed by vector normalization. Rubber band baseline correction subtracts a rubber band, which is stretched ‘bottom-up’ at each spectrum, eliminating slopes. Amide I/II normalization forces all spectra to have the same absorbance intensity at the amide I/II peak. Differentiation (Savitzki-Golay (SG) method) has the advantage of eliminating slopes while also resolving overlapped bands, but has the drawback of altering the shape of the spectra (the y axis unit is no longer a.u. (arbitrary units), but ‘a.u. per wavenumber’ (first differentiation) or ‘a.u. per wavenumber squared’ (second differentiation)) and enhancing noise (note how second-differentiated spectra are visibly more noisy). Vector normalization is typically applied after differentiation. This normalization technique does not require a reference peak as amide I/II normalization does.
Figure 5
Figure 5
Classification rates (% classification ± s.d.) of all possible combinations between three different pre-processing, three different feature extraction and two different supervised classifier options. Pre-processing options: rubber band baseline correction followed by normalization to the amide I peak; first Savitzky-Golay (SG) differentiation (7 points; second order) followed by vector normalization; and second SG differentiation followed by vector normalization. FE options: PCA (optimization of number of PCs); forward feature selection (FFS) using multivariate analysis of variance (MANOVA) P values as a criterion to including the next variable (this is similar to the COVAR method for optimization of number of selected features); and ‘Identity’ (FE skipped). Supervised classifier options: linear discriminant classifier (LDC); and support vector machine (SVM; using Gaussian kernel; optimization of the C and γ parameters,). The figure’s cells are gradient-colored according to their respective classification rate inside (yellow to red). RBBC, rubber band baseline correction.
Figure 6
Figure 6
IR image reconstruction of a section of human colon mucosa. (a) Chemical map based on the integrated absorbance of the amide I band (1,620–1,680 cm−1). (b) IR imaging using agglomerative HCA (six clusters). (c) Standard histological preparation of the colonic mucosa. (d) IR map generated on the basis of k-means clustering (15 clusters). Adapted with permission from ref. .

Similar articles

Cited by

References

    1. Bellisola G, Sorio C. Infrared spectroscopy and microscopy in cancer research and diagnosis. Am. J. Cancer Res. 2012;2:1–21. - PMC - PubMed
    1. Diem M, Romeo M, Boydston-White S, Miljkovic M, Matthaus C. A decade of vibrational micro-spectroscopy of human cells and tissue (1994-2004) Analyst. 2004;129:880–885. - PMC - PubMed
    1. Griffiths P, De Haseth JA. Fourier Transform Infrared Spectrometry. 2nd edn. John Wiley & Sons; 2007.
    1. Walsh MJ, et al. FTIR microspectroscopy coupled with two-class discrimination segregates markers responsible for inter-and intra-category variance in exfoliative cervical cytology. Biomark. Insights. 2008;3:179–189. - PMC - PubMed
    1. Bhargava R, Wall BG, Koenig JL. Comparison of the FT-IR mapping and imaging techniques applied to polymeric systems. Appl. Spectrosc. 2000;54:470–479.

Publication types

MeSH terms