. 2014 Jul 3;9(7):e101643.
doi: 10.1371/journal.pone.0101643. eCollection 2014.

Genetic inhibition of phosphorylation of the translation initiation factor eIF2α does not block Aβ-dependent elevation of BACE1 and APP levels or reduce amyloid pathology in a mouse model of Alzheimer's disease

Affiliations

Genetic inhibition of phosphorylation of the translation initiation factor eIF2α does not block Aβ-dependent elevation of BACE1 and APP levels or reduce amyloid pathology in a mouse model of Alzheimer's disease

Katherine R Sadleir et al. PLoS One. .

Erratum in

  • PLoS One. 2014;9(10):e110914

Abstract

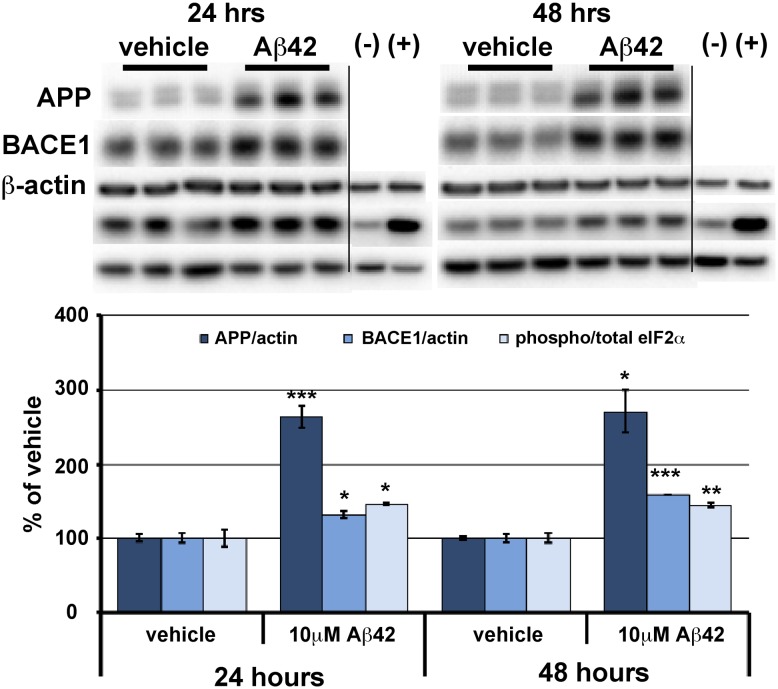
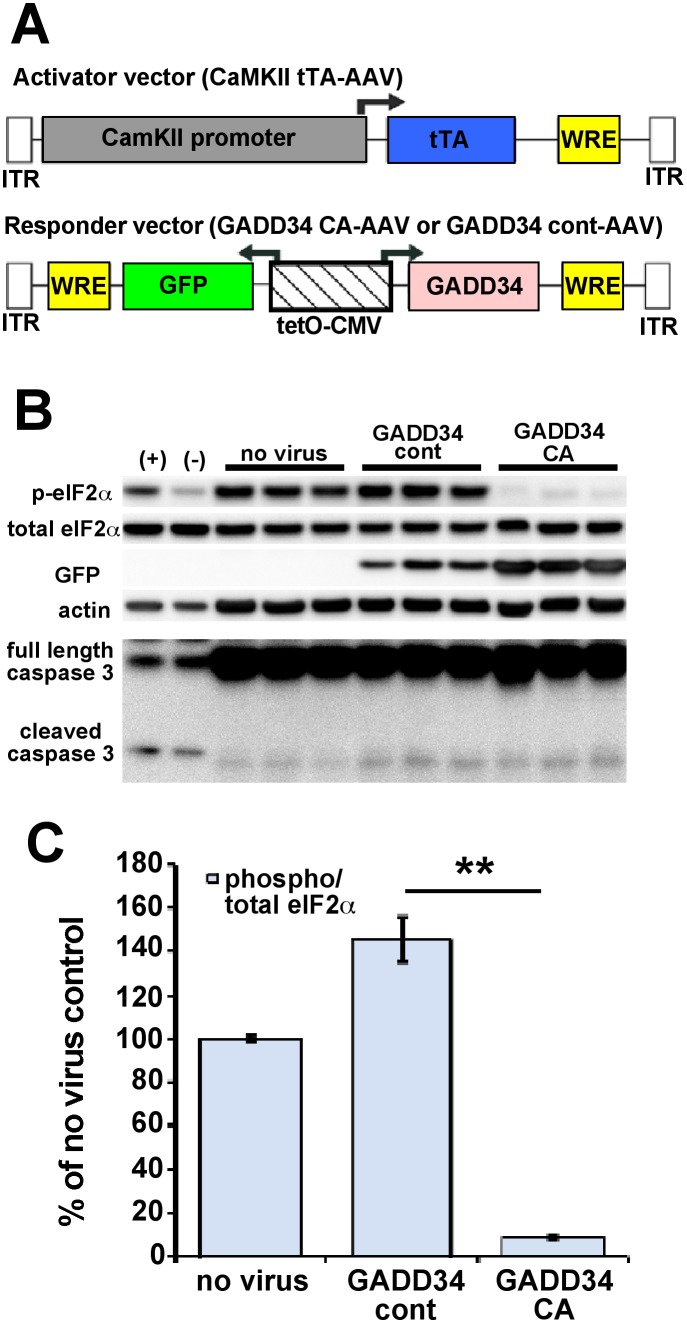
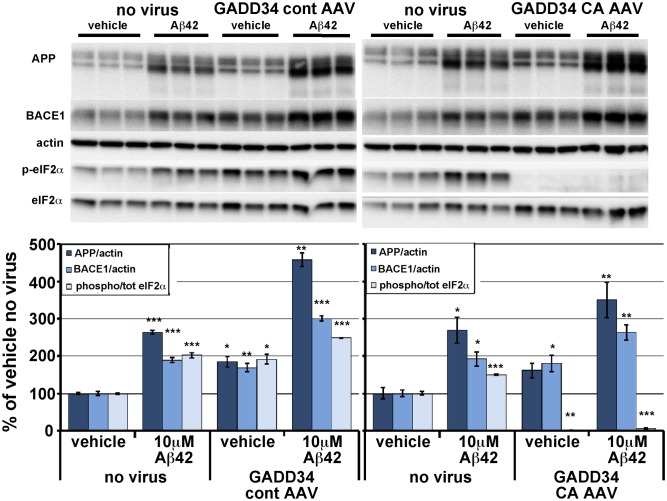
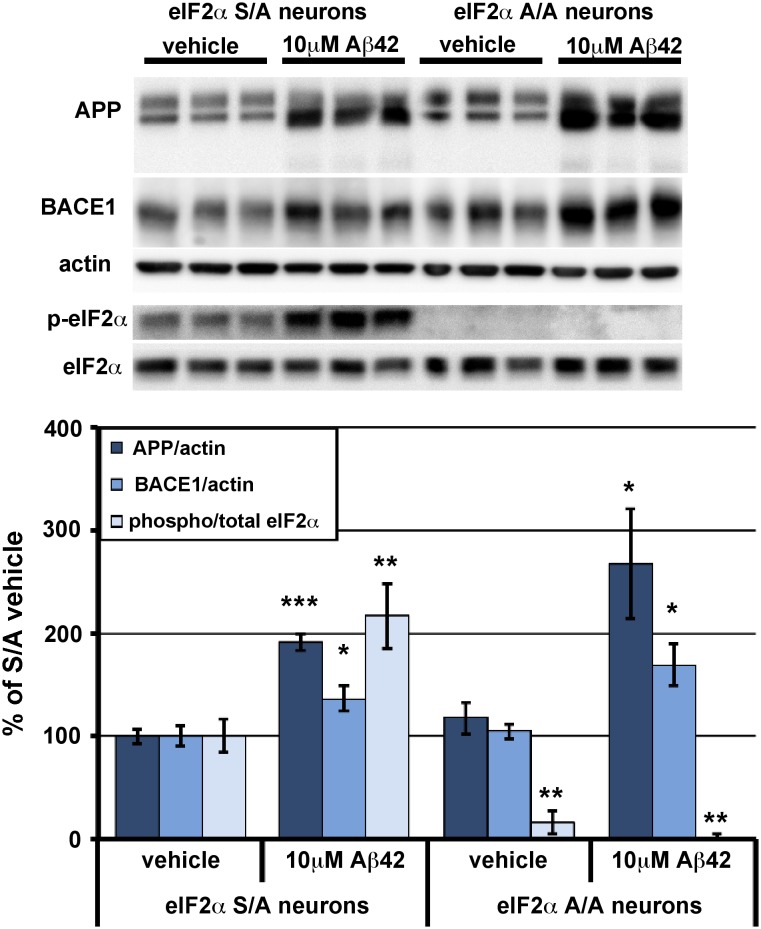
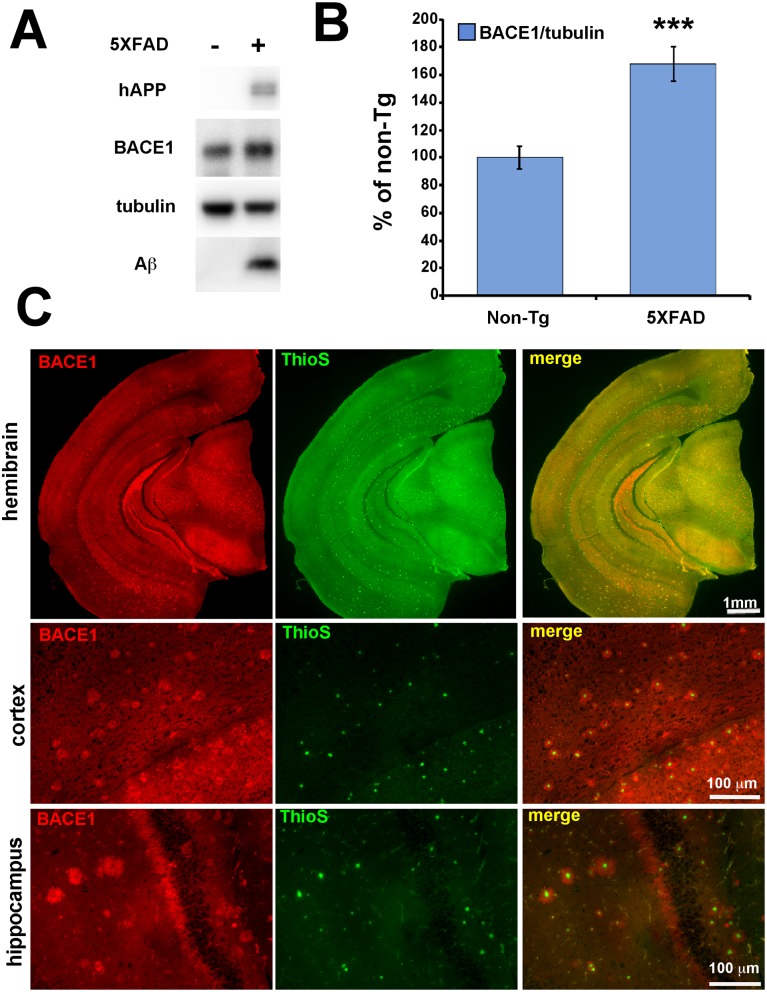
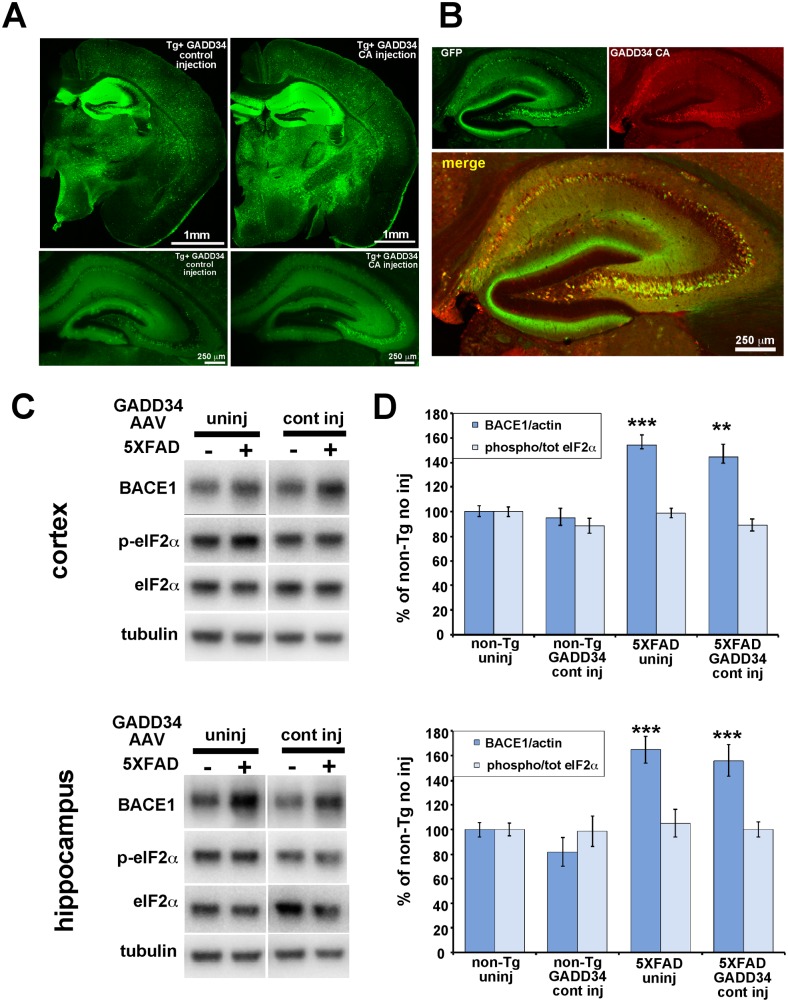
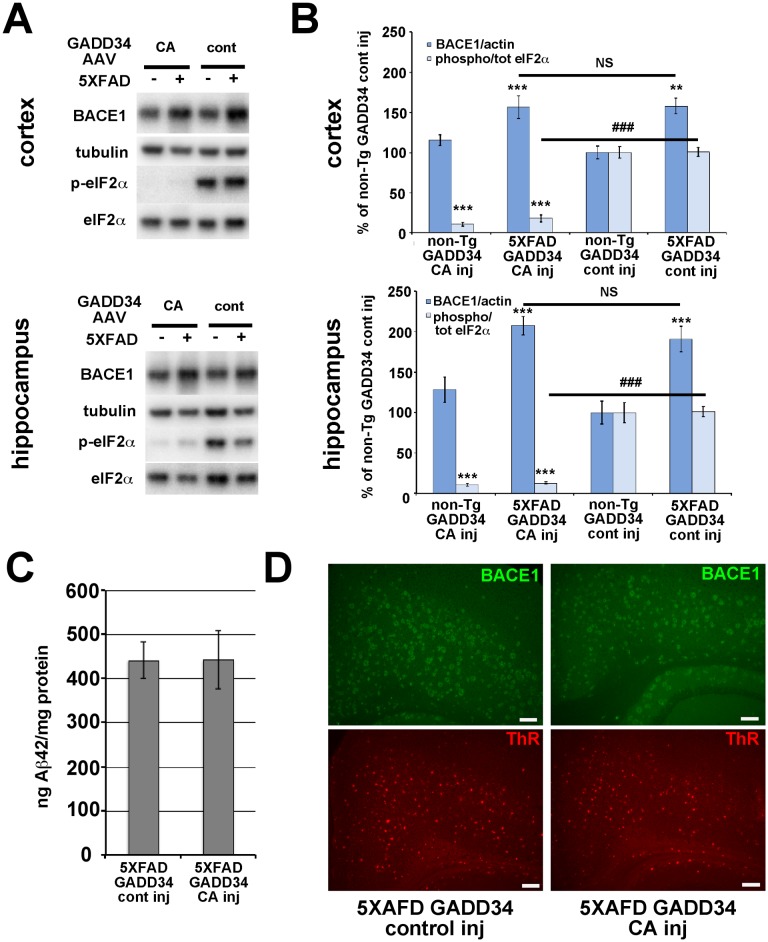
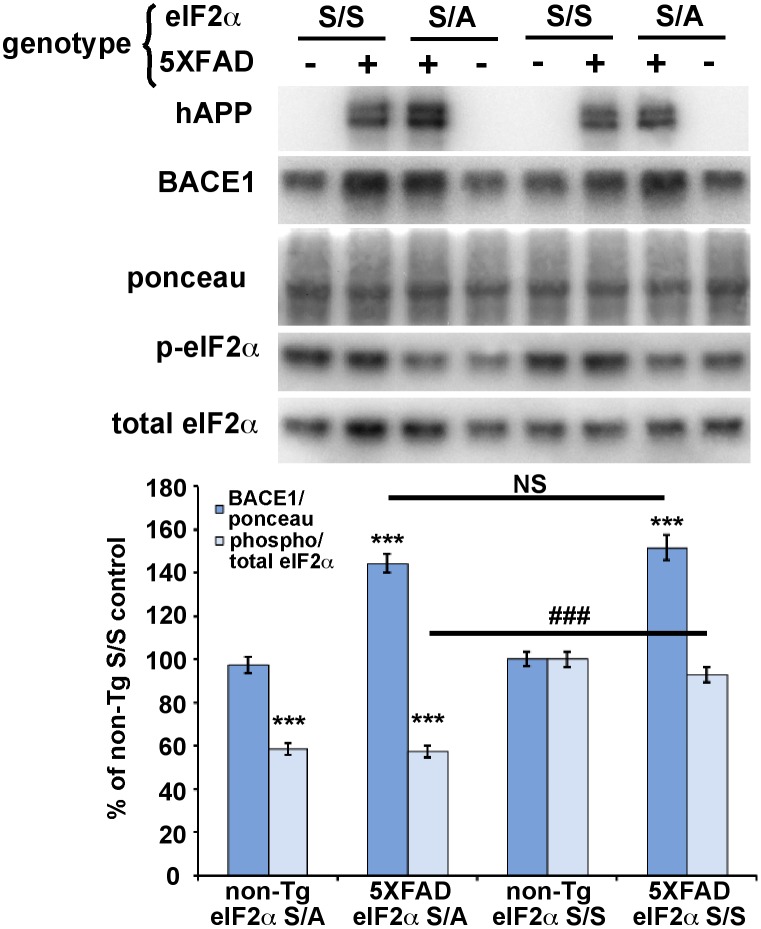
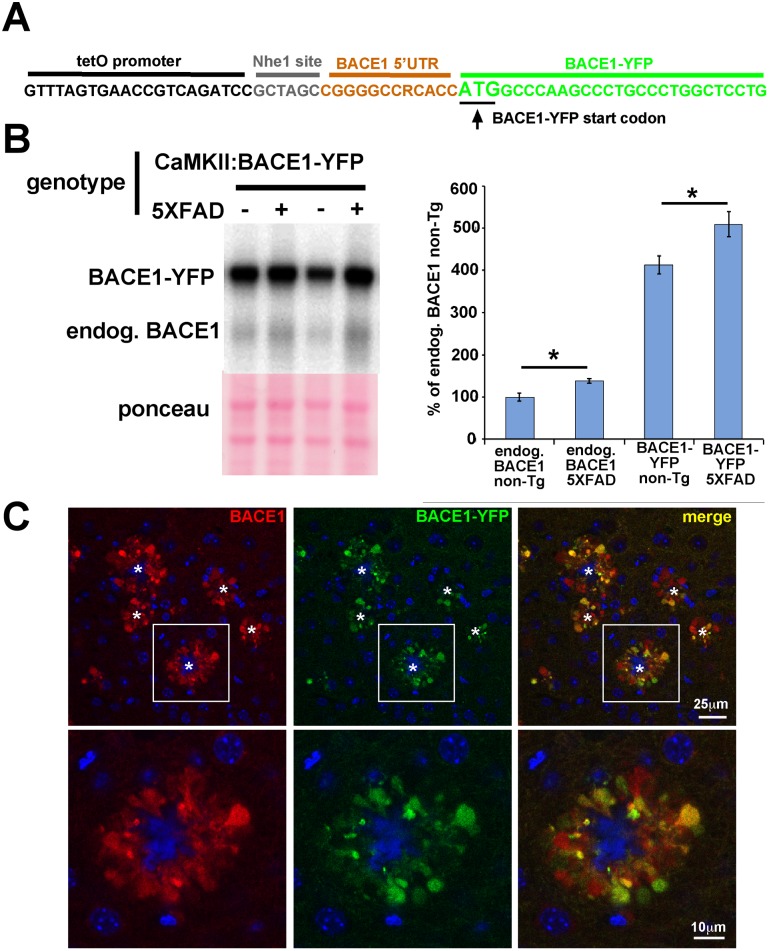
β-site amyloid precursor protein (APP) cleaving enzyme 1 (BACE1) initiates the production of β-amyloid (Aβ), the major constituent of amyloid plaques in Alzheimer's disease (AD). BACE1 is elevated ∼2-3 fold in AD brain and is concentrated in dystrophic neurites near plaques, suggesting BACE1 elevation is Aβ-dependent. Previously, we showed that phosphorylation of the translation initiation factor eIF2α de-represses translation of BACE1 mRNA following stress such as energy deprivation. We hypothesized that stress induced by Aβ might increase BACE1 levels by the same translational mechanism involving eIF2α phosphorylation. To test this hypothesis, we used three different genetic strategies to determine the effects of reducing eIF2α phosphorylation on Aβ-dependent BACE1 elevation in vitro and in vivo: 1) a two-vector adeno-associated virus (AAV) system to express constitutively active GADD34, the regulatory subunit of PP1c eIF2α phosphatase; 2) a non-phosphorylatable eIF2α S51A knockin mutation; 3) a BACE1-YFP transgene lacking the BACE1 mRNA 5' untranslated region (UTR) required for eIF2α translational regulation. The first two strategies were used in primary neurons and 5XFAD transgenic mice, while the third strategy was employed only in 5XFAD mice. Despite very effective reduction of eIF2α phosphorylation in both primary neurons and 5XFAD brains, or elimination of eIF2α-mediated regulation of BACE1-YFP mRNA translation in 5XFAD brains, Aβ-dependent BACE1 elevation was not decreased. Additionally, robust inhibition of eIF2α phosphorylation did not block Aβ-dependent APP elevation in primary neurons, nor did it reduce amyloid pathology in 5XFAD mice. We conclude that amyloid-associated BACE1 elevation is not caused by translational de-repression via eIF2α phosphorylation, but instead appears to involve a post-translational mechanism. These definitive genetic results exclude a role for eIF2α phosphorylation in Aβ-dependent BACE1 and APP elevation. We suggest a vicious pathogenic cycle wherein Aβ42 toxicity induces peri-plaque BACE1 and APP accumulation in dystrophic neurites leading to exacerbated Aβ production and plaque progression.


Conflict of interest statement

Competing Interests: The authors have declared that no competing interests exist.

Figures

Figure 1
Figure 1. BACE1, APP, and phosphorylated eIF2α increase in response to A β42 oligomer treatment of primary neurons.
Mixed cortical primary neurons were isolated from e15.5 mouse embryos, and after 7 days in culture, exposed to 10 µM oligomeric Aβ42 for 24 and 48 hrs. Cells were lysed in RIPA buffer and 10 µg/lane of protein were subjected to immunoblot analysis for APP, BACE1, phosphorylated (p)-eIF2α, total eIF2α, and β-actin as a loading control. (–) and (+) are negative and positive controls for eIF2α phosphorylation (control and UV treated HEK cell lysates, Cell Signaling). APP and BACE1 immunosignal intensities were normalized to those of β-actin. Phosphorylated and total eIF2α immunosignal intensities were measured and phosphorylated:total eIF2α ratio calculated. APP and BACE1 levels and phosphorylated:total eIF2α ratio (all measures displayed as percentage of vehicle control) are all significantly elevated by Aβ42 oligomer treatment at both time points. Bars represent SEM, n = 3 samples per condition, asterisks (*) indicate significant changes compared to respective vehicle, p<0.05*, p<0.01**, p<0.001***.
Figure 2
Figure 2. AAV vectors efficiently transduce primary neurons and block eIF2α phosphorylation with minimal toxicity.
(A) A two-vector adeno-associated virus (AAV) system was used to decrease eIF2α phosphorylation specifically in excitatory forebrain neurons. The “activator” vector (CaMKII tTA-AAV) expresses the tetracycline transactivator (tTA) protein from a calmodulin kinase II (CaMKII) promoter, while the “responder” vector (GADD34 CA-AAV or GADD 34 cont–AAV) expresses GFP and either GADD34 constitutive active (CA) or GADD34 control (cont) from a bi-directional tetracycline operator-CMV promoter (tetO-CMV). All expressed transgenes contain a woodchuck post-trascriptional regulatory element (WRE) to enhance expression. ITR  =  inverted terminal repeat sequences. (B) Mixed cortical primary neurons were isolated from e15.5 mouse embryos and infected with 1×10⁷ viral genomes of CaMKII tTA-AAV and 1×10⁷ viral genomes of GADD34 CA-AAV or GADD 34 cont–AAV per well of a 12 well plate on the day of isolation. No virus was added to other wells as a negative control. Media was changed 48 hours later. After 8 days in culture, neurons were lysed for immunoblot analysis for total eIF2α, phosphorylated (p)-eIF2α, GFP, caspase 3 (full length and activated cleaved 17 kDa fragment), and β-actin as a loading control. (+) are HEK293 cells treated 30 minutes with 1 µM thapsigargin as a positive control for eIF2α phosphorylation, while (–) are untreated HEK293 cells as a negative control. Note that AAV transduction does not cause toxicity as indicated by minimal cleaved caspase 3 fragment. (C) Phosphorylated and total eIF2α immunosignal intensities were measured from the blot in (B) and phosphorylated:total eIF2α ratio (phospho/total eIF2α) was calculated and displayed as percentage of no virus control. Primary neurons transduced with GADD34 CA-AAV had dramatically less eIF2α phosphorylation than neurons transduced with GADD34 cont-AAV or no virus, as demonstrated by phospho/total eIF2α ratio. Note that GADD34 cont-AAV transduction caused a significant elevation of phospho/total eIF2α ratio compared to no virus control. Bars represent SEM, n = 3 samples per condition, p<0.01**.
Figure 3
Figure 3. In primary neurons, GADD34 CA-AAV mediated reduction of eIF2α phosphorylation does not inhibit BACE1 and APP elevation in response to Aβ42 oligomer treatment.
Mixed cortical primary neurons were isolated from e15.5 mouse embryos and infected with 1×10⁷ viral genomes CaMKII tTA-AAV and 1×10⁷ viral genomes of GADD34 CA-AAV or GADD 34 cont–AAV per well of a 12 well plate on the day of isolation. No virus was added to other wells as a negative control. Media was changed 48 hours later. After 7 days in culture, neurons were treated with vehicle or 10 µM Aβ42 oligomers generated as described , , lysed 30 hours later, and 10 µg/lane of protein were subjected to immunoblot analysis for APP, BACE1, total eIF2α, phosphorylated (p)-eIF2α, and β-actin as a loading control. APP and BACE1 immunosignal intensities were normalized to those of β-actin. Phosphorylated and total eIF2α immunosignal intensities were measured and phosphorylated:total eIF2α (phospho/total eIF2α) ratio calculated. All measures are displayed as percentage of no virus vehicle control. Note that levels of APP, BACE1 and p-eIF2α were significantly elevated by either Aβ42 oligomer treatment or GADD34 cont-AAV transduction alone, compared to no virus vehicle control. Similarly, GADD34 CA-AAV transduction alone also elevated APP and BACE1 levels but completely abrogated eIF2α phosphorylation. Interestingly, GADD34 cont-AAV transduction plus Aβ42 treatment increased APP and BACE1 levels and phospho/total eIF2α ratio to even greater extents than either treatment alone. GADD34 CA-AAV transduction plus Aβ42 treatment also elevated APP and BACE1 levels significantly, despite reducing the phospho/total eIF2α ratio to only ∼7% of no virus vehicle control. Bars represent SEM, n = 3 samples per condition, asterisks (*) indicate significant changes compared to “vehicle no virus”, p<0.05*, p<0.01**, p<0.001***.
Figure 4
Figure 4. In primary neurons, genetic reduction of eIF2α phosphorylation via eIF2α S51A knockin mutation does not inhibit BACE1 and APP elevation in response to Aβ42 oligomer treatment.
Mixed cortical primary neurons were isolated from e15.5 mouse embryos that were either homozygous for the eIF2α S51A targeted replacement mutation (A/A) or heterozygous (S/A). After 7 days in culture, neurons were treated with vehicle or 10 µM Aβ42 oligomers, lysed 30 hours later, and 10 µg/lane of protein were subjected to immunoblot analysis for APP, BACE1, total eIF2α, phosphorylated (p)-eIF2α, and β-actin as a loading control. APP and BACE1 immunosignal intensities were normalized to those of β-actin. Phosphorylated and total eIF2α immunosignal intensities were measured and phosphorylated:total eIF2α (phospho/total eIF2α) ratio calculated. All measures are displayed as percentage of S/A vehicle control. As expected, levels of APP, BACE1, and p-eIF2α were significantly elevated by Aβ42 oligomer treatment in S/A neurons, compared to vehicle. Importantly, Aβ42 oligomers caused robust increases of BACE1 and APP levels in A/A neurons, despite complete abrogation of eIF2α phosphorylation. There was no significant difference in BACE1 or APP levels in A/A compared to S/A neurons, eliminating the problem that AAV treatment of primary neurons increases levels of BACE1, APP, and p-eIF2α. The small phospho/total eIF2α ratio in vehicle treated A/A neurons is due to immunoblot background. Bars represent SEM, n = 6 samples per condition, asterisks (*) indicate significant changes compared to S/A vehicle, p<0.05*, p<0.01**.
Figure 5
Figure 5. BACE1 is elevated in 5XFAD transgenic mouse brain, with highest concentrations surrounding amyloid plaques.
(A) Hemibrains from 6 month old 5XFAD (+) mice (n = 17), and non-transgenic (Tg) (–) age-matched controls (n = 13) were homogenized and 20 µg/lane of protein were subjected to immunoblot analysis for transgenic human (h) APP, BACE1, Aβ, and βIII-tubulin as a loading control. (B) hAPP and BACE1 immunosignal intensities were normalized to those of βIII-tubulin and displayed as percentage of non-Tg control. Note that 5XFAD mice have significantly elevated levels of BACE1 and Aβ compared to non-Tg controls, as detected by BACE1 antibody clone 3D5 and human APP/Aβ antibody clone 6E10, respectively. Bars represent SEM, asterisks (*) indicate significant changes compared to non-Tg control, p<0.001***, (C) Coronal brain sections from 5XFAD mice were co-stained with anti-BACE1 antibody (red) and Thioflavin S (green) for fibrillar amyloid and imaged by fluorescence microscopy. At low magnification, high levels of BACE1 (red) are readily observed in mossy fibers of the hippocampus, which is the normal localization pattern of BACE1 in the brain (BACE1, first row). At high magnification, BACE1 (red) is shown to concentrate abnormally in an annulus that immediately surrounds the fibrillar amyloid plaque core (green; cortex, second row; hippocampus, third row). Scale bars = 1 mm, first row; 100 µm, second and third rows.
Figure 6
Figure 6. Two-vector AAV system effectively transduces mouse brain, and GADD34 control AAV transduction does not elevate levels of BACE1 or phosphorylated eIF2α in the brain.
5XFAD or non-Tg pups were injected on postnatal day 0 into lateral ventricles with 2 µl per hemisphere containing 6.6×10¹⁰ viral genomes of GADD34 CA-AAV or GADD 34 cont–AAV plus 6.9×10¹⁰ viral genomes of CaMKII tTA-AAV. Mice were aged to 6 months and brains harvested for immunoblot, and immunofluorescence microscopy analysis. (A) GFP fluorescence in coronal brain sections of 6 month-old 5XFAD mice injected with GADD 34 cont–AAV (left column) or GADD34 CA-AAV (right column) shows comparable expression levels of GFP from both transduced AAV vectors. Upper row: entire hemibrain sections showing wide-spread GFP expression, especially in the hippocampus. Lower row: lower exposure of hippocampus showing cellular GFP expression. The AAV serotype 1 with the CaMKII promoter effectively drives expression in excitatory forebrain neurons, with particularly high expression in the hippocampus. Scale bar  =  1 mm (top row), 250 µm (bottom row). (B) Low exposure high magnification image of a section of the hippocampus from a mouse transduced with GADD34 CA-AAV stained with an antibody against GADD34 (red) shows high co-localization of GADD34 CA and GFP in neurons of the CA regions, indicating that GFP fluorescence is an effective proxy marker for GADD34 expression Scale bar = 250 µm. (C) 20 µg/lane of cortex or hippocampus homogenate from 6 month-old 5XFAD (+) and non-Tg (–) mice either uninjected (uninj) or GADD 34 cont–AAV injected (cont inj) were subjected to immunoblot analysis for BACE1, total eIF2α, phosphorylated (p)-eIF2α, and βIII-tubulin as a loading control. All samples were transferred onto a single piece of PVDF membrane, as described in Methods, and representative blots are shown here. (D) BACE1 immunosignal intensities were normalized to those of βIII-tubulin. Phosphorylated and total eIF2α immunosignal intensities were measured and phosphorylated:total eIF2α (phospho/total eIF2α) ratio calculated. All measures are displayed as percentage of uninjected non-Tg control. Comparison of GADD34 cont–AAV injected mice with genotype-matched uninjected mice shows that there is no effect on BACE1 or p-eIF2α levels from AAV brain injection itself. n = 9–15 mice per group. Bars represent SEM. Asterisks (*) indicate significant difference from non-Tg uninj p<0.01**, p<0.001***.
Figure 7
Figure 7. GADD34 CA-AAV effectively inhibits eIF2α phosphorylation in 5XFAD brain but does not block amyloid-associated BACE1 elevation.
5XFAD or non-Tg pups were injected on postnatal day 0 into lateral ventricles with 2 µl per hemisphere of 6.6×10¹⁰ viral genomes of GADD34 CA-AAV or GADD 34 cont–AAV plus 6.9×10¹⁰ viral genomes of CaMKII tTA-AAV. Mice were aged to 6 months and brains harvested for immunoblot and immunofluorescence microscopy analysis. (A) 20 µg/lane of cortex or hippocampus homogenate from 6 month-old 5XFAD (+) and non-Tg (–) mice either GADD34 CA-AAV injected (CA) or GADD 34 cont–AAV injected (cont) were subjected to immunoblot analysis for BACE1, total eIF2α, phosphorylated (p)-eIF2α, and βIII-tubulin as a loading control. All samples were transferred onto a single piece of PVDF membrane, as described in Methods, and representative blots are shown here. (B) BACE1 immunosignal intensities were normalized to those of βIII-tubulin. Phosphorylated and total eIF2α immunosignal intensities were measured and phosphorylated:total eIF2α (phospho/total eIF2α) ratio calculated. All measures are displayed as percentage of GADD 34 cont–AAV injected non-Tg control. BACE1 levels were elevated in GADD 34 cont–AAV transduced 5XFAD cortex and hippocampus compared to non-Tg, as expected. Importantly, GADD34 CA-AAV transduction reduced p-eIF2α levels by ∼85–90% compared to GADD34 cont-AAV transduction in both 5XFAD and non-Tg cortex and hippocampus. Despite this dramatic inhibition of eIF2α phosphorylation, BACE1 levels were elevated in GADD34 CA-AAV transduced 5XFAD cortex and hippocampus to the same extent as in GADD34 cont-AAV transduced 5XFAD cortex and hippocampus. n = 6–15 mice per group, bars represent SEM, asterisks (*) indicate significant changes compared to non-Tg GADD34 cont-AAV control, NS  =  not significant, p<0.05*, p<0.01**, p<0.001***, (#) represents significant difference between 5XFAD GADD34 cont-AAV and 5XFAD GADD34 CA-AAV p<0.001 ###. (C) Cortical homogenates from 5XFAD mice injected with either GADD 34 cont–AAV or GADD34 CA-AAV were prepared for measurement of total (soluble plus insoluble) Aβ42 levels (ng/mg total protein) by ELISA (Methods). No significant difference in total Aβ42 level between GADD34 CA-AAV and GADD34 cont-AAV brain transduction was observed. Bars represent SEM (D) Coronal brain sections of representative GADD34 CA-AAV or GADD34 cont-AAV transduced 5XFAD mice co-stained with anti-BACE1 antibody (green) and thiazine red (ThR) for fibrillar amyloid, then imaged by fluorescence microscopy. Both the intensities of BACE1 immunostaining and fibrillar plaque load signal appear unaffected by reduction of eIF2α phosphorylation via GADD34 CA-AAV transduction, thus corroborating our immunoblot analysis that phosphorylated eIF2α does not mediate amyloid-associated BACE1 elevation. Each image is taken at 10x objective magnification, at the same exposure, from the cortex just above hippocampal region CA3. Scale bar = 100 µm.
Figure 8
Figure 8. Genetic reduction of eIF2α phosphorylation via eIF2α S51A knockin mutation does not block amyloid-associated BACE1 elevation in 5XFAD brain.
5XFAD mice were crossed with mice harboring the eIF2α S51A targeted replacement mutation to generate 5XFAD (+) or non-Tg (–) offspring that were either heterozygous for the eIF2α S51A knockin mutation (S/A) or wild-type (S/S). Mice were aged to 12 months, brains harvested, and homogenates prepared. 20 µg/lane of brain homogenate were subjected to immunoblot analysis for transgenic human (h) APP, BACE1, total eIF2α, and phosphorylated (p)-eIF2α. All samples were transferred onto a single piece of PVDF membrane and stained with ponceau S as a protein loading control, as described in Methods. For quantification, BACE1 immunosignal intensity was normalized to ponceau S staining intensity for a given lane. Phosphorylated and total eIF2α immunosignal intensities were measured and phosphorylated:total eIF2α (phospho/total eIF2α) ratio calculated for a given lane. The means of each group were calculated and means displayed as percentage of the mean non-Tg S/S control. Both non-Tg and 5XFAD mice that were also heterozygous for the eIF2α S51A knockin mutation had a ∼40% reduction in phospho/total eIF2α ratio compared to their S/S counterparts; presumably, the phospho/total eIF2α ratios did not reach the expected 50% reduction because of a high non-specific background on the p-eIF2α immunoblot or partial compensatory increased phosphorylation of the wild type allele. Importantly, BACE1 level in 5XFAD; S/A brain showed an amyloid-associated elevation that was equivalent to that of 5XFAD; S/S brain, despite the 40% reduction in phospho/total eIF2α ratio. n = 19–30 mice per group. Bars represent SEM, asterisks (*) indicate significant changes compared to non-Tg S/S control, p<0.05*, p<0.01**, p<0.001***, NS  =  not significant, (#) indicates significant difference between 5XFAD S/S and 5XFAD S/A p<0.001 ###.
Figure 9
Figure 9. BACE1-YFP expressed from a transgene with a truncated BACE1 mRNA 5′ UTR is also elevated and accumulates around amyloid plaques in 5XFAD brain.
(A) 5′ UTR of BACE1-YFP transgene. The BACE1-YFP coding region (green) was subcloned into the tetO promoter vector PMM400 (black) via an NheI site (gray) , leaving a severely truncated BACE1 mRNA 5′ UTR (orange) consisting of only eleven nucleotides that lack the uORFs required for de-repression of translation by phosphorylated eIF2α. (B) 5XFAD mice were crossed with BACE1-YFP transgenic mice to generate 5XFAD (+) and non-Tg (–) offspring that also expressed the BACE1-YFP transgene. 5XFAD and non-Tg offspring that lacked the BACE1-YFP transgene were also generated. At 6–8 months of age, cortices of 5XFAD; BACE1-YFP, non-Tg; BACE1-YFP, 5XFAD, and non-Tg littermates (n = 5 for each group) were harvested, homogenized, and 20 µg/lane of homogenates were subjected to immunoblot analysis for BACE1 using the 3D5 anti-BACE1 antibody. The immunoblot was stained with ponceau S as a protein loading control. Representative BACE1-YFP immunoblot signals are shown. BACE1-YFP runs at ∼90 kDa on SDS-PAGE, compared to ∼65 kDa for endogenous (endog.) BACE1. For quantification, BACE1 and BACE1-YFP immunosignal intensities were normalized to ponceau S staining intensity for a given lane. The means of each group were calculated and means displayed as percentage of the mean BACE1 level in non-Tg control. The BACE1-YFP transgene is expressed at levels that are ∼4-fold higher than that of endogenous BACE1. As expected, endogenous BACE1 level is significantly elevated in 5XFAD brain compared to non-Tg brain. Most importantly, BACE1-YFP levels also exhibit a significant amyloid-associated elevation with the 5XFAD genotype compared to the non-Tg genotype, despite the complete absence of uORFs necessary for regulation by eIF2α phosphorylation. Bars represent SEM, asterisks (*) indicate significant changes compared to respective non-Tg control, p<0.05*. (C) Sagittal section of representative 5XFAD; BACE1-YFP cortex stained with anti-BACE1 antibody and imaged for BACE1 immunofluorescence (red) and YFP fluorescence (green) by confocal microscopy. Upper row shows lower magnification of several amyloid plaques (stars) each surrounded by an annulus of punctate accumulations of BACE1 and BACE1-YFP. Lower row shows higher magnification image of boxed inset in upper row. Our previous work has identified these BACE1 accumulations as swollen dystrophic axons and presynaptic terminals . Note the extensive co-localization of BACE1 and BACE1-YFP, although their relative levels appear to vary somewhat in different dystrophies. These results demonstrate that BACE1-YFP accumulates around plaques in the same pattern as endogenous BACE1. Blue in the center of the annulus represents the amyloid plaque core, marked with (*). Blue outside of the annulus indicates DAPI-stained nuclei.

Similar articles

Cited by

References

    1. Sisodia SS, St George-Hyslop PH (2002) gamma-Secretase, Notch, Abeta and Alzheimer’s disease: where do the presenilins fit in? Nat Rev Neurosci 3: 281–290. - PubMed
    1. Tanzi RE (2012) The genetics of Alzheimer disease. Cold Spring Harb Perspect Med 2. - PMC - PubMed
    1. Koffie RM, Meyer-Luehmann M, Hashimoto T, Adams KW, Mielke ML, et al. (2009) Oligomeric amyloid beta associates with postsynaptic densities and correlates with excitatory synapse loss near senile plaques. Proc Natl Acad Sci U S A 106: 4012–4017. - PMC - PubMed
    1. Klein WL, Stine WB Jr, Teplow DB (2004) Small assemblies of unmodified amyloid beta-protein are the proximate neurotoxin in Alzheimer’s disease. Neurobiol Aging 25: 569–580. - PubMed
    1. Yun SH, Gamkrelidze G, Stine WB, Sullivan PM, Pasternak JF, et al. (2006) Amyloid-beta1–42 reduces neuronal excitability in mouse dentate gyrus. Neurosci Lett 403: 162–165. - PMC - PubMed

Publication types

MeSH terms

Substances