. 2014 Jul 4;15(1):554.
doi: 10.1186/1471-2164-15-554.

De novo transcriptome analysis of petal senescence in Gardenia jasminoides Ellis

Affiliations

De novo transcriptome analysis of petal senescence in Gardenia jasminoides Ellis

Georgios F Tsanakas et al. BMC Genomics. .

Abstract

Background: The petal senescence of ethylene insensitive species has not been investigated thoroughly while little is known about the temporal and tissue specific expression patterns of transcription factors (TFs) in this developmental process. Even less is known on flower senescence of the ornamental pot plant Gardenia jasminoides, a non climacteric flower with significant commercial value.

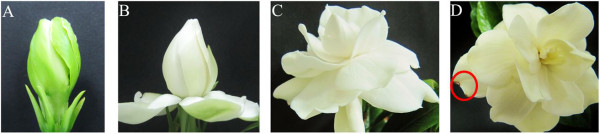
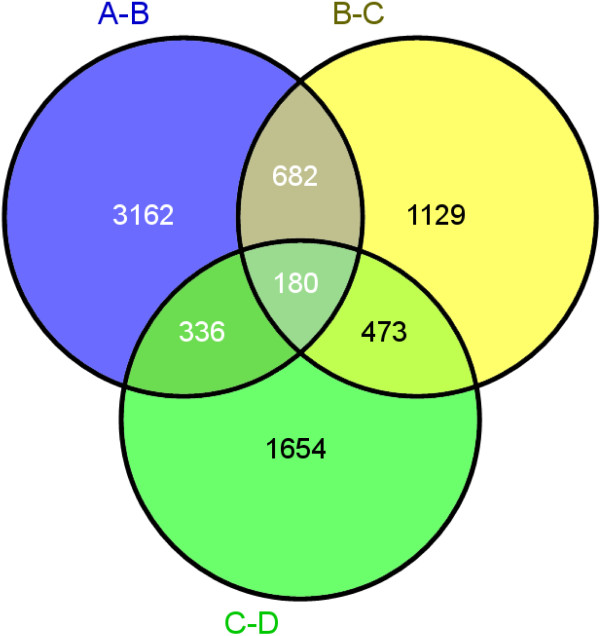
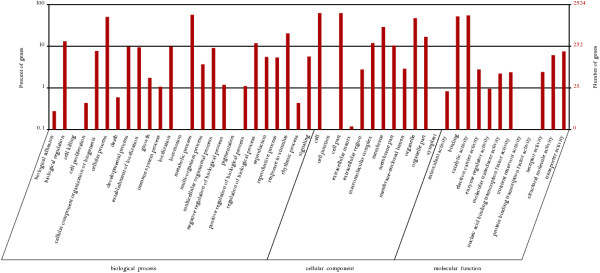
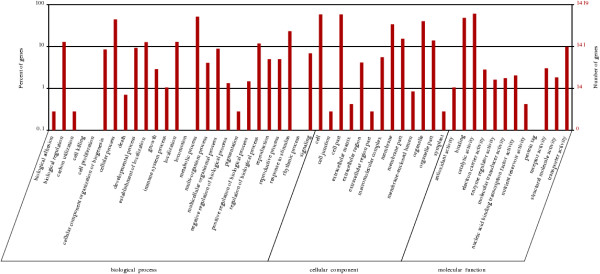
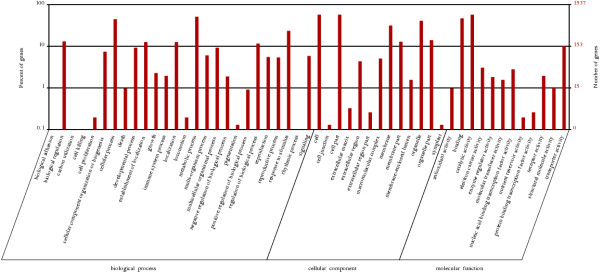
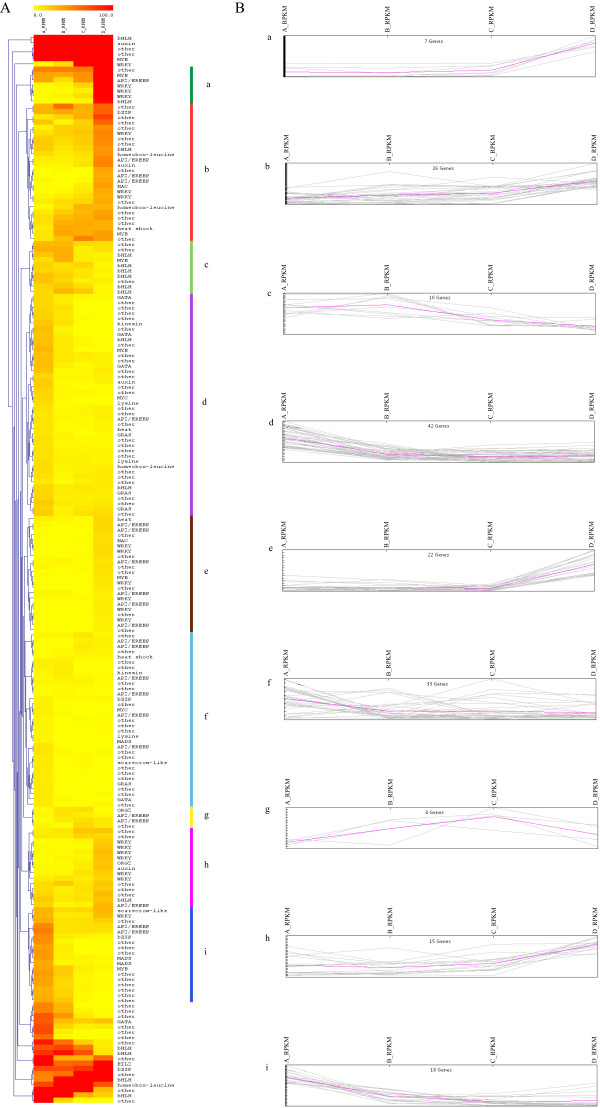
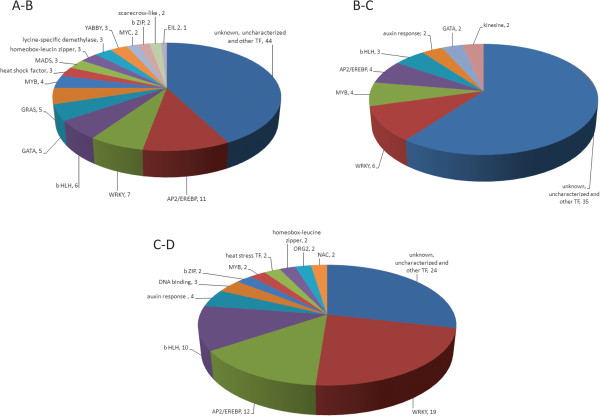
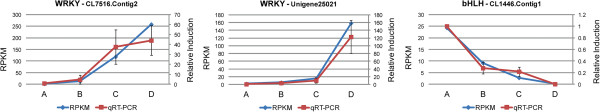
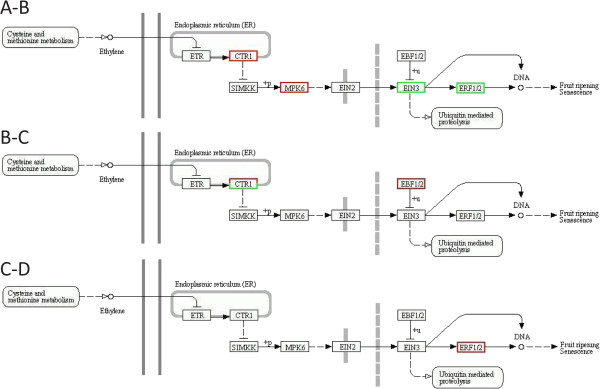
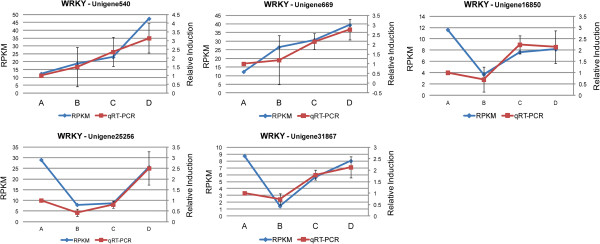
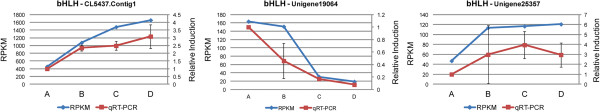
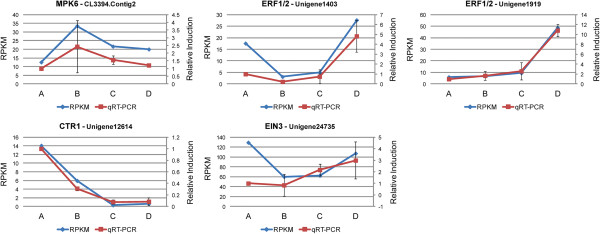
Results: We initiated a de novo transcriptome study to investigate the petal senescence in four developmental stages of cut gardenia flowers considering that the visible symptoms of senescence appear within 4 days of flower opening. De novo assembly of transcriptome sequencing resulted in 102,263 contigs with mean length of 360 nucleotides that generated 57,503 unigenes. These were further clustered into 20,970 clusters and 36,533 singletons. The comparison of the consecutive developmental stages resulted in 180 common, differentially expressed unigenes. A large number of Simple Sequence Repeats were also identified comprising a large number of dinucleotides and trinucleotides. The prevailing families of differentially expressed TFs comprise the AP2/EREBP, WRKY and the bHLH. There are 81 differentially expressed TFs when the symptoms of flower senescence become visible with the most prevailing being the WRKY family with 19 unigenes. No other WRKY TFs had been identified up to now in petal senescence of ethylene insensitive species. A large number of differentially expressed genes were identified at the initiation of visible symptoms of senescence compared to the open flower stage indicating a significant shift in the expression profiles which might be coordinated by up-regulated and/or down-regulated TFs. The expression of 16 genes that belong to the TF families of WRKY, bHLH and the ethylene sensing pathway was validated using qRT--PCR.

Conclusion: This de novo transcriptome analysis resulted in the identification of TFs with specific temporal expression patterns such as two WRKYs and one bHLH, which might play the role of senescence progression regulators. Further research is required to investigate their role in gardenia flowers in order to develop tools to delay petal senescence.


Figures

Figure 1
Figure 1
Blooming stages of gardenia flower. (A) Flower bud, one day prior to opening (B) Opened flower with horizontally aligned outer petals (C) Fully opened flower with expanded petals, (D) Senescent flower that has been discolored to yellow pale and the first necrotic spot in petals are visible.
Figure 2
Figure 2
Gene Ontology classification of the total assembled unigenes. The left side and the right side of the panel show the percentage of genes and the number of genes that are classified in the corresponding term, respectively.
Figure 3
Figure 3
COG classification of the gardenia transcriptome.
Figure 4
Figure 4
Venn diagrams of the unique, differentially expressed unigenes in three pairs of the developmental stages. (A-B) Differentially expressed unigenes in the transition from stage A to stage B (B-C) Differentially expressed unigenes in the transition from stage B to stage C (C-D) Differentially expressed unigenes in the transition from stage C to stage D.
Figure 5
Figure 5
Gene Ontology classification of the differentially expressed unigenes of the progression from stage A to stage B. The left side and the right side of the panel show the percentage of genes and the number of genes that are classified in the corresponding term, respectively.
Figure 6
Figure 6
Gene Ontology classification of the differentially expressed unigenes of the progression from stage B to stage C. The left side and the right side of the panel show the percentage of genes and the number of genes that are classified in the corresponding term, respectively.
Figure 7
Figure 7
Gene Ontology classification of the differentially expressed unigenes of the progression from stage C to stage D. The left side and the right side of the panel show the percentage of genes and the number of genes that are classified in the corresponding term, respectively.
Figure 8
Figure 8
Hierarchical clustering and expression patterns of differentially expressed TFs during senescence. (A) Hierarchical clustering of the differentially expressed TFs using Euclidean distance. On the right side bars of various colours are used to determine distinct clusters (B) Expression patterns that correspond to the clusters of the histogram. Each line represents a transcript in the corresponding senescent stage where expression values are represented as RPKM values.
Figure 9
Figure 9
The differentially expressed TF unigenes between sequential stages of senescence.
Figure 10
Figure 10
Differentially expressed TFs throughout senescence. Patterns of expression of two WRKY transcripts, the CL7516.Contig2 and the Unigene25021 and one bHLH transcript, the CL1446.Contig1 determined by qRT-PCR (relative induction compared to stage A) and RNAseq (RPKM values). Error bars represent the standard deviation of the means.
Figure 11
Figure 11
The ethylene sensing pathway. (A-B) Unigenes that participate in the ethylene sensing pathway and are differentially expressed in the transition from stage A to stage B (B-C) Unigenes that participate in the ethylene sensing pathway and are differentially expressed in the transition from stage B to stage C (C-D) Unigenes that participate in the ethylene sensing pathway and are differentially expressed in the transition from stage C to stage D. A red frame indicates up-regulated unigenes and a green frame indicates down-regulated unigenes.
Figure 12
Figure 12
Expression profiles of five WRKY transcripts. Patterns of expression of five WRKY transcripts, the Unigene540, Unigene669, Unigene16850, Unigene25256 and Unigene31867 determined by qRT-PCR (relative induction compared to stage A) and RNAseq analysis (RPKM values). Error bars represent the standard deviation of the means.
Figure 13
Figure 13
Expression profiles of three bHLH transcripts. Patterns of expression of three bHLH transcripts, the CL5437.Contig1, Unigene19064 and Unigene25357 determined by qRT-PCR (relative induction compared to stage A) and RNAseq analysis (RPKM values). Error bars represent the standard deviation of the means.
Figure 14
Figure 14
Expression profiles of five ethylene sensing transcripts. Patterns of expression of MPK6 (CL3394.Contig2), ERF1/2 (Unigene1403), ERF1/2 (Unigene1919), CTR1 (Unigene12614) and EIN3 (Unigene24735), determined by qRT-PCR (relative induction compared to stage A) and RNAseq analysis (RPKM values). Error bars represent the standard deviation of the means.

References

    1. Arora A. Chapter 4. Biochemistry of Flower Senescence. In: Paliyath G, Murr DP, Handa AK, Lurie S, editors. Postharvest Biol Technol Fruits, Veg Flowers. Iowa, USA: Wiley-Blackwell Publishing; 2008. pp. 51–85.
    1. Rogers HJ. From models to ornamentals: how is flower senescence regulated? Plant Mol Biol. 2013;82(6):563–574. doi: 10.1007/s11103-012-9968-0. - DOI - PubMed
    1. Vlad F, Tiainen P, Owen C, Spano T, Daher FB, Oualid F, Senol NO, Vlad D, Myllyharju J, Kalaitzis P. Characterization of two carnation petal prolyl 4 hydroxylases. Physiol Plant. 2010;140:199–207. doi: 10.1111/j.1399-3054.2010.01390.x. - DOI - PubMed
    1. Shibuya K. Molecular Mechanisms of Petal Senescence in Ornamental Plants Kenichi Shibuya. J Japanese Soc Hortic Sci. 2012;81:140–149. doi: 10.2503/jjshs1.81.140. - DOI
    1. Arora A, Watanabe S, Ma B, Takada K, Ezura H. A novel ethylene receptor homolog gene isolated from ethylene-insensitive flowers of gladiolus (Gladiolus grandiflora hort.) Biochem Biophys Res Commun. 2006;351:739–744. doi: 10.1016/j.bbrc.2006.10.111. - DOI - PubMed

Publication types