. 2015 Jan;29(1):65-79.
doi: 10.1038/eye.2014.144. Epub 2014 Jul 4.

Current concepts in the diagnosis, pathogenesis and management of nonarteritic anterior ischaemic optic neuropathy

Affiliations

Current concepts in the diagnosis, pathogenesis and management of nonarteritic anterior ischaemic optic neuropathy

N R Miller et al. Eye (Lond). 2015 Jan.

Abstract

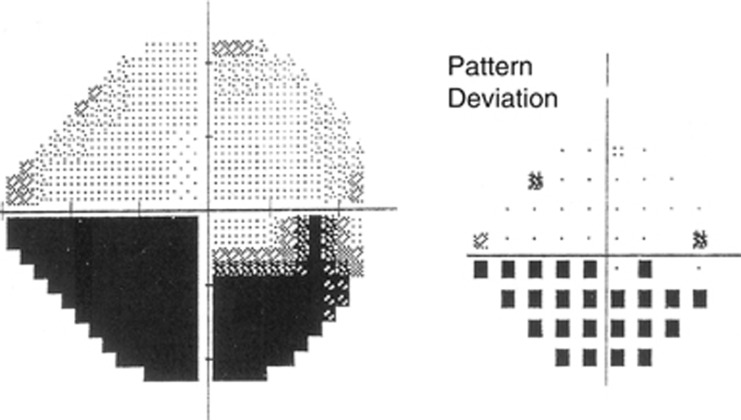
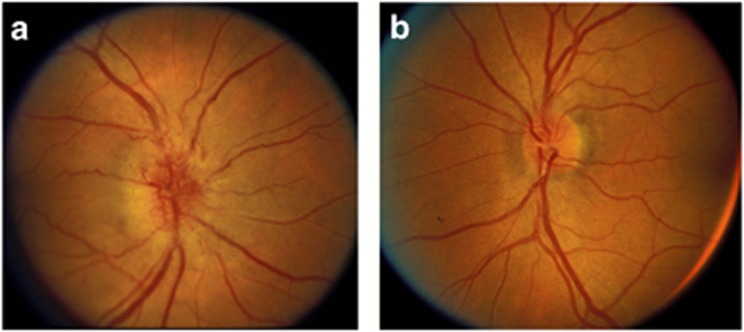
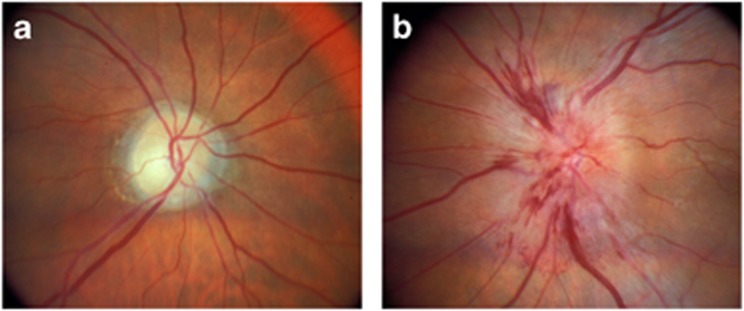
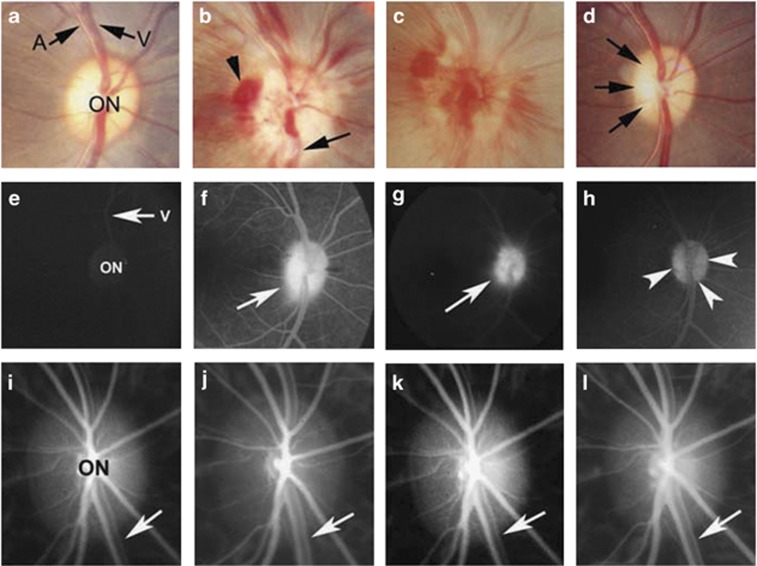
Nonarteritic anterior ischaemic optic neuropathy (NAION) is the most common acute optic neuropathy in patients over the age of 50 and is the second most common cause of permanent optic nerve-related visual loss in adults after glaucoma. Patients typically present with acute, painless, unilateral loss of vision associated with a variable visual field defect, a relative afferent pupillary defect, a swollen, hyperaemic optic disc, and one or more flame-shaped peripapillary retinal haemorrhages. The pathogenesis of this condition is unknown, but it occurs primarily in patients with structurally small optic discs that have little or no cup and a variety of underlying vascular disorders that may or may not be known at the time of visual loss. There is no consistently beneficial medical or surgical treatment for the condition, but there are now animal models that allow testing of various potential therapies. About 40% of patients experience spontaneous improvement in visual acuity. Patients in whom NAION occurs in one eye have a 15-19% risk of developing a similar event in the opposite eye over the subsequent 5 years.


Figures

Figure 1
Figure 1
Typical inferior altitudinal/arcuate visual field defect in NAION.
Figure 2
Figure 2
Appearance of affected and unaffected optic discs in a patient with NAION. a, optic disc in eye with NAION is swollen and hyperaemic. Note several peripapillary flame-shaped haemorrhages. b, optic disc in unaffected eye is small and has no cup.
Figure 3
Figure 3
Patient with incipient NAION. The patient had previously experienced an attack of NAION in his right eye. He was seen for a routine evaluation. Vision in the right eye was 6/60. He had no visual concerns with respect to his left eye. Left eye vision was 6/6 and the field was full. a, the right optic disc is diffusely pale; it has no cup. The retinal arteries are diffusely and focally narrowed. b, the left optic disc is swollen and hyperaemic. There are multiple flame-shaped peripapillary haemorrhages present. The patient subsequently experienced visual loss in the eye about 1 week later.
Figure 4
Figure 4
Clinical and angiographic findings in primate model of NAION (pNAION). (a–d) Optic disc colour photographs. (a) Before induction of pNAION, the optic disc (ON) is normal in appearance, and the retinal arteries (A) and veins (V) are not obscured. Note that the disc has almost no central cup, thus mimicking a human ‘disc-at -risk.' (b) Optic disc appearance 1-day post-induction. The disc is pale and swollen, with blurring of the retinal nerve fibre layer and obscuration of vessels as they cross the disc (arrow). Several peripapillary haemorrhages are present (arrowhead). (c) Seven days post-induction, optic disc oedema is increased and extensive haemorrhages overlie and surround the disc. (d) Seventy days post-induction, optic disc oedema has resolved and the disc is now pale, particularly temporally (arrows); the previously noted haemorrhages have also resolved. (e–h) Intravenous fluorescein angiography (IVFA) late phase (5-min post-dye injection). (e) Before induction. ON margins are sharply defined (arrowheads); there is no dye leakage. (f) Seven days post-induction, arteriovenous phase, there is generalized dye leakage from the optic disc, particularly from its temporal aspect (arrow). The margins of the disc are obscured. A peripapillary splinter haemorrhage is present at 3 o'clock. (g) Fourteen days post-induction, dye leakage persists and appears more generalized and the disc margins remain obscured (arrow). (h) Twenty-eight days post-induction, there is no dye leakage, only diffuse disc staining (arrowheads), suggesting re-establishment of an intact blood brain barrier. (i–l) High-resolution retinal ICG angiography (ICGA). (i) Before induction. The retina: ON border is sharply defined, and there is laminar blood flow in the veins (double arrowheads). Normal choroidal blood flow is definable by fine whitish streaks. (j) One-day post-induction. No disruption of either choroidal or intra-retinal blood flow is discernable. (k) Seven days post-induction. Choroidal and retinal blood flow remain intact. (l) Four weeks post-induction. There is no disruption of either retinal or choroidal blood flow; venous blood flow is laminar. (Reproduced with permission from Chen et al, copyright holder ARVO).
Figure 5
Figure 5
Clinical electrophysiology of control (blue lines) and 7-s pNAION-induced (red lines) eyes. The upper panel shows visual evoked potential (VEP) in both eyes at baseline (pre-induction), 1 week post induction, 2 weeks post induction, and 9 weeks post induction. At baseline, the VEPs are equal in the two eyes; however, at 1 week there is a reduction in the VEP amplitude from the pNAION eye, whereas the VEP amplitude in the control eye remains normal. The reduction in VEP amplitude in the pNAION eye persists at 2 and 9 weeks, whereas the VEP amplitude in the control eye remains normal. Note that the latency of the P100 peak remains normal in both eyes throughout the period of observation. The lower panel shows the pattern electroretinogram (PERG) of control and 7-s pNAION eyes during the same period as the VEP. At baseline, the PERG is normal in both eyes and remains normal in both eyes 1 week after induction; however, by 2 weeks post induction, there is a large reduction in the N95 PERG amplitude in the pNAION eye compared with the control eye, suggesting that intraocular retinal ganglion cell (RGC) function has declined following the optic nerve infarct. This reduction is still present at 9 weeks. The delay in PERG reduction suggests that, at least in this animal, RGC damage does not occur immediately. (Reproduced with permission from Chen et al, copyright holder ARVO).
Figure 6
Figure 6
SMI312 (red) and Iba1 (green) immunolabelling of the optic nerve (ON) in a control ON (a) and in the optic nerve from an eye with rodent-induced anterior ischaemic optic neuropathy (rAION) 3 days after induction (b, c). Sections are counterstained with Hoechst for the cell nuclei. (a) The normal ON shows intact neurofilaments characterized by intense SMI312 immunostaining in the anterior, intrascleral and retroscleral portions of the ON. (b, c) In a rAION-induced ON, SMI312 staining is intense in the anterior and retroscleral ON (arrows in b), but there is significant disruption of labelled neurofilaments in the axons in the intrascleral and immediate retroscleral portion of the ON (IC, ischaemic core in Figure b), with heavy infiltration of Iba1(+) macrophage/microglia (green in Figure c). This likely represents the ischaemic infarct region. Significant disc oedema (*) is also noted in the anterior portion of the ON at 3-day after ischaemia. The juxtapapillary ONL layer is displaced laterally from the ON oedema caused by the infarct in the intrascleral and immediate retroscleral region. (ONL, outer nuclear layer; V, blood vessel.) Bar=50 μm. (Reproduced with permission from Zhang et al).
Figure 7
Figure 7
Identification of inflammatory cells in region of infarct shortly after induction of primate NAION (pNAION). (a, d, g) Control (naive) optic nerve (ON). (b, e, h) Three days post-induction. (c, f, i) Seven days post-induction. (a–c) Total inflammatory cell numbers. (a) The naive nerve has numerous Iba1(+) cells scattered throughout the ON structure, with normal axon numbers and staining. (b) Three days post-induction, there is focal Iba1(+) cell accumulation, with slight focal reduction of SMI312 immunopositivity. (c) One-week post-induction, there is marked loss of SMI312 immunopositivity, with increased focal accumulation of Iba1(+) inflammatory cells. (d) In control nerve, few if any polymorphonuclear leukocytes (PMNs) are present. (e) Three days post-induction, PMNs are present as a focal accumulation in the region of ON damage. (f) PMN numbers are greatly decreased 1-week post-induction. (g) Few if any extrinsic macrophages (in red) are present in the naive ON, which has strong Iba1(+) cellular immunostaining. (h) Three days post-induction, there are a few Iba1(+)/ED1 (+) cells (ie, extrinsic macrophages) in the affected ON region (arrows). (i) One-week post-induction, there are a large number of extrinsic macrophages (arrows) in the affected region. (Reproduced with permission from Salgado et al).
Figure 8
Figure 8
Cross-section of the affected optic nerve immediately posterior to the globe from a patient who died shortly after experiencing an attack of NAION, showing a large focal infarct (3) associated with axon loss; (haematoxylin and eosin, original magnification × 50). Zone 1 is a grossly intact normal region of the NAION-affected ON. Zones 2 and 5 are tissue areas adjacent to the infarct area (penumbral zone). Zone 3 represents the central infarct area. Zone 4 is the area adjacent to the infarct, which includes the central blood vessel that supplies the retina. (Reproduced with permission from Salgado et al).
Figure 9
Figure 9
ED1(pink)), Iba1(green) SMI312 (red) immunostaining of a cross-section of human optic nerve 20 days after onset of visual loss from NAION. (a–c) ED1 and Iba1 immunostaining with DAPI counterstain. (e–f) SMI312 staining with DAPI counterstain. (a, d) Zone 1 (intact). (b, e) Zone 3 (presumed primary infarct region). (c, f) Zone 5 (presumed penumbral region). (a–c) Iba1(+)/ED1(−) cells (ie, intrinsic microglia) are seen in all zones (arrowheads), but Iba1(+)/ED1(+) cells (ie, extrinsic macrophages) are present only in Zones 3 (b) and 5 (c). Specifically, no Iba1(+)/ED1(+) cells are present in Zone 1 (a). (d) SMI312 staining in zone 1 reveals normal axon filaments. Filaments are absent or disrupted in zones 3(e) and 5 (f). Bar=50 μm. (Reproduced with permission from Salgado et al).
Figure 10
Figure 10
Appearance of NAION in the acute period (a) and 3 months later (b). Note progression from hyperaemic optic disc swelling in the acute phase to subsequent diffuse optic disc pallor.

Similar articles

Cited by

References

    1. Hattenhauer MG, Leavitt JA, Hodge DO, Grill R, Gray DT. Incidence of nonarteritic anterior ischemic optic neuropathy. Am J Ophthalmol. 1997;123:103–107. - PubMed
    1. Johnson LN, Arnold AC. Incidence of nonarteritic and arteritic anterior ischemic optic neuropathy: population-based study in the State of Missouri and Los Angeles County, California. J Neuroophthalmol. 1994;14:38–44. - PubMed
    1. Guyer DR, Miller NR, Auer CL, Fine SL. The risk of cerebrovascular and cardiovascular disease in patients with anterior ischemic optic neuropathy. Arch Ophthalmol. 1985;103:1136–1142. - PubMed
    1. Repka MX, Savino PJ, Schatz NJ, Sergott RC. Clinical profile and long-term implications of anterior ischemic optic neuropathy. Am J Ophthalmol. 1983;96:478–483. - PubMed
    1. Ischemic Optic Neuropathy Decompression Trial Research Group Characteristics of patients with nonarteritic anterior ischemic optic neuropathy eligible for the Ischemic Optic Neuropathy Decompression Trial. Arch Ophthalmol. 1996;114:1366–1374. - PubMed