Comparative Study
. 2014 Jul 3:11:30.
doi: 10.1186/1743-8977-11-30.

Tissue distribution and elimination after oral and intravenous administration of different titanium dioxide nanoparticles in rats

Affiliations
Comparative Study

Tissue distribution and elimination after oral and intravenous administration of different titanium dioxide nanoparticles in rats

Liesbeth Geraets et al. Part Fibre Toxicol. .

Abstract

Objective: The aim of this study was to obtain kinetic data that can be used in human risk assessment of titanium dioxide nanomaterials.

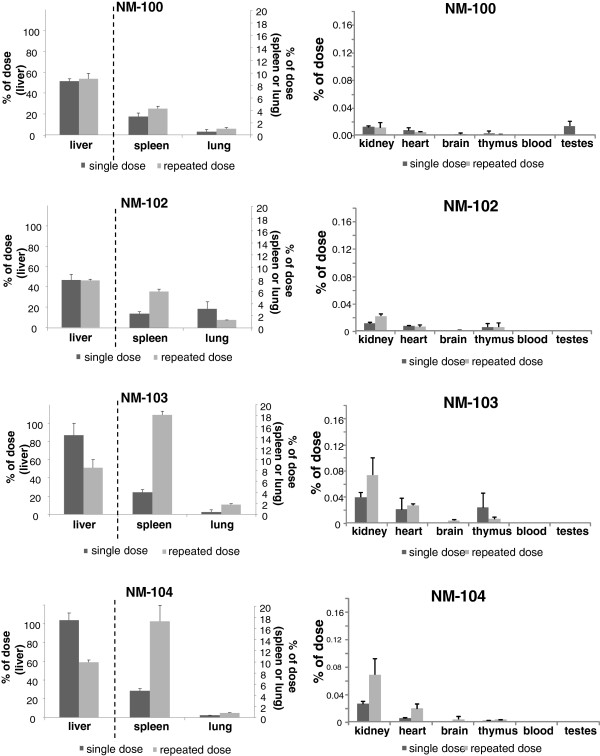
Methods: Tissue distribution and blood kinetics of various titanium dioxide nanoparticles (NM-100, NM-101, NM-102, NM-103, and NM-104), which differ with respect to primary particle size, crystalline form and hydrophobicity, were investigated in rats up to 90 days post-exposure after oral and intravenous administration of a single or five repeated doses.

Results: For the oral study, liver, spleen and mesenteric lymph nodes were selected as target tissues for titanium (Ti) analysis. Ti-levels in liver and spleen were above the detection limit only in some rats. Titanium could be detected at low levels in mesenteric lymph nodes. These results indicate that some minor absorption occurs in the gastrointestinal tract, but to a very limited extent.Both after single and repeated intravenous (IV) exposure, titanium rapidly distributed from the systemic circulation to all tissues evaluated (i.e. liver, spleen, kidney, lung, heart, brain, thymus, reproductive organs). Liver was identified as the main target tissue, followed by spleen and lung. Total recovery (expressed as % of nominal dose) for all four tested nanomaterials measured 24 h after single or repeated exposure ranged from 64-95% or 59-108% for male or female animals, respectively. During the 90 days post-exposure period, some decrease in Ti-levels was observed (mainly for NM-100 and NM-102) with a maximum relative decrease of 26%. This was also confirmed by the results of the kinetic analysis which revealed that for each of the investigated tissues the half-lifes were considerable (range 28-650 days, depending on the TiO(2)-particle and tissue investigated). Minor differences in kinetic profile were observed between the various particles, though these could not be clearly related to differences in primary particle size or hydrophobicity. Some indications were observed for an effect of crystalline form (anatase vs. rutile) on total Ti recovery.

Conclusion: Overall, the results of the present oral and IV study indicates very low oral bioavailability and slow tissue elimination. Limited uptake in combination with slow elimination might result in the long run in potential tissue accumulation.


Figures

Figure 1
Figure 1
Oral study: Hydrodynamic number size distribution of NM-101/NM-102/NM-103/NM-104 of the suspended TiO2 particle preparations used for oral gavage (A: results for particle size 0–250 nm; B: results for particle size 0–3000 nm). The majority of particles were observed as agglomerates/aggregates between 50–200 nm. Suspensions of NM-101 and NM-102 contained an additional mode between 250 and 2500 nm. No agglomerates/aggregates were observed above 3 μm. Results are the mean of 12 analyses conducted on two separate days.
Figure 2
Figure 2
IV study: Hydrodynamic particle number size distribution of (A) NM-100 and (B) NM-102. Analysis was performed with the NanoSight particle tracking equipment. Mean of 3 independent measurements.
Figure 3
Figure 3
Oral study: Determination of Ti concentration in gut mesenteria with mesenteric lymph nodes (designated MLN) from rats exposed via the oral route on 5 consecutive days for either control or TiO2-suspensions. Ti-concentrations are illustrated per gram MLN (left) or for the whole MLN tissue (right). M, Males and F, Females.
Figure 4
Figure 4
IV study: Blood kinetics of Ti (μg Ti/g blood) after single IV (A) and repeated IV (B) dosing with NM-100, NM-102, NM-103 and NM-104 in male rats. Insert: blood kinetics during the first two hours.
Figure 5
Figure 5
IV study: Organ distribution (μg/organ) of Ti on Day 2 after single IV dosing with NM-100, NM-102, NM-103 and NM-104 in male rats (LOD: 0.05μg/g). A: liver, spleen and lungs, B: kidney, heart, brain, thymus, blood and testis. NM-100: brain < LOD. NM-102: brain < LOD. NM-103: blood and testis < LOD. NM-104: brain, blood and testis < LOD.
Figure 7
Figure 7
IV study: Organ distribution of Ti as percentage of administered dose at 24 h after the last dosing after single (i.e. Day 2) and repeated (i.e. Day 6) IV dosing with NM-100, NM-102, NM-103, and NM-104 in male rats. (LOD: 0.05 μg/g). left: liver, spleen and lung, right: kidney, heart, brain, thymus, blood and testes. NM-100: brain (single exposure) < LOD. NM-102: brain (single exposure) < LOD. NM-103: blood and testis (all single exposure) < LOD. NM-104: brain, blood and testis (all single exposure) < LOD.
Figure 8
Figure 8
IV study: Organ distribution of Ti as percentage of administered dose at 24 h after the last dosing after single (i.e. Day 2) and repeated (i.e. Day 6) IV dosing with NM-100 (A), NM-102 (B), NM-103 (C), and NM-104 (D) in female rats. (LOD: 0.05 μg/g). Left: liver, spleen and lung, Right: kidney, heart, brain, thymus, blood and ovaria. NM-103: blood (single exposure) < LOD. NM-104: blood and brain (single exposure) < LOD.
Figure 6
Figure 6
IV study: Organ distribution (μg/organ) of Ti on Day 6 after repeated IV dosing with NM-100, NM-102, NM-103 and NM-104 in male rats (LOD: 0.05μg/g). A: liver, spleen and lungs, B: kidney, heart, brain, thymus, blood and testis.
Figure 9
Figure 9
IV study: Organ distribution of Ti as percentage of administered dose on Day 90 after single and repeated IV dosing with NM-100 (A), NM-102 (B), NM-103 (C), and NM-104 (D) in male rats. (LOD: 0.05 μg/g). Left: liver, spleen and lung, Right: kidney, heart, brain, thymus, blood and testes. NM-100: brain (single), blood (single + repeated), testis (repeated) < LOD. NM-102: brain (single), blood (single + repeated), testis (single + repeated) < LOD. NM-103: brain (single), testis (single + repeated) < LOD, blood (single + repeated): not measured. NM-104: brain (single), testis (single + repeated) < LOD, blood (single + repeated): not measured.
Figure 10
Figure 10
IV study: Organ distribution of Ti as percentage of administered dose on Day 90 after single and repeated IV dosing with NM-100 (A), NM-102 (B), NM-103 (C), and NM-104 (D) in female rats. (LOD: 0.05 μg/g). Left: liver, spleen and lung, Right: kidney, heart, brain, thymus, blood and ovaria. NM-100: brain (single exposure) < LOD, blood (single + repeated) < LOD. NM-102: brain + ovaries (single exposure) < LOD, blood (single + repeated) < LOD. NM-103: brain (single exposure) < LOD, blood (single + repeated): not measured. NM-104: brain (single exposure) < LOD, blood (single + repeated): not measured.
Figure 11
Figure 11
IV study: Distribution of Ti to the liver and spleen (μg Ti/g organ) after single IV dosing with NM-100 (A), NM-102 (B), NM-103 (C), and NM-104 (D) in male rats.
Figure 12
Figure 12
IV study: Distribution of Ti to the liver and spleen (μg Ti/g organ) after repeated IV dosing with NM-100 (A), NM-102 (B), NM-103 (C), and NM-104 (D) in male rats.

References

    1. EC. Commission regulation (EU) No 1129/2011 of 11 November 2011 amending Annex II to Regulation (EC) No 1333/2008 of the European parliament and of the council by establishing a union list of food additives. Off J European Union. 2011. pp. 1–177. L 295/1, 12.11.2011. ( http://eur-lex.europa.eu/LexUriServ/LexUriServ.do?uri=OJ:L:2011:295:0001...)
    1. Weir A, Westerhoff P, Fabricius L, Hristovski K, von Goetz N. Titanium dioxide nanoparticles in food and personal care products. Environ Sci Technol. 2012;46:2242–2250. - PMC - PubMed
    1. Lomer MC, Thompson RP, Commisso J, Keen CL, Powell JJ. Determination of titanium dioxide in foods using inductively coupled plasma optical emission spectrometry. Analyst. 2000;125:2339–2343. - PubMed
    1. Peters RJ, van Bemmel G, Herrera-Rivera Z, Helsper JP, Marvin HJ, Weigel S, Tromp P, Oomen AG, Rietveld A, Bouwmeester H. Characterisation of titanium dioxide nanoparticles in food products: Analytical methods to define nanoparticles. J Agric Food Chem. 2014. (in press) - PubMed
    1. EC. Commission recommendation of 18 October 2011 on the definition of nanomaterial (2011/696/EU) Off J European Union. 2011. pp. 38–40. L 275/38, 20.10.2011. ( http://eur-lex.europa.eu/LexUriServ/LexUriServ.do?uri=OJ:L:2011:275:0038...)

Publication types

LinkOut - more resources