Review
. 2014 Jul 3;6(10):a016022.
doi: 10.1101/cshperspect.a016022.

The archaeal legacy of eukaryotes: a phylogenomic perspective

Affiliations
Review

The archaeal legacy of eukaryotes: a phylogenomic perspective

Lionel Guy et al. Cold Spring Harb Perspect Biol. .

Abstract

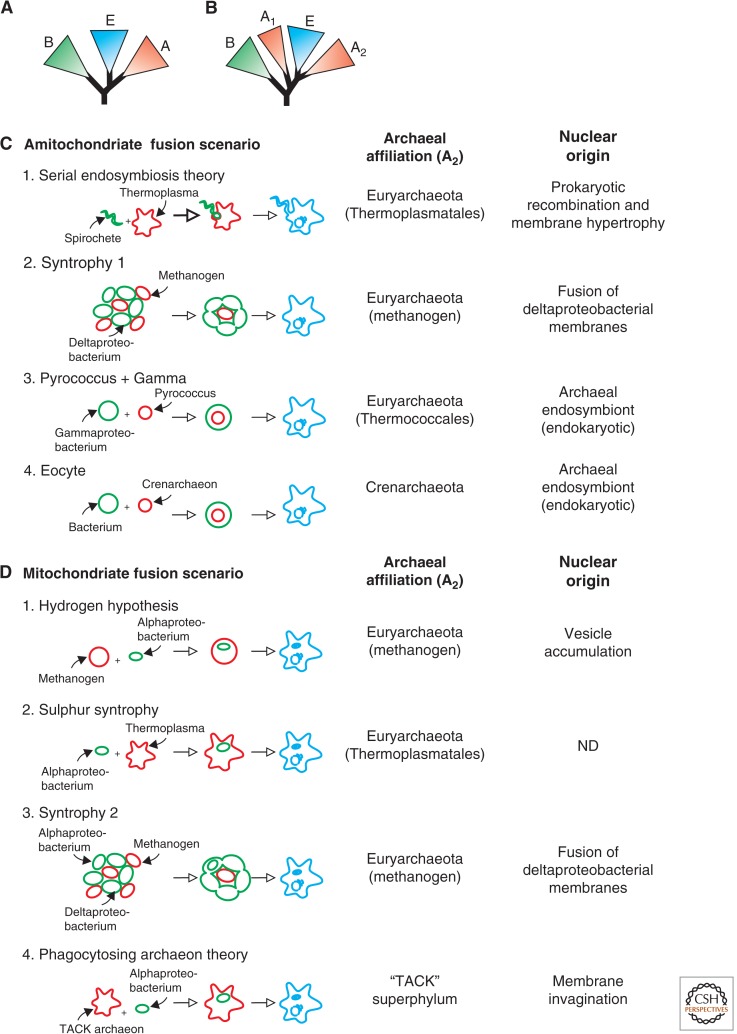
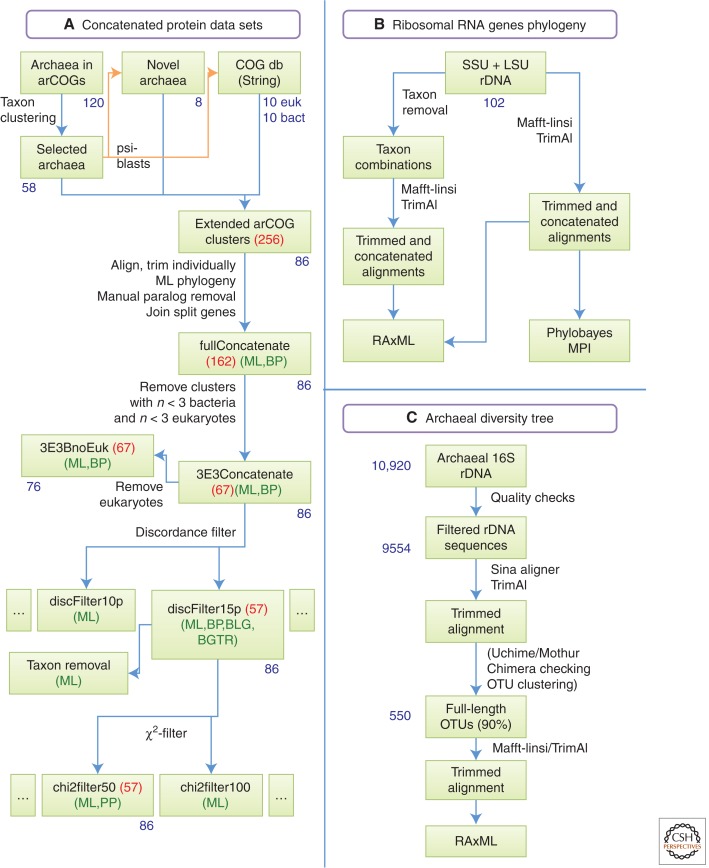
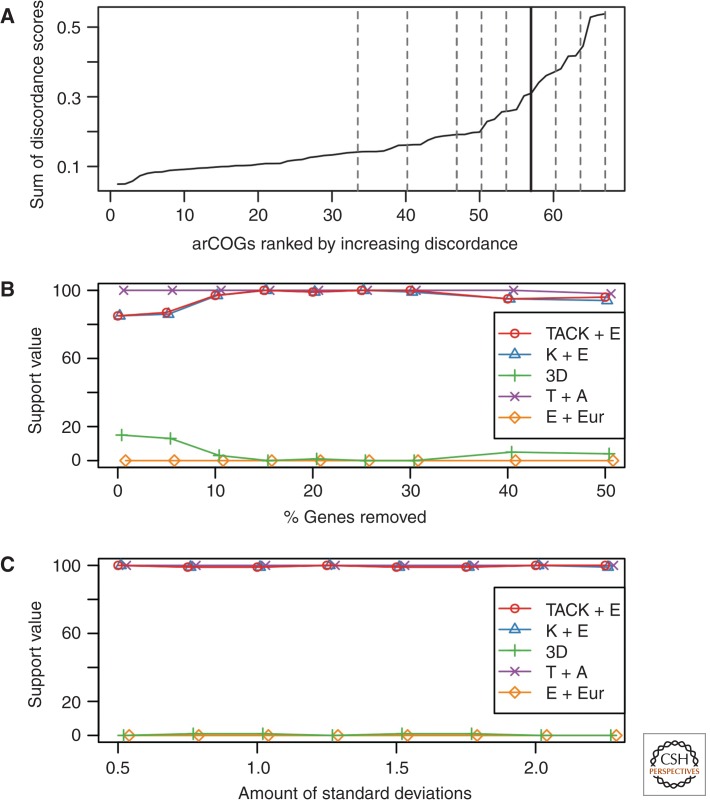
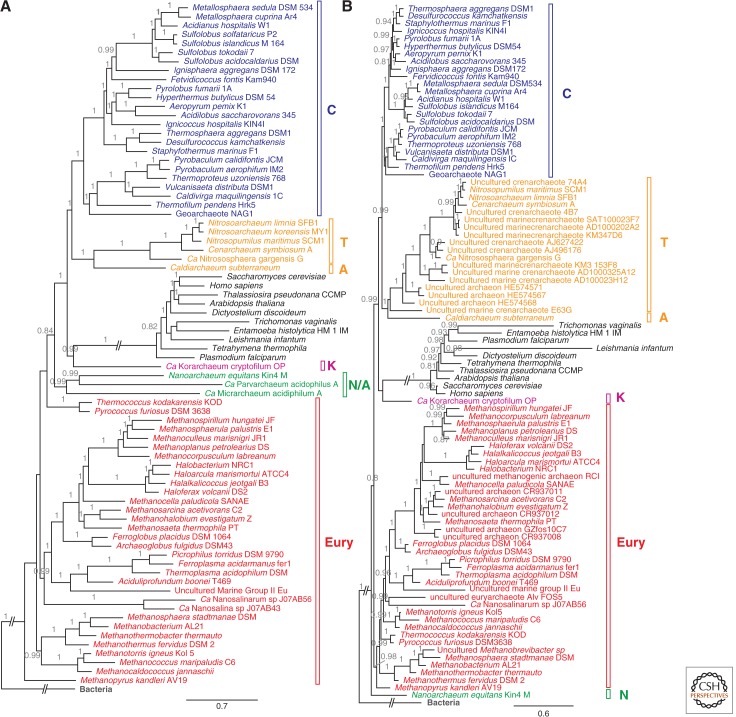
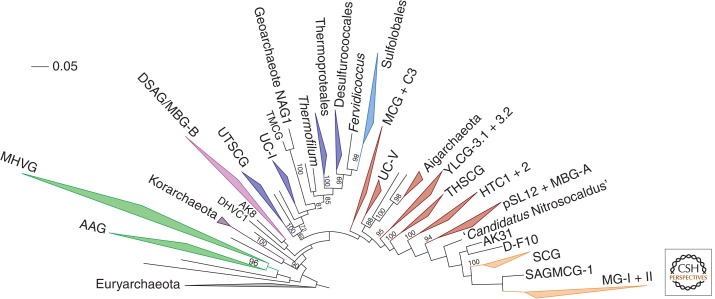
The origin of the eukaryotic cell can be regarded as one of the hallmarks in the history of life on our planet. The apparent genomic chimerism in eukaryotic genomes is currently best explained by invoking a cellular fusion at the root of the eukaryotes that involves one archaeal and one or more bacterial components. Here, we use a phylogenomics approach to reevaluate the evolutionary affiliation between Archaea and eukaryotes, and provide further support for scenarios in which the nuclear lineage in eukaryotes emerged from within the archaeal radiation, displaying a strong phylogenetic affiliation with, or even within, the archaeal TACK superphylum. Further taxonomic sampling of archaeal genomes in this superphylum will certainly provide a better resolution in the events that have been instrumental for the emergence of the eukaryotic lineage.


Figures

Figure 1.
Figure 1.
Overview of scenarios for the origin of the eukaryotic cell. Schematic depiction of the classical three-domain tree of life (A) and a tree that supports fusion hypotheses in which the eukaryotic nuclear lineage evolved from within the archaeal radiation (B). Of the latter category, a number of hypotheses have been proposed that can be classified as amitochondriate fusion scenarios (i.e., the fusion event leads to a mitochondrion-lacking proto-eukaryotic lineage). The following scenarios have been outlined schematically: (1) The Serial Endosymbiosis Theory (Margulis et al. 2006), which involves a fusion between a Spirochete and a Thermoplasma-like archaeon; (2) “Syntrophy 1” representing the original syntrophic hypothesis proposed by Moreira and Lopez-Garcia (1998), involving a fusion between a syntrophic community comprising hydrogen producing deltaproteobacterial cells and hydrogen consuming methanogens; (3) “Pyrococcus + Gamma,” depicting the endokaryotic model proposed by Horiike et al. (2004) in which the eukaryotic lineage emerges via a Pyrococcus-related archaeal endosymbiont in a gammaproteobacterial host; (4) The eocyte model proposed by Lake (1988), which suggests that the eukaryotic nucleus evolved from a crenarchaeal lineage. Another class of fusion models involves scenarios in which the origin of the proto-eukaryotic lineage coincides with that of the mitochondrial origin (D), and include the following examples: (1) The Hydrogen hypothesis, involving the endosymbiosis of a hydrogen-producing alphaproteobacterium in a methanogen (Martin and Muller 1998); (2) Sulfur Syntrophy, in which eukaryotes evolved from a sulfur-dependent syntrophy between a Thermoplasma-like archaeaon and an alphaproteobacterium (Searcy and Hixon 1991; Pisani et al. 2007); (3) “Syntrophy 2,” which involves a refined version of the original Syntrophic hypothesis, which now also includes anaerobic methane oxidizing alphaproteobacterial cells from which the mitochondria supposedly emerged (Lopez-Garcia and Moreira 1999); (4) Phagocytosing Archaeon Theory (PhAT), which involves the engulfment of an alphaproteobacterium by a phagocytic archaeon belonging to the TACK superphylum (Martijn and Ettema 2013). Archaeal, bacterial, and (proto)eukaryotic cells are depicted in red, green and blue, respectively. A, Archaea; B, Bacteria; E, Eukarya; ND, not determined. (C,D, Inspired by Table 1 in Martin 2005.)
Figure 2.
Figure 2.
Flowcharts of the data selection processes. Numbers in blue outside boxes represent the number of sequences or organisms included. Numbers in red represent the number of genes or clusters. Abbreviations in green show the phylogeny algorithms applied to the data set: ML, maximum-likelihood (RAxML); BP, BLG, and BGTR, Bayesian under CAT-Poisson, CAT-LG, and CAT-GTR model, respectively (Phylobayes). (A) Protein concatenated data sets. (B) Ribosomal RNA genes phylogeny. (C) Archaeal diversity tree.
Figure 3.
Figure 3.
Evaluation of the discordance and χ2 filters. (A) Discordance score (y-axis) for all clusters (x-axis) ranked by increasing score. Dashed lines are shown at 50%, 40%, 30%, 20%, 15%, 10%, and 5% of the data, which correspond at the fractions of genes removed and further tested; see B. A thick line is shown at 15%, which is the fraction chosen for subsequent χ2 filter (C). (B) Effect of the discordance filter on selected bipartitions: TACK superphylum and eukaryotes monophyletic (TACK + E); Korarchaeota grouping with eukaryotes (K + E); each of all three domains monophyletic, corresponding to the three-domain hypothesis (3D); Thaumarchaeota and Aigarchaeota monophyletic (T + A); Crenarchaeota and Geoarchaeota (NAG1) monophyletic (C + NAG1); and Crenarchaeota not including Geoarchaeota (NAG1) monophyletic, that is, Geoarchaeota branching at the root or within the Crenarchaeota (C-NAG1). Colors and symbols, see C. The x-axis values represent the fraction of genes removed, slightly scattered to improve readability, and the y value represents the number of times a specific bipartition was found in 100 ML bootstrap trees. (C) Effect of the χ2 filter on the same bipartitions as in B. Sites diverging from the average amino acid composition by an increasing amount of standard deviations (x-axis) were removed and the support for specific bipartitions was inferred from the number of times the bipartition was found in 100 ML bootstraps (y-axis).
Figure 4.
Figure 4.
Bayesian trees obtained from concatenated amino acid sequence alignments (A) and the concatenated sequences of the small and large ribosomal subunits (SSU and LSU, respectively) (B). In A, the tree was obtained from the alignment of the 85% least-divergent proteins (data set discFilter15p), running four chains of Phylobayes under a CAT-Poisson model. In B, the sequences for both ribosomal subunits were concatenated and a phylogeny was similarly inferred. Eukaryotes are shown in black, Bacteria in gray, Euryarchaeota in red, Nanoarchaeota and ARMAN in green, Korachaeota in pink, Thaumarchaeota and Aigarchaeota in orange, and Crenarchaeota in blue. PPs are shown on the branches. PP support values lower than 0.8 are not displayed. Branches leading to eukaryotes and Bacteria have been shortened for readability. Full figures are available as supplemental Figure 3F and 3B online, respectively.
Figure 5.
Figure 5.
Phylogenetic diversity of major archaeal clades of the TACK superphylum. The tree was constructed from an alignment of full-length sequences from 459 representative operative taxonomic units, along with 91 guide 16S rRNA sequences used in the 16S + 23S rRNA gene phylogeny, except that Nanoarchaeota was excluded. Known major clades are collapsed and shown as wedges and only bootstrap values above 70 are shown. For viewing clarity, major clades are shown as wedges and each shaded in a different color. AAG, Ancient Archaeal Group; MHVG, Marine Hydrothermal Vent Group; DHVC1, Deep-sea Hydrothermal Vent Crenarchaeotic group 1; DSAG/MBG-B, Deep-Sea Archaeal Group/Marine Benthic Group B; UTSCG, Uncultured Thermoacidic Spring Clone Group; UC-I and V, Uncultured Crenarchaeota groups I and V; TMCG, Terrestrial Miscellaneous Crenarchaeotic Group; MCG, Miscellaneous Crenarchaeal Group; YLCG-3.1 + 3.2, Yellowstone Lake Crenarchaeal Groups 3.1 and 3.2; THSCG, Terrestrial Hot Spring Crenarchaeotic Group; HTC1 + 2, Hot Thaumarchaeota-related Clades 1 and 2; pSL12 + MBG-A, pSL12-related group + Marine Benthic Group A; SCG, Soil Crenarchaeotic Group; SAGMCG-1, South African Gold Mine Crenarchaeotic Group-1; MG-I+II, Marine Groups I and II. AK8, AK31, and D-F10 are clone names. Details regarding methods for the construction of the phylogenetic tree are available in the supplemental methods online.

Similar articles

Cited by

References

    1. Bell PJ 2001. Viral eukaryogenesis: Was the ancestor of the nucleus a complex DNA virus? J Mol Evol 53: 251–256 - PubMed
    1. Bernander R, Lind AE, Ettema TJ 2011. An archaeal origin for the actin cytoskeleton: Implications for eukaryogenesis. Commun Integr Biol 4: 664–667 - PMC - PubMed
    1. Brown JR, Doolittle WF 1997. Archaea and the prokaryote-to-eukaryote transition. Microbiol Mol Biol Rev 61: 456–502 - PMC - PubMed
    1. Bult CJ, White O, Olsen GJ, Zhou L, Fleischmann RD, Sutton GG, Blake JA, FitzGerald LM, Clayton RA, Gocayne JD, et al. 1996. Complete genome sequence of the methanogenic archaeon, Methanococcus jannaschii. Science 273: 1058–1073 - PubMed
    1. Cavalier-Smith T 1989. Molecular phylogeny. Archaebacteria and Archezoa. Nature 339: l00–101 - PubMed

Publication types

LinkOut - more resources