. 2014 Aug 15;289(33):22850-22864.
doi: 10.1074/jbc.M114.576371. Epub 2014 Jul 3.

5'-AMP-activated protein kinase (AMPK) supports the growth of aggressive experimental human breast cancer tumors

Affiliations

5'-AMP-activated protein kinase (AMPK) supports the growth of aggressive experimental human breast cancer tumors

Keith R Laderoute et al. J Biol Chem. .

Abstract

Rapid tumor growth can establish metabolically stressed microenvironments that activate 5'-AMP-activated protein kinase (AMPK), a ubiquitous regulator of ATP homeostasis. Previously, we investigated the importance of AMPK for the growth of experimental tumors prepared from HRAS-transformed mouse embryo fibroblasts and for primary brain tumor development in a rat model of neurocarcinogenesis. Here, we used triple-negative human breast cancer cells in which AMPK activity had been knocked down to investigate the contribution of AMPK to experimental tumor growth and core glucose metabolism. We found that AMPK supports the growth of fast-growing orthotopic tumors prepared from MDA-MB-231 and DU4475 breast cancer cells but had no effect on the proliferation or survival of these cells in culture. We used in vitro and in vivo metabolic profiling with [(13)C]glucose tracers to investigate the contribution of AMPK to core glucose metabolism in MDA-MB-231 cells, which have a Warburg metabolic phenotype; these experiments indicated that AMPK supports tumor glucose metabolism in part through positive regulation of glycolysis and the nonoxidative pentose phosphate cycle. We also found that AMPK activity in the MDA-MB-231 tumors could systemically perturb glucose homeostasis in sensitive normal tissues (liver and pancreas). Overall, our findings suggest that the contribution of AMPK to the growth of aggressive experimental tumors has a critical microenvironmental component that involves specific regulation of core glucose metabolism.

Keywords: AMP-activated Kinase (AMPK); Glucose Metabolism; Metabolic Profiling; Triple Negative; Tumor Metabolism; Tumor Microenvironment; Warburg Effect.


Figures

FIGURE 1.
FIGURE 1.
A and B, transcript levels of AMPKα1 (PRKAA1) and AMPKα2 (PRKAA2) in shRNA control and AMPKα1/2 KD MDA-MB-231 cells. Numerical values refer to % (KD Signal/Control Signal) ± % combined S.D. (n = 2 replicates). C, AMPKα1 and AMPKα2 protein levels in shRNA control and AMPKα1/2 KD MDA-MB-231 cells. Numerical values refer to % (normalized KD signal/normalized control signal) ± % combined S.D. (n = 2 replicates). AMPKα signals were normalized to the corresponding MARK2 signals (signals are intensity values (thousand pixels) obtained by image analysis). D, total AMPKα (AMPKα1/2), ACC1, and phospho-Ser-79 ACC1 (P-ACC1) protein levels in shRNA control and AMPKα1/2 KD MDA-MB-231 cells. Numerical values refer to % (normalized KD signal/normalized control signal) ± % combined S.D. (n = 2, replicates). AMPKα signals were normalized to the corresponding MARK2 signals (signals are intensity values (thousand pixels) obtained by image analysis).
FIGURE 2.
FIGURE 2.
A, effect of an AMPKα1/2 KD on the growth of orthotopic MDA-MB-231 xenografts in nude mice (10 implanted mice/group). Mean tumor volume data were analyzed by one-way analysis of variance (p < 0.0001). The asterisks refer to p values for statistically significant differences (p < 0.05; Tukey-Kramer test) at the indicated days of tumor growth: *, day 40, p < 0.001; **, day 36, p < 0.05 (shRNA control group, top curve/diamonds; AMPKα1/2 KD group, bottom curve/squares). Error bars, ±S.D. B, in vitro proliferation/survival curves for shRNA control and AMPKα1/2 KD MDA-MB-231 cells obtained by using an Alamar Blue proliferation/viability assay. Raw fluorescence data were fitted by nonlinear regression to a sigmoidal growth equation. Error bars, ±S.D. (n = 3 replicates). C, survival curves from a lung colonization assay experiment involving control and AMPKα1/2 KD MDA-MB-231 cells. MDA-MB-231 cells were injected into the tail vein of beige-nude mice (2 × 10⁶ cells/injection; 15 mice/group). Survival was determined by the Kaplan-Meier method (p < 0.0001 for median survival). Top curve (triangles), AMPKα1/2 KD group; bottom curve (squares), shRNA control group.
FIGURE 3.
FIGURE 3.
A, in vitro growth curves for shRNA control and AMPKα1/2 KD MDA-MB-231 cells cultured in high and low glucose-containing medium (25 or 1 mm glucose in DMEM + 10% FBS; data obtained by cell counting). Error bars, ±S.D. (n = 3 replicates). Top curves (solid lines), 25 mm glucose; bottom curves (broken lines), 1 mm glucose. B, effect of AMPKα1/2 KD on the uptake of glucose (top) and glutamine (bottom) by MDA-MB-231 cells cultured under normoxia (5% CO2 + air). Cells were given 2-deoxy-d-[2,6-3H]glucose or l-[3,4-3H]glutamine for 5 min (see under “Experimental Procedures” for details). Glucose uptake: shRNA control cells, 129 ± 22 pmol/mg total protein/5 min; AMPKα1/2 KD cells, 106 ± 11 pmol/mg total protein/5 min; ±S.D., n = 3. Glutamine uptake: shRNA control cells, 10,411 ± 1,034 cpm/mg total protein/5 min; AMPKα1/2 KD cells, 9320 ± 314 pmol/mg total protein/5 min; ±S.D., n = 3.
FIGURE 4.
FIGURE 4.
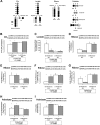
Metabolic profiling of shRNA control and AMPKα1/2 KD MDA-MB-231 cells cultured with a d-[1,2-13C2]glucose tracer in high and low glucose-containing medium (25 or 1 mm glucose in DMEM +10% FBS). Histograms show the effect of AMPKα1/2 KD on glucose metabolism through the following pathways. A, 13C-labeling patterns of selected molecules of core glucose metabolism evaluated using [13C2]glucose as a tracer. B, oxidation to CO2 in the PPC and the TCA cycle; C, production of lactate by aerobic glycolysis and the PPC; D–F, production of RNA ribose by triose recycling (D), the PPC (E), the oxidative PPC (F), and the nonoxidative PPC (G); production of palmitate from all pathways (H) and from acetyl-CoA from the TCA cycle (I). Error bars, ±S.D. (n = 3 plates/cell line).
FIGURE 5.
FIGURE 5.
Effect of AMPKα1/2 KD on the oxygen consumption rate (OCR) (A) and proton production rate (PPR) (B) of MDA-MB-231 cells cultured under normoxia (5% CO2 + air). Open arrow, addition of the ATP synthase inhibitor oligomycin to inhibit oxidative phosphorylation. Closed arrow, addition of the uncoupling agent/protonophore (carbonyl cyanide m-chlorophenyl hydrazone) to uncouple the respiratory chain from ATP synthesis. Error bars, ±S.D.
FIGURE 6.
FIGURE 6.
Metabolic profiling of shRNA control and AMPKα1/2 KD MDA-MB-231 orthotopic tumors with a d-[13C6]glucose tracer. A, 13C-labeling patterns of selected molecules of core glucose metabolism evaluated using [13C6]glucose as a tracer. B, growth curves for the orthotopic MDA-MB-231 tumors used for the study (30 implanted mice/group). Mean tumor volume data were analyzed by one-way analysis of variance (p < 0.0001). The asterisks refer to p values (p < 0.05; Tukey-Kramer test) for statistically significant differences in mean tumor volumes (p < 0.050) at the indicated days of tumor growth: *, day 21, p < 0.001; **, day 18, p < 0.001 (shRNA control group, top curve/diamonds; AMPKα1/2 KD group, bottom curve/squares). Error bars, ±S.D. Histograms show the effect of AMPKα1/2 KD on core glucose metabolism in tumor tissue (during ≤90 min; left-to-right, 30-, 60-, and 90-min observation times; five tumors/time) through the following pathways: C, oxidation to CO2 in the PPC and the TCA cycle; D and E, production of lactate by glycolysis and the PPC; F, production of lactate by the oxidative PPC relative to glycolysis; production of RNA ribose by all pathways (G) and the nonoxidative PPC (H); production of palmitate from all pathways (I and J) and from acetyl-CoA from the TCA cycle (K). Tumor tissue and plasma samples were obtained on day 21 at 30-, 60-, and 90-min after i.p. injection of the tracer (15 mice from each group were used for metabolic profiling; 5 mice/time point; see “Experimental Procedures” for details). Error bars, ±S.D.
FIGURE 7.
FIGURE 7.
Metabolic profiling of pancreas and liver from mice used for the study detailed in Fig. 6. Histograms show the effect of AMPKα1/2 KD on glucose metabolism in pancreas and liver tissue through the following pathways: A, production of RNA ribose by all pathways; and B, production of lactate by the oxidative PPC relative to glycolysis. C, enrichment of 13C from the d-[13C6]glucose tracer in plasma glucose. Error bars, ±S.D.

References

    1. Vander Heiden M. G., Cantley L. C., Thompson C. B. (2009) Understanding the Warburg effect: the metabolic requirements of cell proliferation. Science 324, 1029–1033 - PMC - PubMed
    1. Schulze A., Harris A. L. (2012) How cancer metabolism is tuned for proliferation and vulnerable to disruption. Nature 491, 364–373 - PubMed
    1. Metallo C. M., Vander Heiden M. G. (2013) Understanding metabolic regulation and its influence on cell physiology. Mol. Cell 49, 388–398 - PMC - PubMed
    1. Hanahan D., Weinberg R. A. (2011) Hallmarks of cancer: the next generation. Cell 144, 646–674 - PubMed
    1. Saggar J. K., Yu M., Tan Q., Tannock I. F. (2013) The tumor microenvironment and strategies to improve drug distribution. Front. Oncol. 3, 154. - PMC - PubMed

Publication types