. 2014 Aug 22;289(34):23992-4004.
doi: 10.1074/jbc.M114.561787. Epub 2014 Jul 3.

Structural insights into the activation of the RhoA GTPase by the lymphoid blast crisis (Lbc) oncoprotein

Affiliations

Structural insights into the activation of the RhoA GTPase by the lymphoid blast crisis (Lbc) oncoprotein

Marc Lenoir et al. J Biol Chem. .

Abstract

The small GTPase RhoA promotes deregulated signaling upon interaction with lymphoid blast crisis (Lbc), the oncogenic form of A-kinase anchoring protein 13 (AKAP13). The onco-Lbc protein is a hyperactive Rho-specific guanine nucleotide exchange factor (GEF), but its structural mechanism has not been reported despite its involvement in cardiac hypertrophy and cancer causation. The pleckstrin homology (PH) domain of Lbc is located at the C-terminal end of the protein and is shown here to specifically recognize activated RhoA rather than lipids. The isolated dbl homology (DH) domain can function as an independent activator with an enhanced activity. However, the DH domain normally does not act as a solitary Lbc interface with RhoA-GDP. Instead it is negatively controlled by the PH domain. In particular, the DH helical bundle is coupled to the structurally dependent PH domain through a helical linker, which reduces its activity. Together the two domains form a rigid scaffold in solution as evidenced by small angle x-ray scattering and (1)H,(13)C,(15)N-based NMR spectroscopy. The two domains assume a "chair" shape with its back possessing independent GEF activity and the PH domain providing a broad seat for RhoA-GTP docking rather than membrane recognition. This provides structural and dynamical insights into how DH and PH domains work together in solution to support regulated RhoA activity. Mutational analysis supports the bifunctional PH domain mediation of DH-RhoA interactions and explains why the tandem domain is required for controlled GEF signaling.

Keywords: AKAP; GTPase; Guanine Nucleotide Exchange Factor (GEF); Lbc; Nuclear Magnetic Resonance; Oncogene; Protein Structure; Protein-Protein Interaction; Ras Homolog Gene Family, Member A (RhoA); Rho GTPases.


Figures

FIGURE 1.
FIGURE 1.
Lbc RhoGEF family, AKAP13 variants, and constructs. The orthologs and constructs of AKAP-Lbc are depicted with their constituent domains. The number of residues are indicated on the right for ARHGEF1 (also known as p115), ARHGEF11 (PRG or PDZRhoGEF), ARHGEF12 (LARG), ARHGEF2 (GEFH1), ARHGEF18 (p114), and ARHGEF28 (p190). The ankyrin binding site (Ank), PKA binding domain, C2, DH, PH, and dimerization (DM) domains are indicated. The DH and PH domains are indicated by yellow and orange boxes, respectively; other domains are represented by a black box.
FIGURE 2.
FIGURE 2.
Solution structure of the AKAP13 PH domain and DH α6 helix. A, solution structure of AKAP13 PH domain and the C-terminal helix of the DH domain (DHαPH). The structure is colored from its N terminus (blue) to C terminus (red). The secondary structure elements and termini are labeled. B, the topology of the DHαPH fold includes the α6 helix of DH domain (yellow) followed by the linker region (gray) and the PH domain (orange). Secondary structures are labeled above with a bulge separating β4 into two ministrands, β4′ and β4″. C, the representative solution structures of DHαPH are superimposed, and the component domains are color-coded yellow, gray, and orange for the DHα6 helix, linker, and PH domain, respectively. D, the interface between the DH, PH, and linker is shown with side chains of residues involved in long range contacts represented with sticks and balls. The unambiguous distance restraints that link the DH and PH elements involve labeled residue pairs Leu2201-Leu2232, Leu2201-Leu2227, Ile2204-Leu2227, Tyr2205-Leu2227, Tyr2205-Lys2224, Tyr2205-Lys2228, Thr2208-Tyr2269, Thr2208-Leu2262, Thr2208-Lys2224, and Thr2208-Tyr2269. The solution structure was deposited under the Protein Data Bank code 2LG1.
FIGURE 3.
FIGURE 3.
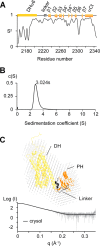
Solution structure of the full-length onco-Lbc. A, the dynamics of DHαPH is illustrated by the order parameters (S2) calculated using the RCI server (27). B, monomeric solution state of onco-Lbc as determined by velocity sedimentation. The distribution of the sedimentation coefficients is centered on 3.024 S, showing that onco-Lbc is monodispersed and monomeric in solution. C, interatomic distance distribution function for onco-Lbc calculated with PRIMUS. Models were generated with Modeler, and their theoretical scattering intensity was calculated with CRYSOL and fitted to the experimental data. The best fit calculated by CRYSOL between the experimental data and the model is represented in the left panel2, 1.352). The best fit model of onco-Lbc is positioned in the molecular envelope generated with DAMMIF from the scattering pattern. Domains of onco-Lbc are color-coded as in Fig. 1.
FIGURE 4.
FIGURE 4.
RhoA nucleotide exchange as a function of onco-Lbc concentration. A, the formation of RhoA-Mant-GTP was followed by fluorescence (excitation, 356 nm; emission, 440 nm) for onco-Lbc concentrations ranging from 0 and 800 nm. The AKAP protein was injected at time 0. B, the exchange activity of RhoA deviates from a straight line (dotted gray line) with increasing onco-Lbc concentrations and follows a hyperbolic function (dotted black line) indicative of a two-step mechanism. a.u., arbitrary units.
FIGURE 5.
FIGURE 5.
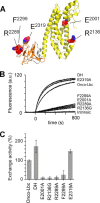
GEF activity of onco-Lbc mutants. A, the residues mutated in the DH-PH tandem are represented by atomic spheres. Mutations are colored according to the effects on GEF activity: red for inactivating except for Glu2319 (magenta), which is activating. B, the exchange activity of onco-Lbc mutants is compared with the wild-type onco-Lbc. The curves represent the exchange of GDP to Mant-GTP after injection of 200 nm onco-Lbc at time 0. Curves are labeled for each mutant. C, the exchange activities of wild-type onco-Lbc and mutants as calculated for GDP to Mant-GTP exchanges are depicted: onco-Lbc, 100 ± 3.6; DH, 173.6 ± 33.4; E2001A, 8.4 ± 4.4; R2136G, 7.4 ± 6.0; R2289A, 10.9 ± 6.5; F2299A, 23.3 ± 22.1; and E2319A, 148.0 ± 8.9. a.u., arbitrary units. Error bars represent S.D.
FIGURE 6.
FIGURE 6.
Mapping of RhoA interaction site. A, binding of RhoA-GTP specifically broadens amide signals in the PH domain following the addition of 4 nm onco-Lbc with peak intensity reductions measured from a 1H,15N-resolved two-dimensional experiment after 20 min. The y axis represents the normalized peak intensity reduction (1 = 100% reduction). B, the residues exhibiting line broadening upon RhoA-GTP binding are labeled and map to the exposed β sheet and proximal loops of the PH domain. C, the 15N-resolved two-dimensional NMR spectra of the AKAP DHαPH domain sample containing RhoA-GDP (1:2 ratio) and GTP (1 mm) are overlaid in the upper panel before (black) and after addition of onco-Lbc (4 nm) (red). The lower panel shows the recovery of amide resonances from 15N-labeled AKAP DHαPH after addition of calf intestinal alkaline phosphatase (CIP) (blue). Signals significantly broadened after addition of onco-Lbc are labeled by the residue. The S2278a and G2297b peaks are weak and located just outside the spectral region displayed, respectively.
FIGURE 7.
FIGURE 7.
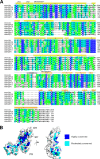
Structure-based sequence alignment of the ARHGEF family members. A, the amino acid sequences of the tandem DH-PH domains of AKAP-Lbc and its relatives ARHGEF28, ARHGEF18, ARHGEF2, ARHGEF12, ARHGEF11, and ARHGEF1 were aligned by ClustalW and colored by BOXSHADE using Clustal 1.60 values. Absolutely conserved, identical, and similar residues are shaded in blue, aqua, and green, respectively. The residues that, when mutated, reduce or increase GEF activity are boxed in red and magenta, respectively, and indicated with a similarly colored asterisk. An “n” is placed above those residues that exhibit NMR-based restraints between the DHα6 and linker helices and the PH domain. An “m” is placed above those residues in which mutations alter AKAP-Lbc biochemical function including Tyr2153 and Trp2324. A “c” is above those residues that incur substitutions due to missense mutations identified in the Catalogue of Somatic Mutations in Cancer (COSMIC) database (55) including the following: Q2033H, E2044G, F2052L, A2090T, L2174I, V2181L, S2194R, R2229Q, R2229L, S2237N, L2254I, L2259V, K2296R, P2308L, S2317F, and Q2326K. The positions of AKAP-Lbc helices and strands are displayed above the alignment. B, surface mapping of the DH-PH tandem according to conservation scores as calculated from the Blosum62 matrix. Highly and moderately conserved residues are represented in blue and cyan, respectively, and indicate conservation of the functional sites.
FIGURE 8.
FIGURE 8.
Putative RhoA binding sites. The putative location of RhoA-GTP bound to the onco-Lbc PH domain β5-β7 sheet is indicated by a blue dotted line circle. Mutated residues are represented by sticks and balls color-coded according to Fig. 4. The position of RhoA-GDP on the DH domain is inferred from ARHGEF11 and -12. Residues corresponding to Lys2318 and Glu2319 are represented at the αCt helix of the PH domain for the model of onco-Lbc, ARHGEF11, and ARHGEF12. Residues Asp97 and Arg150 from RhoA and facing the PH domain are shown in the enlarged views.
FIGURE 9.
FIGURE 9.
Binding affinities of RhoA states for onco-Lbc and DHαPH. A, the dissociation constants of the RhoA-GDP·DHαPH, RhoA-GTP·DHαPH, RhoA-GDP·onco-Lbc, and RhoA-GTP·onco-Lbc complexes were determined by surface plasmon resonance as illustrated by Biacore sensorgrams measured for onco-Lbc and DHαPH at varying concentrations (0–5 μm). B, the specific association of RhoA-GTP with the PH domain of onco-Lbc (Kd = 2.93 ± 0.37 μm) was contrasted with the inactive GDP-bound RhoA by surface plasmon resonance (Kd > 50 μm). The apparent dissociation constant of onco-Lbc that results from the binding of RhoA at two distinct sites was slightly lower for the active (Kd = 2.21 ± 0.26 μm) versus the inactive form of RhoA (Kd = 2. 88 ± 0.11 μm). C, model of the feedback mechanism triggered by RhoA-GTP binding. Following the association with RhoA-GDP, the DH domain of onco-Lbc exchanges the nucleotide of RhoA. Once released from the PH domain, RhoA-GTP translocates to membranes by virtue of its farnesylfarnesyl moiety (dotted arrow) and specifically recognizes the PH domain of onco-Lbc. The binding of RhoA-GTP by the PH domain does not compete with the GEF activity of the DH domain but rather constitutes a possible mechanism of regulation by orientation of onco-Lbc on the membrane by a PH domain that does not itself contain membrane-interacting sites.
FIGURE 10.
FIGURE 10.
Assessment of the lipid binding by the PH domain of onco-Lbc. A, chemical shift perturbations were monitored in the 15N-labeled AKAP DHαPH domain after addition of dihexanoyl phosphatidylserine (PtdSer) (5 mm), PtdIns(4,5)P2 (1 mm), or PtdIns(3,4,5)P3 (0.57 mm). The absence of specific interaction was shown by the lack of any significant of chemical shift perturbations after each addition. The dotted line indicates significant chemical shift perturbations for a positive control protein (FAPP1-PH). Cross-sections of selected amide proton peaks extracted from the heteronuclear single quantum coherence spectra are compared for samples at the start (black) and end of the titration (red). The peaks are labeled with the corresponding residue. The chemical shift perturbations (Δδ) were calculated as follows: Δδ = [(ΔδH)2 + (0.15 ΔδN)2]1/2 where ΔδH and ΔδN are the differences of chemical shift in ppm between the start and the end of the titration for the amide proton and nitrogen resonances, respectively. B, prediction of membrane interaction sites using MODA and PIER software packages (28, 29). The NMR structure of the DHαPH solution structure and crystal structures of ARHGEF-1, -11, and -12 were used as inputs for predictions. The residues with high (purple) and medium (orange) propensities for membrane or protein interaction as predicted by MODA and PIER, respectively, are shown as follows: for onco-Lbc, PIER: 2287, 2299, 2302, 2303, 2308, 2310 (purple), 2277, 2278, 2286, 2288, 2306, 2307, 2309, 2312 (orange); MODA: none; for ARHGEF1, PIER: 445, 448, 449, 451, 539, 658, 704, 713–716, 726, 728, 736, 737, 739 (purple), 47, 66, 401, 403, 406, 431, 434, 441, 444, 447, 450, 482, 486, 514, 535, 538, 542, 543, 659, 691, 692, 710, 712, 717–720, 724, 730, 734, 735, 752, 756 (orange); MODA: none; for ARHGEF11, PIER: 749, 881, 1046, 1047, 1044, 1055 (purple), 743–745, 747, 748, 751, 752, 755, 877, 880, 884, 888, 927, 975, 1021, 1022, 1031–1037, 1048, 1049, 1052–1055, 1058 (orange); MODA: 1032, 1034, 1037–1038, 1046, 1048–1051, 1054, 1056 (red), 1047, 1052 (orange); for ARHGEF12, PIER: 793, 794, 797, 798, 801, 805, 808, 998, 1029, 1059, 1078, 1084, 1091, 1092, 1095, 1102, 1103, 1105, 1120–1122, 1125, 1128, 1129, 1131 (purple), 802, 936, 999, 1007, 1010, 1028, 1030, 1060, 1061, 1075–1077, 1080, 1085–1090, 1098, 1101, 1107–1111, 1124 (orange); MODA: 868, 918–920, 922–924, 1106–1108, 1088 (purple), 921, 1108 (orange). The proteins are predicted to associate with membrane-bound RhoA-GTP via the right-hand surfaces of their depicted PH domain orientations.

Similar articles

Cited by

References

    1. Diviani D., Baisamy L., Appert-Collin A. (2006) AKAP-Lbc: a molecular scaffold for the integration of cyclic AMP and Rho transduction pathways. Eur. J. Cell Biol. 85, 603–610 - PubMed
    1. Smith F. D., Langeberg L. K., Cellurale C., Pawson T., Morrison D. K., Davis R. J., Scott J. D. (2010) AKAP-Lbc enhances cyclic AMP control of the ERK1/2 cascade. Nat. Cell Biol. 12, 1242–1249 - PMC - PubMed
    1. Carnegie G. K., Smith F. D., McConnachie G., Langeberg L. K., Scott J. D. (2004) AKAP-Lbc nucleates a protein kinase D activation scaffold. Mol. Cell 15, 889–899 - PubMed
    1. Diviani D., Soderling J., Scott J. D. (2001) AKAP-Lbc anchors protein kinase A and nucleates Gα12-selective Rho-mediated stress fiber formation. J. Biol. Chem. 276, 44247–44257 - PubMed
    1. Burmeister B. T., Taglieri D. M., Wang L., Carnegie G. K. (2012) Src homology 2 domain-containing phosphatase 2 (Shp2) is a component of the A-kinase-anchoring protein (AKAP)-Lbc complex and is inhibited by protein kinase A (PKA) under pathological hypertrophic conditions in the heart. J. Biol. Chem. 287, 40535–40546 - PMC - PubMed

Publication types

MeSH terms