On the potential of models for location and scale for genome-wide DNA methylation data
- PMID: 24994026
- PMCID: PMC4227139
- DOI: 10.1186/1471-2105-15-232
On the potential of models for location and scale for genome-wide DNA methylation data
Abstract
Background: With the help of epigenome-wide association studies (EWAS), increasing knowledge on the role of epigenetic mechanisms such as DNA methylation in disease processes is obtained. In addition, EWAS aid the understanding of behavioral and environmental effects on DNA methylation. In terms of statistical analysis, specific challenges arise from the characteristics of methylation data. First, methylation β-values represent proportions with skewed and heteroscedastic distributions. Thus, traditional modeling strategies assuming a normally distributed response might not be appropriate. Second, recent evidence suggests that not only mean differences but also variability in site-specific DNA methylation associates with diseases, including cancer. The purpose of this study was to compare different modeling strategies for methylation data in terms of model performance and performance of downstream hypothesis tests. Specifically, we used the generalized additive models for location, scale and shape (GAMLSS) framework to compare beta regression with Gaussian regression on raw, binary logit and arcsine square root transformed methylation data, with and without modeling a covariate effect on the scale parameter.
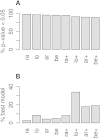
Results: Using simulated and real data from a large population-based study and an independent sample of cancer patients and healthy controls, we show that beta regression does not outperform competing strategies in terms of model performance. In addition, Gaussian models for location and scale showed an improved performance as compared to models for location only. The best performance was observed for the Gaussian model on binary logit transformed β-values, referred to as M-values. Our results further suggest that models for location and scale are specifically sensitive towards violations of the distribution assumption and towards outliers in the methylation data. Therefore, a resampling procedure is proposed as a mode of inference and shown to diminish type I error rate in practically relevant settings. We apply the proposed method in an EWAS of BMI and age and reveal strong associations of age with methylation variability that are validated in an independent sample.
Conclusions: Models for location and scale are promising tools for EWAS that may help to understand the influence of environmental factors and disease-related phenotypes on methylation variability and its role during disease development.
Figures


Similar articles
-
Case-control meta-analysis of blood DNA methylation and autism spectrum disorder.Mol Autism. 2018 Jun 28;9:40. doi: 10.1186/s13229-018-0224-6. eCollection 2018. Mol Autism. 2018. PMID: 29988321 Free PMC article.
-
Imputation of missing covariate values in epigenome-wide analysis of DNA methylation data.Epigenetics. 2016;11(2):132-9. doi: 10.1080/15592294.2016.1145328. Epub 2016 Feb 18. Epigenetics. 2016. PMID: 26890800 Free PMC article.
-
Anxiety Associated Increased CpG Methylation in the Promoter of Asb1: A Translational Approach Evidenced by Epidemiological and Clinical Studies and a Murine Model.Neuropsychopharmacology. 2018 Jan;43(2):342-353. doi: 10.1038/npp.2017.102. Epub 2017 May 25. Neuropsychopharmacology. 2018. PMID: 28540928 Free PMC article.
-
A comparative analysis of cell-type adjustment methods for epigenome-wide association studies based on simulated and real data sets.Brief Bioinform. 2019 Nov 27;20(6):2055-2065. doi: 10.1093/bib/bby068. Brief Bioinform. 2019. PMID: 30099476 Free PMC article. Review.
-
Improved filtering of DNA methylation microarray data by detection p values and its impact on downstream analyses.Clin Epigenetics. 2019 Jan 24;11(1):15. doi: 10.1186/s13148-019-0615-3. Clin Epigenetics. 2019. PMID: 30678737 Free PMC article. Review.
Cited by
-
Parkinson's disease-associated shifts between DNA methylation and DNA hydroxymethylation in human brain in PD-related genes, including PARK19 (DNAJC6) and PTPRN2 (IA-2β).Res Sq [Preprint]. 2024 Jul 15:rs.3.rs-4572401. doi: 10.21203/rs.3.rs-4572401/v1. Res Sq. 2024. PMID: 39070644 Free PMC article. Preprint.
-
A statistical model for the analysis of beta values in DNA methylation studies.BMC Bioinformatics. 2016 Nov 22;17(1):480. doi: 10.1186/s12859-016-1347-4. BMC Bioinformatics. 2016. PMID: 27875981 Free PMC article.
-
Stochastic epigenetic outliers can define field defects in cancer.BMC Bioinformatics. 2016 Apr 22;17:178. doi: 10.1186/s12859-016-1056-z. BMC Bioinformatics. 2016. PMID: 27103033 Free PMC article.
-
Statistical and integrative system-level analysis of DNA methylation data.Nat Rev Genet. 2018 Mar;19(3):129-147. doi: 10.1038/nrg.2017.86. Epub 2017 Nov 13. Nat Rev Genet. 2018. PMID: 29129922 Review.
-
Maternal Smoking during Pregnancy and DNA-Methylation in Children at Age 5.5 Years: Epigenome-Wide-Analysis in the European Childhood Obesity Project (CHOP)-Study.PLoS One. 2016 May 12;11(5):e0155554. doi: 10.1371/journal.pone.0155554. eCollection 2016. PLoS One. 2016. PMID: 27171005 Free PMC article.
References
-
- Portela A, Esteller M. Epigenetic modifications and human disease. Nat Biotechnol. 2010;28:1057–1068. - PubMed
-
- Petersen AK, Zeilinger S, Kastenmüller G, Römisch-Margl W, Brugger M, Peters A, Meisinger C, Strauch K, Hengstenberg C, Pagel P, Huber F, Mohney RP, Grallert H, Illig T, Adamski J, Waldenberger M, Gieger C, Suhre K. Epigenetics meets metabolomics: an epigenome-wide association study with blood serum metabolic traits. Hum Mol Genet. 2014;23(2):534–545. - PMC - PubMed
-
- Dick KJ, Nelson CP, Tsaprouni L, Sandling JK, Aïssi D, Wahl S, Meduri E, Morange PE, Gagnon F, Grallert H, Waldenberger M, Peters A, Erdmann J, Hengstenberg C, Cambien F, Goodall AH, Ouwehand WH, Schunkert H, Thompson JR, Spector TD, Gieger C, Trégouët DA, Deloukas P, Samani NJ. DNA methylation and body-mass index: a genome-wide analysis. The Lancet. 2014;383(9933):1990–1998. - PubMed
Publication types
MeSH terms
LinkOut - more resources
Full Text Sources
Other Literature Sources

