. 2014 Sep;4(9):1074-87.
doi: 10.1158/2159-8290.CD-14-0353. Epub 2014 Jul 3.

Maturation stage of T-cell acute lymphoblastic leukemia determines BCL-2 versus BCL-XL dependence and sensitivity to ABT-199

Affiliations

Maturation stage of T-cell acute lymphoblastic leukemia determines BCL-2 versus BCL-XL dependence and sensitivity to ABT-199

Triona Ni Chonghaile et al. Cancer Discov. 2014 Sep.

Abstract

Acute lymphoblastic leukemia (ALL) is a hematopoietic malignancy derived from immature B-lymphoid and T-lymphoid cells (T-ALL). In T-ALL, there is an early T-cell progenitor (ETP) subgroup that has a very high risk for relapse. In this study, we used mitochondrial BH3 profiling to determine antiapoptotic protein dependencies in T-ALL. We found that T-ALL cell lines and primary patient samples are dependent upon BCL-XL, except when the cancer bears an ETP phenotype, in which case it is BCL-2 dependent. These distinctions directly relate to differential sensitivity to the BH3 mimetics ABT-263 and ABT-199, both in vitro and in vivo. We thus describe for the first time a change of antiapoptotic protein dependence that is related to the differentiation stage of the leukemic clone. Our findings demonstrate that BCL-2 is a clinically relevant target for therapeutic intervention with ABT-199 in ETP-ALL.

Significance: ETP T-ALL is a treatment-resistant subtype of T-ALL for which novel targeted therapies are urgently needed. We have discovered, through BH3 profiling, that ETP-ALL is BCL-2 dependent and is very sensitive to in vitro and in vivo treatment with ABT-199, a drug well tolerated in clinical trials.


Figures

Figure 1
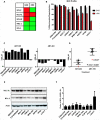
Figure 1. BH3 profiling and in vitro testing of ABT-263 and ABT-199 reveals BCL-XL dependencies in T-ALL
The binding affinities of BH3 peptides BAD and HRK for the anti-apoptotic BCL-2 family. Red indicates high affinity binding, green is non-detectable binding measured by fluorescence polarization Assay (14) (A). The BAD and HRK responses from the BH3 profiles of T-ALL cell lines are plotted. The mean +/− standard deviations of three independent experiments are graphed (B). The cell lines were treated with a six-point dose range from 1nM to 10μM of ABT-263 and ABT-199 for 48 hrs and apoptosis was measured by Annexin V and Propidium Iodide staining. The average of three independent experiments was used to generate dose response curves in graphpad prism. The IC50 in μM is graphed for each cell line (C). There is a statistical difference between the IC50 for ABT-263 versus ABT-199 in the T-ALL lines. The ETP cell line LOUCY is shown in red (D). Western blot analysis shows expression of BCL-2 and BCL-XL in the T-ALL cell lines (E). The mean ratio +/− SEM of BCL-2 expression divided by BCL-XL expression measured by densitometry of three independent plots is graphed (F).
Figure 2
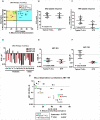
Figure 2. BH3 profiling reveals BCL-2 dependencies in primary ETP COG T-ALL samples
BH3 profiling of pediatric COG T-ALL primary samples prior to initiating treatment. The mean of the BAD and HRK responses are graphed +/− standard deviation from three replicate wells (A). A dot plot of the BAD peptide response versus the HRK peptide response is graphed. The ETP cases as defined by immunophenotypic analysis are marked in red (B). The yellow color indicates probable BCL-2 dependence while the blue color indicates probable BCL-XL dependence. The BAD peptide response (C), the HRK peptide response (D), and BAD minus HRK peptide response was graphed for ETP versus typical T-ALL samples (E). Statistical significance was calculated using the non-parametric Mann-Whitney test.
Figure 3
Figure 3. BCL-2 and BCL-XL expression alters with maturation stage of the T-Cell
BCL-2 and BCL-XL protein expression was measured by FACs analysis, the gating strategy for distinguishing the different stages of T-cell differentiation is shown in (Fig. S3).The expression of BCL-2 and BCL-XL is normalized to the double positive stage, the experiment was repeated three times and mean +/− SD is graphed (A). The mRNA expression of BCL-2 is shown for primary human cells at the listed stages of differentiation. This data is modified from the online database (37) (B). The mRNA expression of BCL-2 and BCL-XL in both ETP and typical T-ALL is graphically depicted in a heat map with red indicating high expression and blue indicating low expression. The data is modified from the published online database (C) (38). (D) The BCL-2/BCL-XL and MCL-1 protein levels are shown for the typical human T-ALL cell lines and samples (T-ALL-x-4,−9,−1,−2) as well as the ETP-ALL cell line LOUCY and the relapsed ETP-ALL sample (T-ALL-x-11). (E) Ratio of BCL-2/BCL-XL protein is shown for the cell lines and primary samples examined in D.
Figure 4
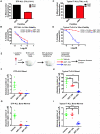
Figure 4. BH3 profiling reveals BCL-2 dependence in ETP-ALL in a separate cohort of DFCI patient samples
BH3 profiling of pediatric and adult DFCI T-ALL primary samples prior to initiating treatment. A dot plot of BAD peptide versus HRK peptide is graphed, ETP are marked in red and green indicates ETP status was not determined (A). The yellow color indicates putative BCL-2 dependence while the blue color indicates putative BCL-XL dependence. The BAD peptide response (B) and the HRK peptide response (C) are plotted for ETP versus typical T-ALL samples. Statistical significance was calculated using the non-parametric Mann-Whitney test. The primary DFCI T-ALL samples were treated with a six-point dose range from 1nM to 10μM of ABT-263 and ABT-199 for 6 hrs and apoptosis was measured by Annexin V and Propidium Iodide staining. The IC50 of ABT-263 and ABT-199 are graphed (D). The ABT-263 (E) and ABT-199 (F) response was compared between the typical T-ALL and ETP-ALL samples. The IC50 for ABT-199 is correlated to the BAD minus the HRK peptide % mitochondrial depolarization (G). Correlation was calculated using the non-parametric Spearman r test. Red marks the ETP cases, green marks cases with undetermined ETP status and black marks typical T-ALL.
Figure 5
Figure 5. Patient-derived xenograft of ETP-ALL is very sensitive to in vivo treatment with ABT-199 while typical T-ALL is relatively resistant
Primagrafts were generated from two primary T-ALL samples one sample was identified as ETP by immunophenotypic analysis (TALL-x-11) while the other was identified as typical T-ALL (TALL-x-2). The mean BAD and HRK peptide response of triplicate wells are plotted +/− SD for the ETP-ALL sample (A). The in vitro response to ABT-199 and ABT-263 was measured using Annexin V and Propidium iodide following 6 hrs of treatment for the ETP-ALL sample. The % survival is graphed on the dose response curve and the subsequent IC50 values are listed (B). Similar results are shown for the typical T-ALL sample, the BAD and HRK response from the BH3 profile are graphed (C) and % survival following ABT-199 and ABT-263 treatment (D). 1 × 10⁶ cells of either the ETP-ALL sample or the typical T-ALL samples were injected in the tail vein of NSG mice until an engraftment of 65% human CD45+ cells (E). The animals were then randomized into vehicle, ABT-199 or ABT-263 treatment (100mg/kg by oral gavage daily). The in vivo response to ABT-199 and ABT-263 was measured by counting the total human CD45+ leukocytes in the blood (F) and in the bone marrow (G) at the end of the two-weeks of treatment in the ETP-ALL sample. Similar in vivo experiments were carried out with the typical T-ALL sample with total human CD45+ in the blood (H) and in the bone marrow (I) measurements shown following two-weeks of treatment.
Figure 6
Figure 6. Schematic of T-cell differentiation and BCL-2/BCL-XL dependence in ETP-ALL and typical T-ALL
During T-cell maturation the most immature T-cells express CD34 but do not express CD4 or CD8 hence they are referred to as double negative (DN). As the cells mature they express both CD4 and CD8 to become double-positive thymocytes. Thymocytes that survive both positive and negative selection become mature CD4 or CD8 single positive T-cells. There is a reciprocal dependence on BCL-2 during the immature double negative stage, which changes to BCL-XL dependence during the double-positive (CD4+ and CD8+) stage of differentiation. Malignancy arising in an immature T-cell ETP-ALL is dependent on BCL-2 and sensitive to both the BCL-2 selective BH3 mimetic ABT-199 and ABT-263 (binds BCL-2, BCL-XL and BCL-w). In contrast malignancy arising from the more mature double-positive T-cells (typical T-ALL) is dependent on BCL-XL and selectively sensitive to the ABT-263 BH3 mimetic.

References

    1. Pui CH, Robison LL, Look AT. Acute lymphoblastic leukaemia. Lancet. 2008;371:1030–1043. - PubMed
    1. Coustan-Smith E, Mullighan CG, Onciu M, Behm FG, Raimondi SC, Pei D, et al. Early T-cell precursor leukaemia: a subtype of very high-risk acute lymphoblastic leukaemia. The lancet oncology. 2009;10:147–156. - PMC - PubMed
    1. Gutierrez A, Dahlberg SE, Neuberg DS, Zhang J, Grebliunaite R, Sanda T, et al. Absence of biallelic TCRgamma deletion predicts early treatment failure in pediatric T-cell acute lymphoblastic leukemia. Journal of clinical oncology : official journal of the American Society of Clinical Oncology. 2010;28:3816–3823. - PMC - PubMed
    1. Del Gaizo Moore V, Schlis KD, Sallan SE, Armstrong SA, Letai A. BCL-2 dependence and ABT-737 sensitivity in acute lymphoblastic leukemia. Blood. 2008;111:2300–2309. - PMC - PubMed
    1. Letai A, Beard C, Sorcinelli M, Korsmeyer SJ. Anti-apoptotic BCL-2 is required for maintenance of a model leukemia. Cancer Cell. 2004;6:241–249. - PubMed

Publication types

MeSH terms