

Wide-field imaging and flow cytometric analysis of cancer cells in blood by fluorescent nanodiamond labeling and time gating
- PMID: 24994610
- PMCID: PMC4081895
- DOI: 10.1038/srep05574
Wide-field imaging and flow cytometric analysis of cancer cells in blood by fluorescent nanodiamond labeling and time gating
Abstract
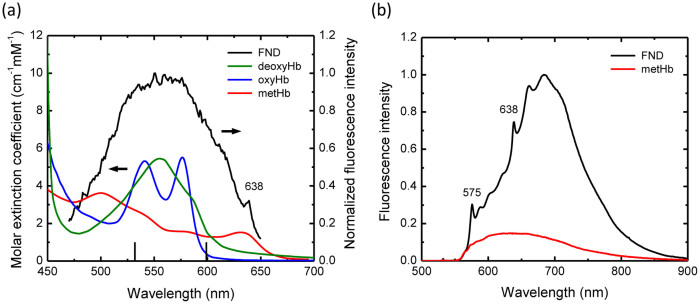
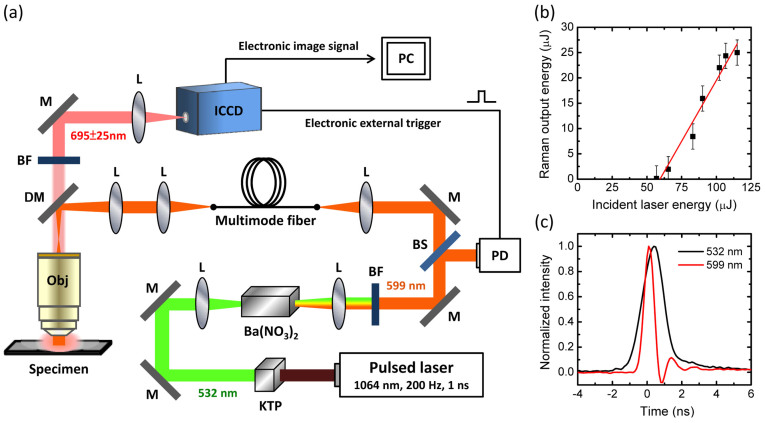
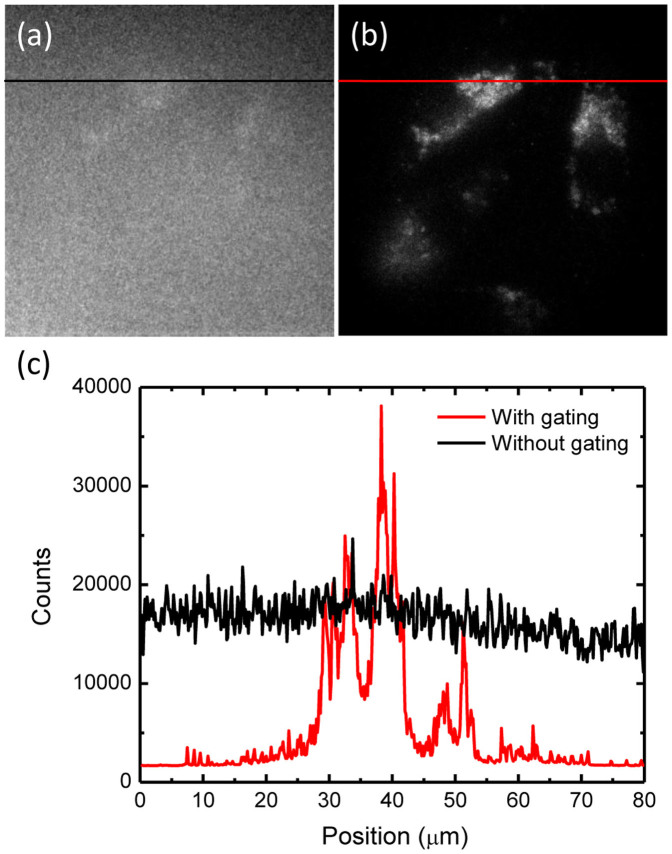
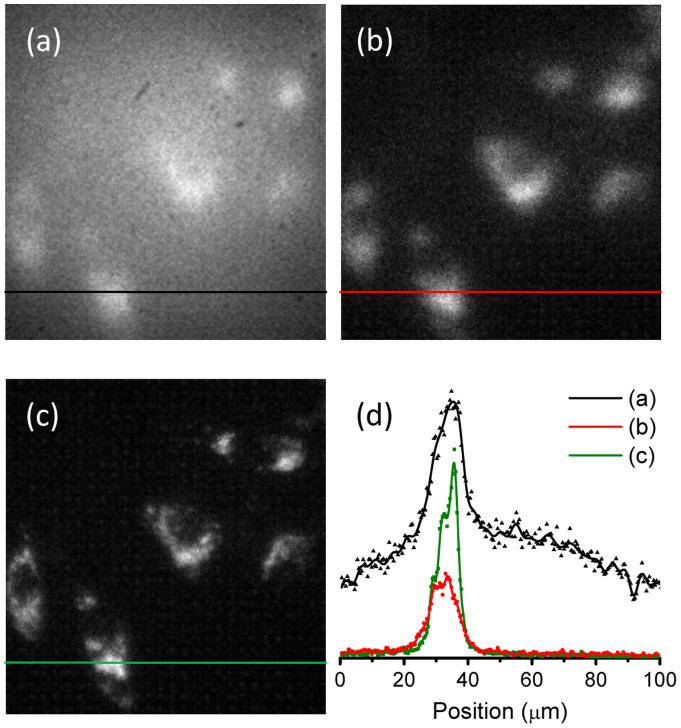
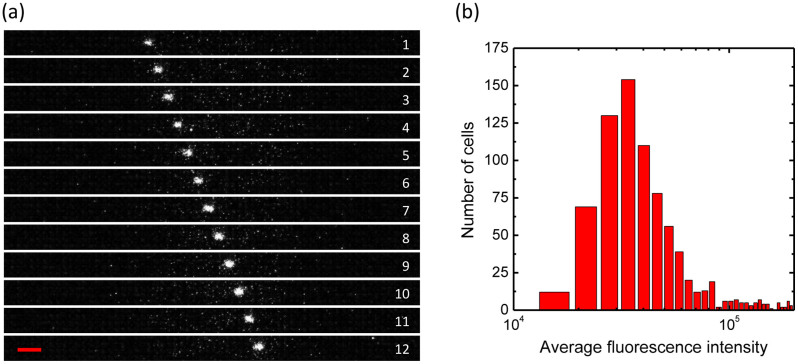
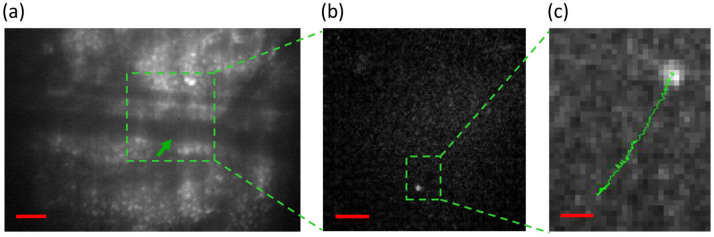
Nanodiamonds containing high density ensembles of negatively charged nitrogen-vacancy (NV(-)) centers are promising fluorescent biomarkers due to their excellent photostability and biocompatibility. The NV(-) centers in the particles have a fluorescence lifetime of up to 20 ns, which distinctly differs from those (<10 ns) of cell and tissue autofluorescence, making it possible to achieve background-free detection in vivo by time gating. Here, we demonstrate the feasibility of using fluorescent nanodiamonds (FNDs) as optical labels for wide-field time-gated fluorescence imaging and flow cytometric analysis of cancer cells with a nanosecond intensified charge-coupled device (ICCD) as the detector. The combined technique has allowed us to acquire fluorescence images of FND-labeled HeLa cells in whole blood covered with a chicken breast of ~0.1-mm thickness at the single cell level, and to detect individual FND-labeled HeLa cells in blood flowing through a microfluidic device at a frame rate of 23 Hz, as well as to locate and trace FND-labeled lung cancer cells in the blood vessels of a mouse ear. It opens a new window for real-time imaging and tracking of transplanted cells (such as stem cells) in vivo.
Figures
Similar articles
-
The exocytosis of fluorescent nanodiamond and its use as a long-term cell tracker.Small. 2011 Dec 2;7(23):3363-70. doi: 10.1002/smll.201101233. Epub 2011 Oct 14. Small. 2011. PMID: 21997958
-
Fluorescent Nanodiamond: A Versatile Tool for Long-Term Cell Tracking, Super-Resolution Imaging, and Nanoscale Temperature Sensing.Acc Chem Res. 2016 Mar 15;49(3):400-7. doi: 10.1021/acs.accounts.5b00484. Epub 2016 Feb 16. Acc Chem Res. 2016. PMID: 26882283
-
Targeting Fluorescent Nanodiamonds to Vascular Endothelial Growth Factor Receptors in Tumor.Bioconjug Chem. 2019 Mar 20;30(3):604-613. doi: 10.1021/acs.bioconjchem.8b00803. Epub 2019 Jan 31. Bioconjug Chem. 2019. PMID: 30633508 Free PMC article.
-
Synthesis, Characterization, Properties, and Novel Applications of Fluorescent Nanodiamonds.J Fluoresc. 2022 May;32(3):863-885. doi: 10.1007/s10895-022-02898-2. Epub 2022 Mar 1. J Fluoresc. 2022. PMID: 35230567 Review.
-
Fluorescent Nanodiamond Applications for Cellular Process Sensing and Cell Tracking.Micromachines (Basel). 2018 May 18;9(5):247. doi: 10.3390/mi9050247. Micromachines (Basel). 2018. PMID: 30424180 Free PMC article. Review.
Cited by
-
Selective Addressing of Versatile Nanodiamonds via Physically-Enabled Classifier in Complex Biosystems.Nano Lett. 2025 Apr 9;25(14):5679-5687. doi: 10.1021/acs.nanolett.4c06567. Epub 2025 Mar 14. Nano Lett. 2025. PMID: 40085441 Free PMC article.
-
Targeting Nanodiamonds to the Nucleus in Yeast Cells.Nanomaterials (Basel). 2020 Oct 2;10(10):1962. doi: 10.3390/nano10101962. Nanomaterials (Basel). 2020. PMID: 33023102 Free PMC article.
-
In vivo noninvasive microscopy of human leucocytes.Sci Rep. 2017 Oct 12;7(1):13031. doi: 10.1038/s41598-017-13555-1. Sci Rep. 2017. PMID: 29026161 Free PMC article.
-
Nanodiamonds-induced effects on neuronal firing of mouse hippocampal microcircuits.Sci Rep. 2018 Feb 2;8(1):2221. doi: 10.1038/s41598-018-20528-5. Sci Rep. 2018. PMID: 29396456 Free PMC article.
-
Nanomedicines for Near-Infrared Fluorescent Lifetime-Based Bioimaging.Front Bioeng Biotechnol. 2019 Dec 6;7:386. doi: 10.3389/fbioe.2019.00386. eCollection 2019. Front Bioeng Biotechnol. 2019. PMID: 31867317 Free PMC article. Review.
References
-
- Kircher M. F., Gambhir S. S. & Grimm J. Noninvasive cell-tracking methods. Nat. Rev. Clin. Oncol. 8, 677–688 (2011). - PubMed
-
- Baker M. Nanotechnology imaging probes: Smaller and more stable. Nat. Methods 7, 957–962 (2010).
-
- Mochalin V. N., Shenderova O., Ho D. & Gogotsi Y. The properties and applications of nanodiamonds. Nat. Nanotechnol. 7, 11–23 (2012). - PubMed
-
- Hui Y. Y., Cheng C.-L. & Chang H.-C. Nanodiamonds for optical bioimaging. J. Phys. D: Appl. Phys. 43, 374021 (2010).
-
- Tisler J. et al. Fluorescence and spin properties of defects in single digit nanodiamonds. ACS Nano 3, 1959–1965 (2009). - PubMed
Publication types
MeSH terms
Substances
LinkOut - more resources
Full Text Sources
Other Literature Sources
Miscellaneous
