

Hippocampal subregions exhibit both distinct and shared transcriptomic responses to aging and nonneurodegenerative cognitive decline
- PMID: 24994846
- PMCID: PMC4271093
- DOI: 10.1093/gerona/glu091
Hippocampal subregions exhibit both distinct and shared transcriptomic responses to aging and nonneurodegenerative cognitive decline
Abstract
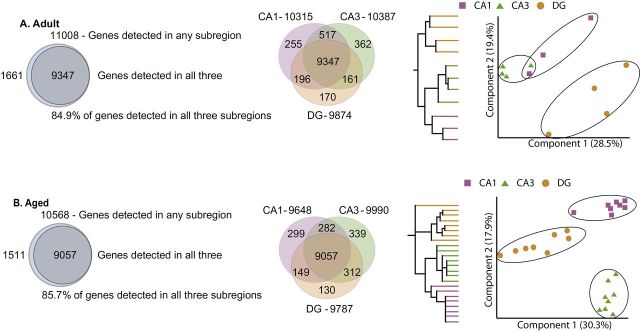
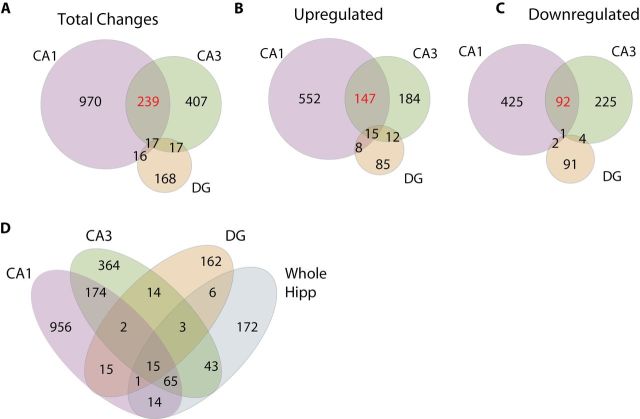
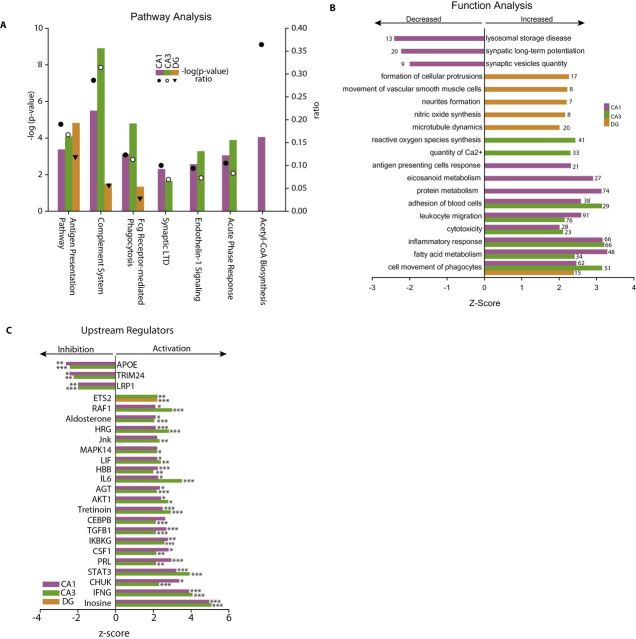
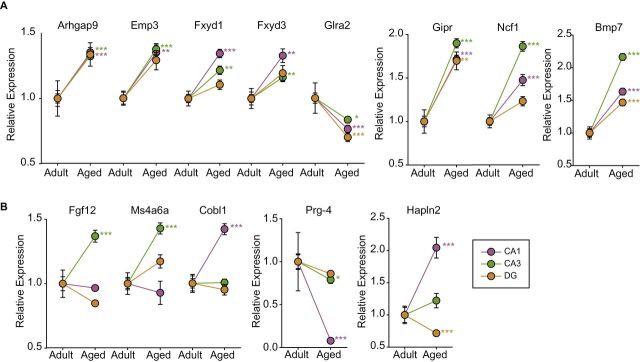
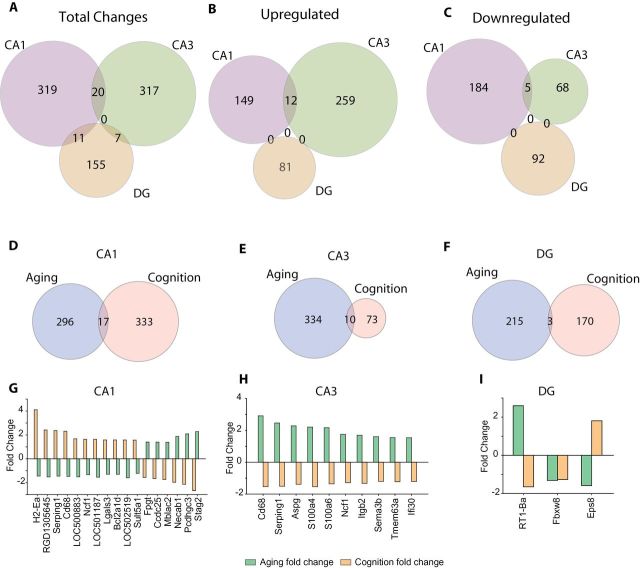
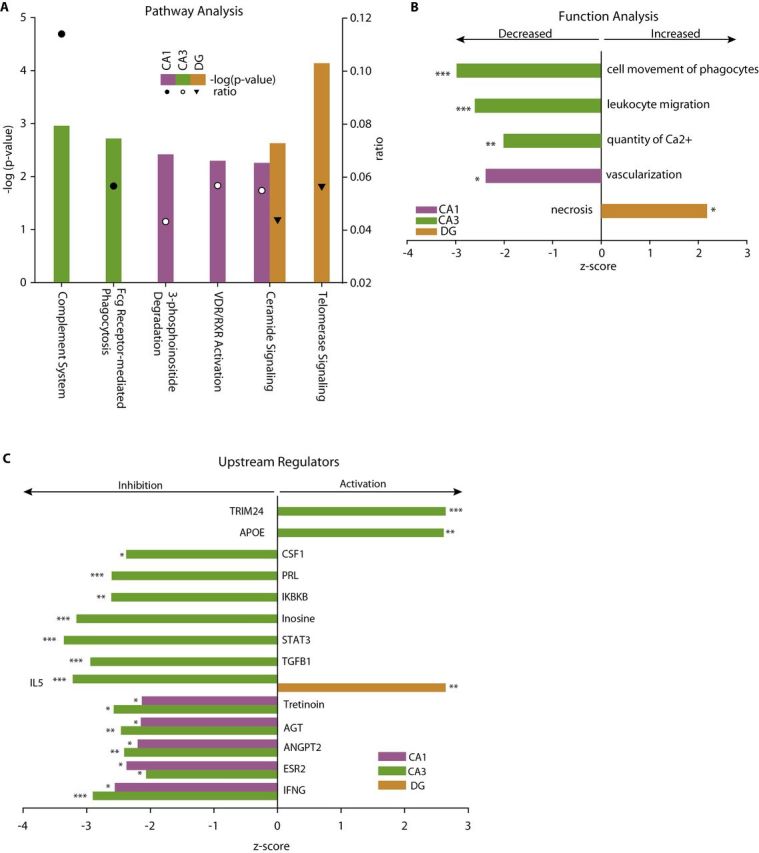
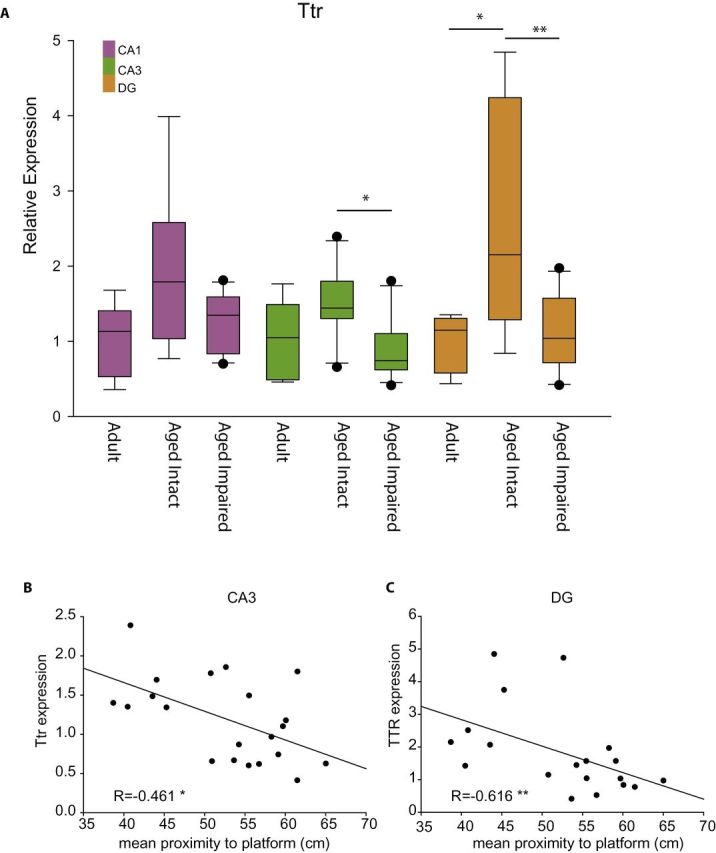
Impairment of hippocampal-dependent spatial learning and memory with aging affects a large segment of the aged population. Hippocampal subregions (CA1, CA3, and DG) have been previously reported to express both common and specific morphological, functional, and gene/protein alterations with aging and cognitive decline. To comprehensively assess gene expression with aging and cognitive decline, transcriptomic analysis of CA1, CA3, and DG was conducted using Adult (12M) and Aged (26M) F344xBN rats behaviorally characterized by Morris water maze performance. Each subregion demonstrated a specific pattern of responses with aging and with cognitive performance. The CA1 and CA3 demonstrating the greatest degree of shared gene expression changes. Analysis of the pathways, processes, and regulators of these transcriptomic changes also exhibit a similar pattern of commonalities and differences across subregions. Gene expression changes between Aged cognitively Intact and Aged cognitively Impaired rats often showed an inversion of the changes between Adult and Aged rats. This failure to adapt rather than an exacerbation of the aging phenotype questions a conventional view that cognitive decline is exaggerated aging. These results are a resource for investigators studying cognitive decline and also demonstrate the need to individually examine hippocampal subregions in molecular analyses of aging and cognitive decline.
Keywords: Aging; Cognitive impairment.; Gene expression; Hippocampus.
© The Author 2014. Published by Oxford University Press on behalf of The Gerontological Society of America. All rights reserved. For permissions, please e-mail: journals.permissions@oup.com.
Figures
Similar articles
-
Concurrent hippocampal induction of MHC II pathway components and glial activation with advanced aging is not correlated with cognitive impairment.J Neuroinflammation. 2011 Oct 11;8:138. doi: 10.1186/1742-2094-8-138. J Neuroinflammation. 2011. PMID: 21989322 Free PMC article.
-
Hippocampal Subregion Transcriptomic Profiles Reflect Strategy Selection during Cognitive Aging.J Neurosci. 2020 Jun 17;40(25):4888-4899. doi: 10.1523/JNEUROSCI.2944-19.2020. Epub 2020 May 6. J Neurosci. 2020. PMID: 32376783 Free PMC article.
-
Hippocampal expression of myelin-associated inhibitors is induced with age-related cognitive decline and correlates with deficits of spatial learning and memory.J Neurochem. 2012 Apr;121(1):77-98. doi: 10.1111/j.1471-4159.2012.07671.x. Epub 2012 Feb 10. J Neurochem. 2012. PMID: 22269040 Free PMC article.
-
A behavioral assessment of hippocampal function based on a subregional analysis.Rev Neurosci. 2004;15(5):333-51. doi: 10.1515/revneuro.2004.15.5.333. Rev Neurosci. 2004. PMID: 15575490 Review.
-
Subtle Alterations in Glutamatergic Synapses Underlie the Aging-Related Decline in Hippocampal Function.In: Riddle DR, editor. Brain Aging: Models, Methods, and Mechanisms. Boca Raton (FL): CRC Press/Taylor & Francis; 2007. Chapter 8. In: Riddle DR, editor. Brain Aging: Models, Methods, and Mechanisms. Boca Raton (FL): CRC Press/Taylor & Francis; 2007. Chapter 8. PMID: 21204357 Free Books & Documents. Review.
Cited by
-
Age-Induced Spatial Memory Deficits in Rats Are Correlated with Specific Brain Region Alterations in Microglial Morphology and Gene Expression.J Neuroimmune Pharmacol. 2019 Jun;14(2):251-262. doi: 10.1007/s11481-018-9817-2. Epub 2018 Oct 20. J Neuroimmune Pharmacol. 2019. PMID: 30343448
-
Assessment of individual differences in the rat nucleus accumbens transcriptome following taste-heroin extended access.Brain Res Bull. 2016 May;123:71-80. doi: 10.1016/j.brainresbull.2015.12.005. Epub 2015 Dec 28. Brain Res Bull. 2016. PMID: 26733446 Free PMC article.
-
Hippocampal Changes Elicited by Metabolic and Inflammatory Stressors following Prenatal Maternal Infection.Genes (Basel). 2022 Dec 26;14(1):77. doi: 10.3390/genes14010077. Genes (Basel). 2022. PMID: 36672818 Free PMC article.
-
Regional Hippocampal Atrophy and Higher Levels of Plasma Amyloid-Beta Are Associated With Subjective Memory Complaints in Nondemented Elderly Subjects.J Gerontol A Biol Sci Med Sci. 2016 Sep;71(9):1210-5. doi: 10.1093/gerona/glw022. Epub 2016 Mar 4. J Gerontol A Biol Sci Med Sci. 2016. PMID: 26946100 Free PMC article.
-
Tamoxifen induction of Cre recombinase does not cause long-lasting or sexually divergent responses in the CNS epigenome or transcriptome: implications for the design of aging studies.Geroscience. 2019 Oct;41(5):691-708. doi: 10.1007/s11357-019-00090-2. Epub 2019 Sep 7. Geroscience. 2019. PMID: 31493147 Free PMC article.
References
-
- Hedden T, Gabrieli JD. Insights into the ageing mind: a view from cognitive neuroscience. Nat Rev Neurosci. 2004;5:87–96. :10.1038/nrn1323 - PubMed
-
- Umegaki H, Hayashi T, Nomura H, et al. Cognitive dysfunction: an emerging concept of a new diabetic complication in the elderly. Geriatr Gerontol Int. 2013;13:28–34. :10.1111/j.1447-0594.2012.00922.x - PubMed
-
- Schaie KW. Intellectual Development in Adulthood: The Seattle Longitudinal Study. Cambridge: Cambridge University Press; 1996.
Publication types
MeSH terms
Grants and funding
LinkOut - more resources
Full Text Sources
Other Literature Sources
Medical
Molecular Biology Databases
Miscellaneous
