. 2014 Jul 3;55(8):4853-62.
doi: 10.1167/iovs.14-14353.

Molecular changes and vision loss in a mouse model of closed-globe blast trauma

Affiliations

Molecular changes and vision loss in a mouse model of closed-globe blast trauma

Courtney Bricker-Anthony et al. Invest Ophthalmol Vis Sci. .

Erratum in

  • Erratum.
    [No authors listed] [No authors listed] Invest Ophthalmol Vis Sci. 2016 Aug 1;57(10):4367. doi: 10.1167/iovs.14-14353a. Invest Ophthalmol Vis Sci. 2016. PMID: 27579667 Free PMC article. No abstract available.

Abstract

Purpose: To characterize retinal changes and assess vision after an eye-directed air blast.

Methods: Adult C57Bl/6 mice were exposed to a blast directed at one eye. Optical coherence tomography and histology were performed to assess retina and optic nerve integrity. Cell death, oxidative stress, and glial reactivity were examined by immunohistochemistry. Visual changes were measured by ERG recordings and the optokinetic reflex.

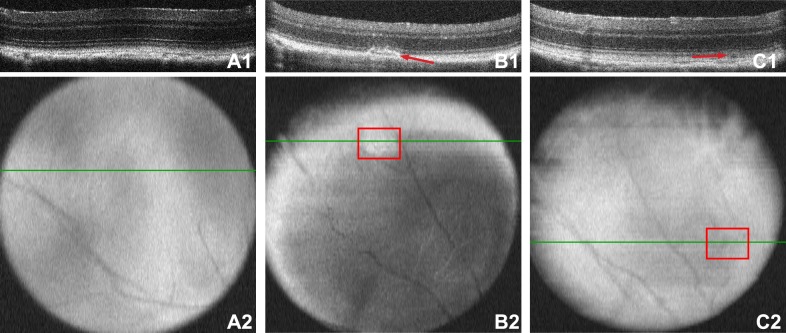
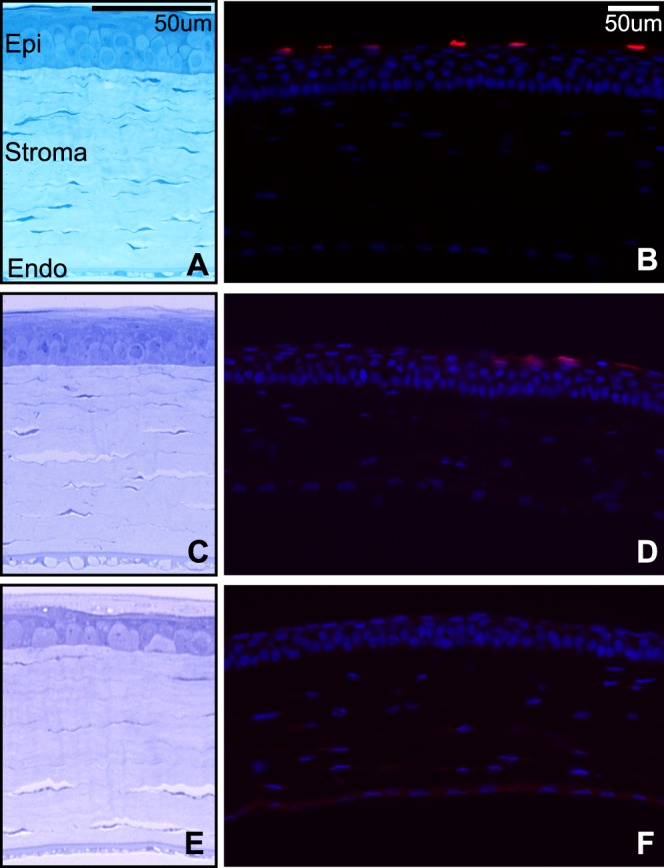
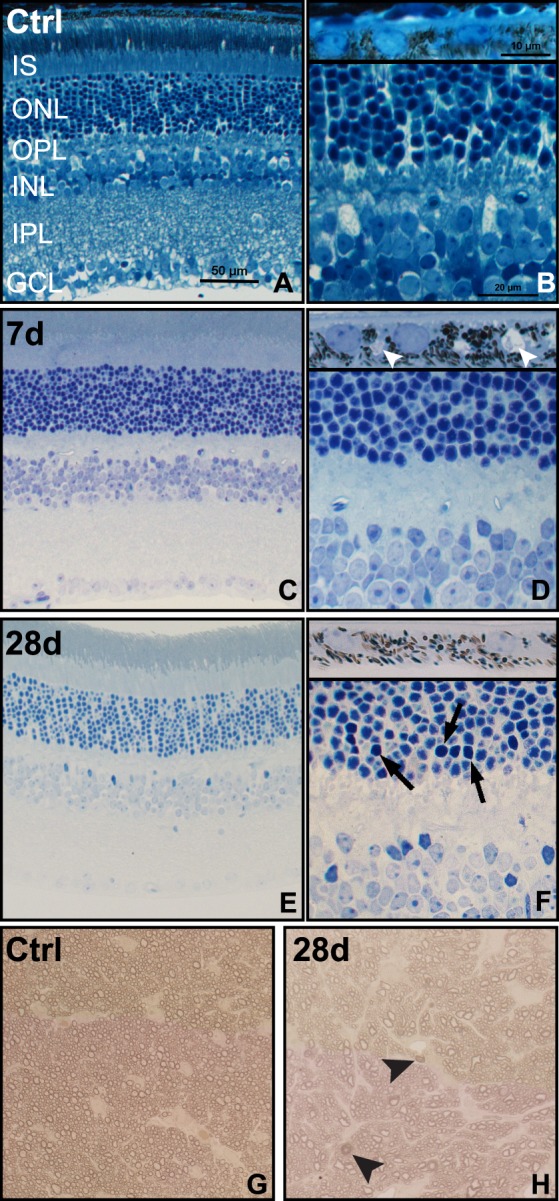
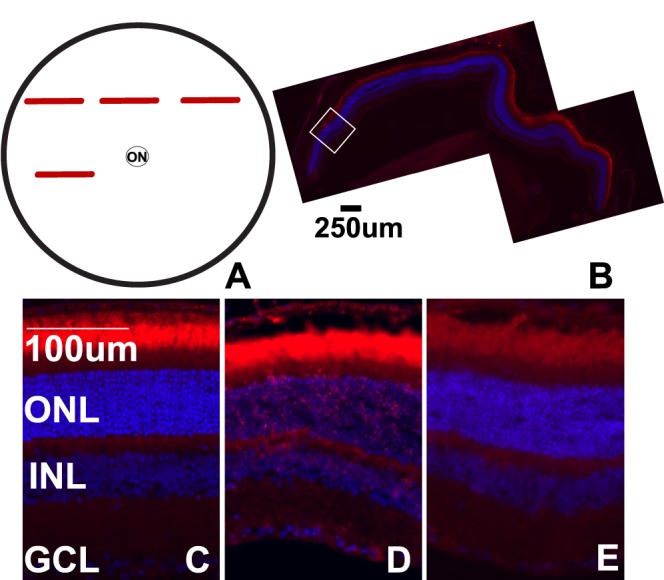
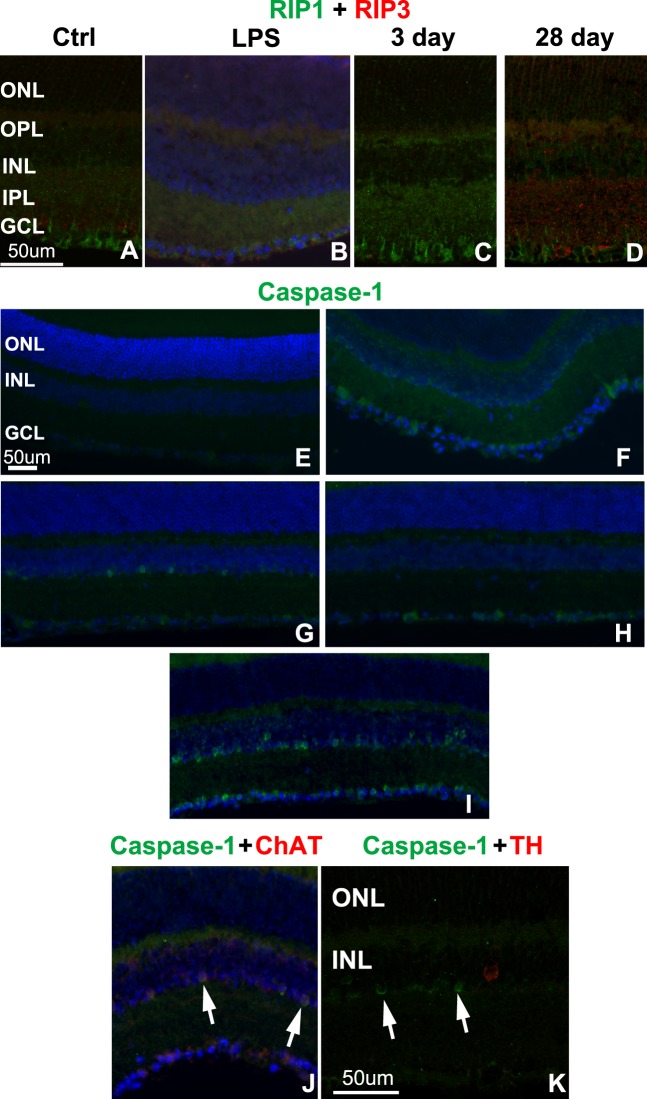
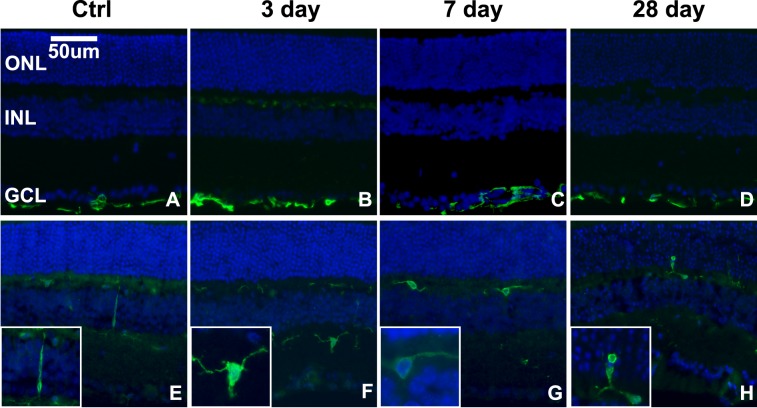
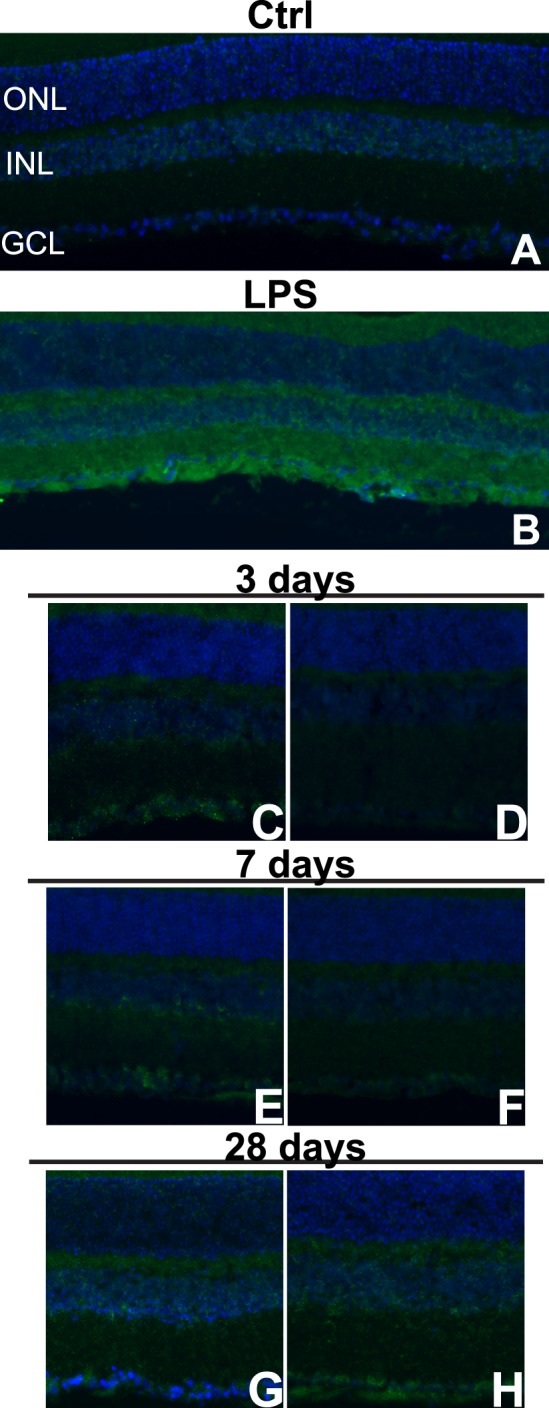
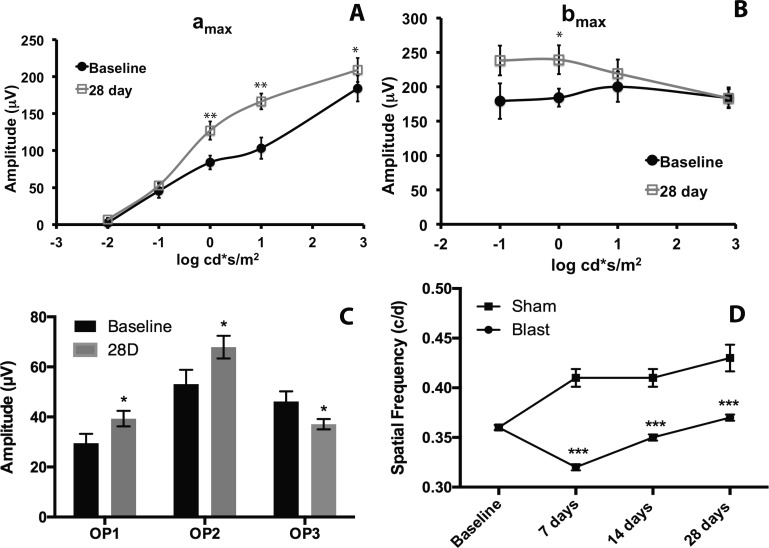
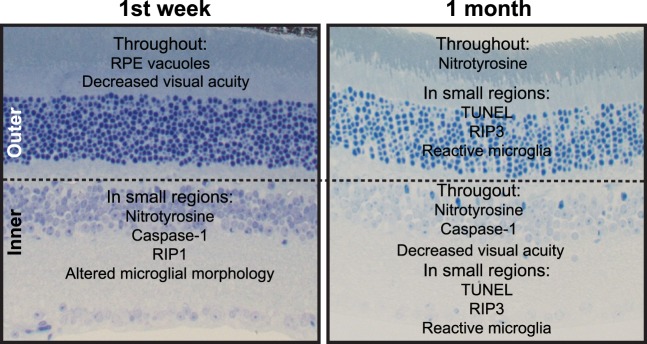
Results: In the outer retina, eye blast caused retinal pigment epithelium vacuoles and rare retinal detachments followed by regional cell death. Labeling for nitrotyrosine and markers of pyroptosis (caspase-1) and necroptosis (receptor-interacting protein kinases-1, -3) increased, primarily in the inner retina, after blast. Caspase-1 labeling was restricted primarily to the starburst amacrine cells. A few degenerating axons were detected at 28 days post blast. Despite a lack of substantial cell death or decreased ERG, there was a deficit in visual acuity after blast.

Conclusions: Oxidative stress, neuroinflammation, and cell death became increasingly prevalent, over time post blast suggestive of an ongoing neurodegenerative response. Outer retinal changes either resolved or remained focal. In contrast, inner retinal changes were more robust and spread from focal regions to the entire retina over time post blast. Our model of eye blast trauma causes molecular changes and a decrease in visual acuity within the first month post blast despite a lack of overt eye injury. This subtle response matches the delayed presentation of visual deficits in some blast-exposed Veterans.

Keywords: cell death pathways; oxidative stress; trauma; visual deficits.


Figures

Figure 1
Figure 1
Ocular trauma induces retinal detachments and outer segment damage. Prior to blast, the retinas appear normal (A). The green lines in the retinal surface images (A2C2) denote the location of the b-scan images (A1C1). Outer segment disruption in the midperipheral retina 7 days post injury (B1) appears as a patchy white area in the fundus scan ([B2], red box). A small retinal detachment in the midperipheral retina 28 days post injury (C1) appears as a small shadow in the fundus image ([C2], red box).
Figure 2
Figure 2
(A, C, E) Brightfield micrographs of control (A), 7- (C), and 28-day (E) postblast corneas. (B, D, F) Epifluorescence micrographs of TUNEL (red) and DAPI (blue) in control (B), 7- (D), and 28-day (F) postblast corneas. Epi, epithelium; Endo, endothelium.
Figure 3
Figure 3
Brightfield micrographs reveal pyknotic nuclei, RPE vacuoles and axonal degeneration after blast. (A, B) Control (Ctrl) retina and RPE ([B], inset). (C, D) Seven-day postblast retina and RPE ([D], inset), small arrowheads indicate RPE vacuoles. (EF) Twenty-eight-day postinjury retina and RPE ([F], inset), arrows indicate pyknotic nuclei. (G, H) Control (G) and 28-day postblast (H) optic nerves, arrowheads indicate degenerating axons.
Figure 4
Figure 4
Cell death post blast is focal. (A) Schematic of a flat-mount view of the retina, red bars indicate regions within retinal cross-sections that are TUNEL-positive. (B) Epifluorescence micrograph of a TUNEL-positive midperipheral retinal cross-section from a 28-day postblast eye. The white box indicates an area of TUNEL-positive cells. (CE) Representative epifluorescence micrographs of retinas from control (C), or 28-day postblast retinas labeled with TUNEL (red) and DAPI (blue). Affected (D) and unaffected (E) retinal regions from the same blast eye are shown. ON, optic nerve.
Figure 5
Figure 5
Increased labeling of cell death pathway markers after blast. (AC) Confocal micrographs of RIP1 (green) and RIP3 (red) immunolabeling in control (A), LPS-injected (B), and affected regions of 3- (C) and 28-day (D) postblast retinas. (EI) Epifluorescence micrographs show caspase-1 immunolabeling (green) in control (E), LPS-injected (F), and affected areas (midperiphery) of 3- (G) and 7- (H) day postblast retinas. The entire retina was positive at 28 days post blast (I). (J, K) Epifluorescence micrographs of caspase-1 (green) and ChAT (red, [J]) or TH (red, [K]) double-labeling, arrows indicate caspase-1 positive nuclei. DAPI-labeled nuclei (blue).
Figure 6
Figure 6
Microglia, but not Müller glia, become reactive in response to blast in focal regions of the retina. (AD) Epifluorescence micrographs of GFAP immunolabeling (green) in control (A) and in 3- (B), 7- (C), and 28- (D) day postblast retinas. (EH) Iba-1 immunolabeling (green) of microglia in control (E), 3- (F), 7- (G), and 28- (H) day postblast retinas. Insets show higher magnification of representative microglia. DAPI-labeled nuclei (blue).
Figure 7
Figure 7
Nitrotyrosine immunolabeling increases regionally following blast. (AH) Epifluorescence micrographs of control (A), LPS-injected (B), and midperipheral (C, E, G) and central (D, F, H) regions of 3- (C, D), 7- (E, F), and 28- (G, H) day postblast retinas labeled with antinitrotyrosine (green) and DAPI (blue).
Figure 8
Figure 8
Blast causes visual deficits. (A) Graph of the ERG amax over a range of light intensities. The amax is significantly increased at 28 days post blast (squares) as compared with baseline (circles; *P < 0.05, **P < 0.01). (B) Graph of the ERG bmax over a range of light intensities. The bmax was increased at 0 log cd*s/m2 (P < 0.05). (C) Graph of oscillatory potential (OP) amplitudes at baseline and 28 days post blast. Oscillatory potential 1 and OP2 are increased (*P < 0.05), and OP3 is decreased at 28 days post blast (*P < 0.05). (D) Graph of the spatial frequency threshold over time in sham (squares) and blast-exposed (circles) mice. The visual acuity is significantly decreased in blast-exposed animals as compared with sham animals at 7, 14, and 28 days post injury. *P < 0.05, **P < 0.01.
Figure 9
Figure 9
Summary of inner and outer retinal changes after blast injury.

References

    1. Organization WH. Priority eye disease: corneal opacities. Available at: http://www.who.int/blindness/causes/priority/en/index9.html. Accessed September 15, 2013
    1. Scott R. The injured eye. Philos Trans R Soc Lond Biol Sci. 2011; 366: 251–260 - PMC - PubMed
    1. Cockerham G, Goodrich G, Weichel E, et al. Eye and visual function in traumatic brain injury. J Rehab Res Develop. 2009; 46: 811–818 - PubMed
    1. Cockerham G, Rice T, Hewes E, et al. Closed-eye ocular injuries in the Iraq and Afghanistan wars. New Engl J Med. 2011; 364: 2172–2173 - PubMed
    1. Weichel E, Colyer M, Bautista C, Bower K, French L. Traumatic brain injury associated with combat ocular trauma. J Head Trauma Rehab. 2009; 24: 41–50 - PubMed

Publication types

MeSH terms