. 2014 Jul 22;111(29):10598-603.
doi: 10.1073/pnas.1410022111. Epub 2014 Jul 3.

Dynamic regulation of eve stripe 2 expression reveals transcriptional bursts in living Drosophila embryos

Affiliations

Dynamic regulation of eve stripe 2 expression reveals transcriptional bursts in living Drosophila embryos

Jacques P Bothma et al. Proc Natl Acad Sci U S A. .

Abstract

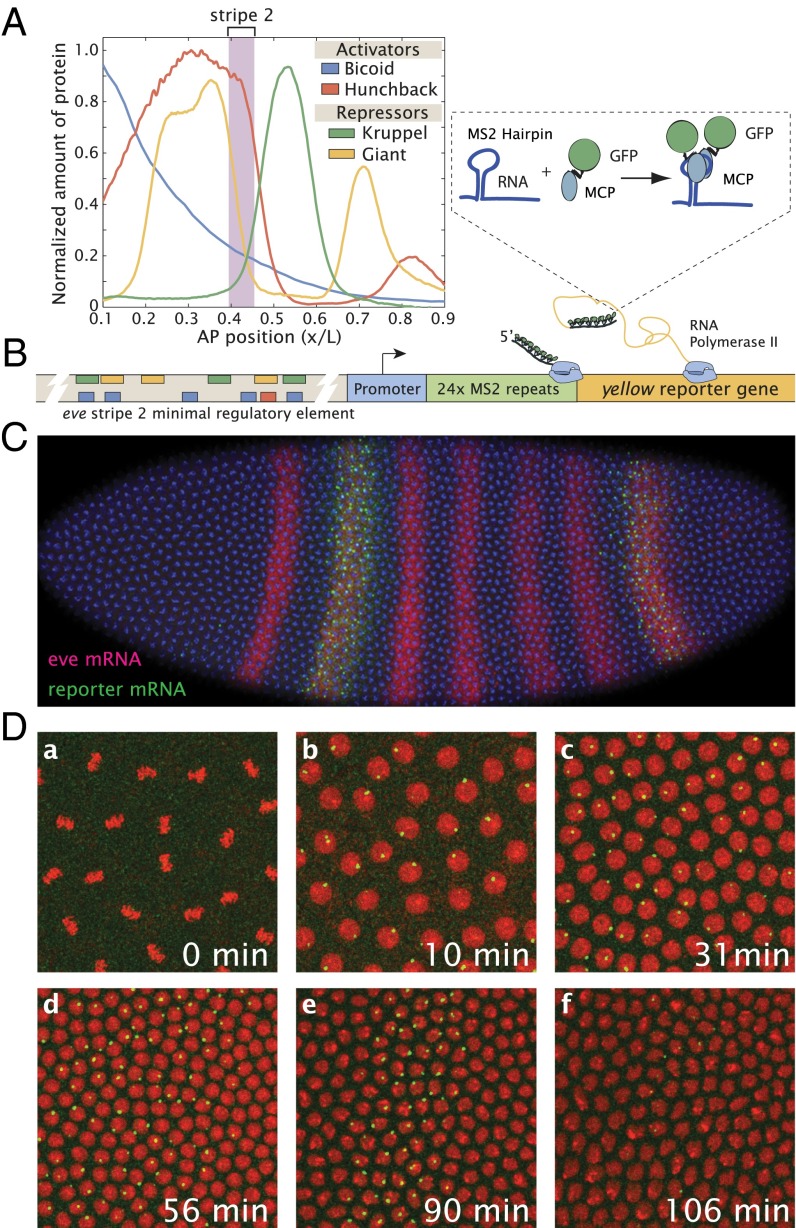
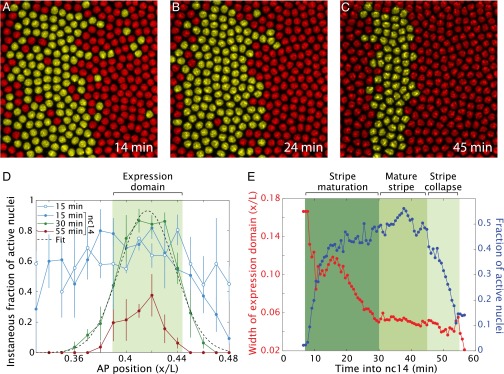
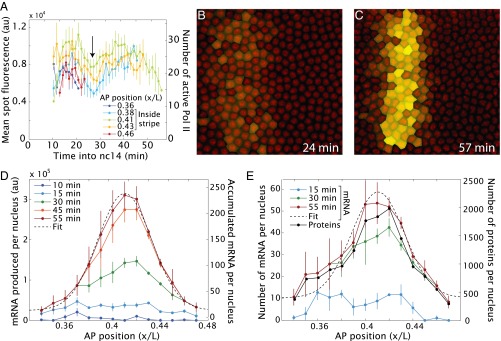
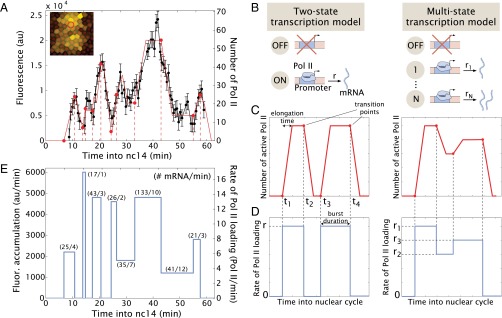
We present the use of recently developed live imaging methods to examine the dynamic regulation of even-skipped (eve) stripe 2 expression in the precellular Drosophila embryo. Nascent transcripts were visualized via MS2 RNA stem loops. The eve stripe 2 transgene exhibits a highly dynamic pattern of de novo transcription, beginning with a broad domain of expression during nuclear cycle 12 (nc12), and progressive refinement during nc13 and nc14. The mature stripe 2 pattern is surprisingly transient, constituting just ∼15 min of the ∼90-min period of expression. Nonetheless, this dynamic transcription profile faithfully predicts the limits of the mature stripe visualized by conventional in situ detection methods. Analysis of individual transcription foci reveals intermittent bursts of de novo transcription, with duration cycles of 4-10 min. We discuss a multistate model of transcription regulation and speculate on its role in the dynamic repression of the eve stripe 2 expression pattern during development.


Conflict of interest statement

The authors declare no conflict of interest.

Figures

Fig. 1.
Fig. 1.
Live imaging of eve stripe 2 transcriptional activity. (A) Schematic representation of eve stripe 2 regulation (data from refs. and 39). The stripe is the result of the combined activation of Bicoid and Hunchback, which define a broad activation domain in the anterior part of the embryo, and repressors Giant and Kruppel, which restrict expression anterior and posterior of this domain, respectively (4). (B) Structure of the reporter construct: the eve stripe 2 DNA region (−1.7 kbp, +50 bp) was placed upstream of 24 repeats of the MS2 stem loops and a yellow reporter gene. The MCP-GFP protein that binds to these stem loops is present in the unfertilized egg and in the early embryo. (C) Confocal image of a transgenic embryo carrying the eve>MS2 transgene labeled via in situ hybridization with full-length probes for the yellow reporter gene (plasmid transgene) and endogenous eve RNAs in the same embryo during nc14. (D) Projected confocal stack of a live Drosophila embryo at six time points (a–f) centered at ∼40% embryo length, expressing the eve>MS2 transgene, histone RFP (red), and MCP-GFP (green). Each image is 77 μm × 77 μm. (a) At metaphase of nc11, no foci of transcription are detectable. (b) Same embryo 10.3 min later than a during nc12 interphase. There are clear fluorescent foci indicating sites of nascent transcript formation. (c) Embryo in nc13 interphase showing broad expression of the transgene. (d) At the onset of nc14, the stripe pattern has started to refine. (e) Refined stripe by late nc14. (f) Embryo just before gastrulation when the transgene expression has diminished significantly.
Fig. 2.
Fig. 2.
Formation and refinement of stripe 2 expression domain. (A–C) Snapshots of a Drosophila embryo expressing the eve>MS2 reporter at different times in nc14 centered at ∼37% embryo length. Nuclei that show foci of active transcription have been false-colored yellow. (D) Instantaneous fraction of active nuclei as a function of position in nc13 and at different times during nc14. The expression domain is defined as the area within the full width at half-maximum of a Gaussian fit to the profile at each time point. (E) Expression domain width and fraction of active nuclei within the domain as a function of time obtained from Gaussian fits as shown in D. After entry into nc14, the width of the domain refines and the fraction of active nuclei within it increases. The mature stripe is stable for 15 min and decays rapidly as gastrulation approaches. The temporal progression of the spatial profile of the fraction of active nuclei is also shown in Movie S5. (All data were obtained by averaging over four embryos; error bars correspond to SEMs.)
Fig. 3.
Fig. 3.
Dynamics of eve stripe 2 mRNA distribution. (A) Mean spot fluorescence, indicating transcriptional activity, as a function of time for different positions along the AP axis of the embryo. The arrow indicates a reduction in the average fluorescence that consistently occurs at about 28 min into nc14 in all embryos observed. (B and C) By integrating the total fluorescence as a function of time and assuming no mRNA degradation, it is possible to predict the amount of accumulated mRNA (SI Text). The intensity of the yellow false-color label is proportional to the amount of mRNA produced in each nucleus. (D) Total amount of mRNA produced per nucleus, assuming no degradation as a function of position along the AP axis at different time points during nc14. The absolute number of mRNA molecules should be seen as an estimate (SI Text). (E) Number of mRNA and protein molecules per nucleus assuming an eve mRNA half-life of 7 min (24), a protein translation rate of one protein per mRNA per min (25) and a protein half-life of 6–40 min (26). The exact half-life of eve mRNA that is used for this model has little influence on the qualitative appearance of the stripe (Fig. S1 and Movie S4). The temporal progression of all parameters is shown in Movie S5. (All data were obtained by averaging over four embryos; error bars correspond to SEMs.)
Fig. 4.
Fig. 4.
Transcriptional bursting in eve stripe 2 activity. (A) Fluorescence intensity of an individual spot within the stripe (black) and manual fits consistent with the simple model put forth in B–D (red); error bars are imaging errors as in Garcia et al. (7). Inset (51 μm × 51 μm) shows the nuclear location corresponding to the spot using false coloring as in Fig. 3C. (B) The widespread two-state model of transcription posits that promoters can be in an OFF or ON state. Transcription factors can then regulate the rates of interconversion between these two states or the rate of transcriptional initiation in the ON state. In a more general multistate model of transcription, the promoter can be found in the OFF state as well as several ON states, each one of which has a characteristic rate of transcription initiation, i.e., polymerase loading rate. (C) The strength of eve>MS2 fluorescent foci are proportionate to the number of elongating Pol II complexes across the gene template. (D) The rate of Pol II loading is related to the spot fluorescence intensity through the time Pol II molecules spend bound to the gene during transcript elongation. Two example time traces of the rate of Pol II loading and their corresponding fluorescence dynamics are shown. In the example for the two-state model, Pol II molecules are loaded onto the gene at a rate r starting at a time t1 after mitosis resulting in a linear increase of fluorescence. Once the first Pol II molecule reaches the end of the gene and falls off [∼4.2 ± 0.4 min; see Garcia et al. (7)], the number of Pol II molecules on the gene will reach steady state, resulting in a constant fluorescence value. At time t2, the promoter is switched OFF and the fluorescence intensity will decline as Pol II molecules terminate transcription. (E) Estimated rate of Pol II loading resulting from the manual fits in A. The estimated number of mRNA molecules produced per state and their duration are shown.

Similar articles

Cited by

References

    1. Levine M. Transcriptional enhancers in animal development and evolution. Curr Biol. 2010;20(17):R754–R763. - PMC - PubMed
    1. Small S, Kraut R, Hoey T, Warrior R, Levine M. Transcriptional regulation of a pair-rule stripe in Drosophila. Genes Dev. 1991;5(5):827–839. - PubMed
    1. Stanojevic D, Small S, Levine M. Regulation of a segmentation stripe by overlapping activators and repressors in the Drosophila embryo. Science. 1991;254(5036):1385–1387. - PubMed
    1. Small S, Blair A, Levine M. Regulation of even-skipped stripe 2 in the Drosophila embryo. EMBO J. 1992;11(11):4047–4057. - PMC - PubMed
    1. Arnosti DN, Barolo S, Levine M, Small S. The eve stripe 2 enhancer employs multiple modes of transcriptional synergy. Development. 1996;122(1):205–214. - PubMed

Publication types

MeSH terms