. 2014 Sep 1;127(Pt 17):3768-81.
doi: 10.1242/jcs.149518. Epub 2014 Jul 2.

An EMMPRIN-γ-catenin-Nm23 complex drives ATP production and actomyosin contractility at endothelial junctions

Affiliations

An EMMPRIN-γ-catenin-Nm23 complex drives ATP production and actomyosin contractility at endothelial junctions

Vanessa Moreno et al. J Cell Sci. .

Abstract

Cell-cell adhesions are important sites through which cells experience and resist forces. In endothelial cells, these forces regulate junction dynamics and determine endothelial barrier strength. We identify the Ig superfamily member EMMPRIN (also known as basigin) as a coordinator of forces at endothelial junctions. EMMPRIN localization at junctions correlates with endothelial junction strength in different mouse vascular beds. Accordingly, EMMPRIN-deficient mice show altered junctions and increased junction permeability. Lack of EMMPRIN alters the localization and function of VE-cadherin (also known as cadherin-5) by decreasing both actomyosin contractility and tugging forces at endothelial cell junctions. EMMPRIN ensures proper actomyosin-driven maturation of competent endothelial junctions by forming a molecular complex with γ-catenin (also known as junction plakoglobin) and Nm23 (also known as NME1), a nucleoside diphosphate kinase, thereby locally providing ATP to fuel the actomyosin machinery. These results provide a novel mechanism for the regulation of actomyosin contractility at endothelial junctions and might have broader implications in biological contexts such as angiogenesis, collective migration and tissue morphogenesis by coupling compartmentalized energy production to junction assembly.

Keywords: ATP; Actomyosin contractility; EMMPRIN; Endothelial junctions; NDPK; Nm23; Nucleoside diphosphate kinase; Vascular integrity; γ-catenin.


Figures

Fig. 1.
Fig. 1.
EMMPRIN-deficient mice show altered endothelial junctions and increased microvascular permeability. (A) Representative images of whole-mount staining in wild-type (EMMP+/+) and EMMPRIN-null (EMMP−/−) mice for the junction marker PECAM-1 (green) in the trachea, ear and aorta. Scale bars: 20 µm. (B) Quantification of the tissue content of Evans Blue in mustard-oil-inflamed and mineral-oil-treated control ears from wild-type and EMMPRIN-deficient mice. AU, arbitrary units. Data show the mean±s.e.m. (four independent experiments; a total of 16 mice per genotype); ***P<0.0001; ns, non-significant (unpaired Student's t-test). (C) Representative merged images of PECAM-1 staining (green) in the microvasculature of control and mustard-oil-inflamed ears of wild-type and EMMPRIN-null mice 30 min after intravenous injection of 4-kDa or 70-kDa dextran–TRITC (red). Numbers in the upper-right corners show quantification of red fluorescence intensity. Scale bars: 20 µm.
Fig. 2.
Fig. 2.
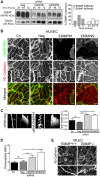
VE-cadherin-containing junctions are impaired in human and mouse EMMPRIN-deficient endothelial cells. (A) Representative western blots of EMMPRIN protein levels in HUVECs transfected with control siRNA (Neg) or EMMPRIN-specific siRNAs (EMMP#1 or EMMP#2) up to 106 h post-transfection (equivalent to 72 h after seeding for monolayer formation). The chart on the right shows the efficiency of EMMPRIN silencing (the percentage of protein expression compared with that of the Neg siRNA sample at each time-point). Tubulin is shown as a loading control. (B) Representative black and white images of immunostaining for VE-cadherin (red in merge) and EMMPRIN (green in merge) in HUVECs transfected with negative-control siRNA or EMMPRIN-specific siRNAs. Control (Cn) indicates non-transfected HUVECs. Insets show magnified views of the boxed areas, with details of the VE-cadherin staining pattern at junctions. Scale bars: 20 µm. (C) Representative image analysis profiles of VE-cadherin staining performed as in B. Data show the mean±s.e.m. of the breadth of VE-cadherin staining at junctions (n = 35 junctions quantified from three independent experiments per condition); ***P<0.0001; ns, non-significant. (D) EMMPRIN knockdown increases endothelial monolayer permeability in vitro. HUVECs transfected as indicated were grown to confluence on transwell filters and dextran–FITC was added to the upper chamber. Data show the mean±s.e.m. of the amount of labeled dextran recovered in the lower chamber after 1 h (n = 3); *P<0.05; ***P<0.001. (E) Representative black and white images of staining for VE-cadherin in MLECs from wild-type and EMMPRIN-null mice. Magnified views of the boxed areas are shown in the lower panel. Scale bars: 20 µm.
Fig. 3.
Fig. 3.
EMMPRIN is required for actin organization at endothelial junctions. (A) Representative black and white images of staining for EMMPRIN (green in merge), F-actin (phalloidin; red in merge) and VE-cadherin (blue in merge) in HUVECs at 1 h and 48 h after seeding. Magnified views of the boxed areas (right) show colocalization of EMMPRIN with F-actin at early and mature endothelial cell–cell contacts. Scale bars: 20 µm. (B) Representative black and white images of staining for EMMPRIN (green in merge) and F-actin (red in merge) in control and EMMPRIN-knockdown HUVECs at 1 h after seeding. The boxed areas are shown in the magnified views; note the presence of a complex network of F-actin in control cells in contrast to the F-actin filaments in EMMPRIN-knockdown cells, which are perpendicular to the junction (particularly in the lower-right cell). Neg, cells transfected with control siRNA. Scale bars: 10 µm. (C) EMMPRIN-knockdown HUVECs were transfected with LifeAct (red) and stained with directly labeled anti-EMMPRIN mAb (green). Starting at 6 h after seeding, time-lapse images were recorded over 18 h. Selected images at the indicated time-points are shown with identifying cell numbers, and junctions are shown as dotted lines in white (for non-knockdown cells) or yellow (for EMMPRIN-knockdown cells). Scale bars: 5 µm.
Fig. 4.
Fig. 4.
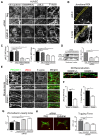
EMMPRIN regulates actomyosin contractility and tugging forces at endothelial junctions. (A) Representative black and white images of VE-cadherin, EMMPRIN, pMLC and F-actin staining in control (Neg) and EMMPRIN-knockdown (EMMP#1) HUVECs. Boxed regions are shown in the magnified views below the images. Scale bars: 20 µm. (B) Junctional ROIs (outlined in yellow) were drawn as an area with a maximum width of 1.5–2 µm surrounding the junction (identified by VE-cadherin staining). Scale bars: 20 µm. (C) Quantification of mean fluorescence intensity (MFI) for pMLC and F-actin at junctions of control and EMMPRIN-knockdown HUVECs. Cn, non-transfected control. Data show the mean±s.e.m. (n = 30–40 junctions quantified in two or three independent experiments per condition); **P<0.01; ***P<0.001; ns, non-significant. (D) Left, representative western blot of pMLC and MLC protein levels in membrane-enriched fractions isolated from control-siRNA-transfected and EMMPRIN-knockdown human endothelial cells. Right, graph shows the fold induction (FI, mean±s.e.m.) of pMLC∶MLC ratios in EMMPRIN-knockdown versus control cells (n = 3 independent experiments); **P<0.01. (E) Similar images and image analysis to that shown in A, performed in aortas of wild-type and EMMPRIN-null mice, showing junction staining with antibodies against PECAM-1 (green in merge) and pMLC (red in merge), and F-actin (white in merge) staining (left). Scale bars: 20 µm. Right, three-dimensional reconstruction from images of endothelial junctions from wild-type or EMMPRIN-deficient aortas was performed with Imaris software. Volumes were partially transparent to allow visualization of all the components of the junction. (F) Quantification of mean fluorescence intensity for pMLC and F-actin (phalloidin) at junctions of wild-type and EMMPRIN-deficient aortas. Data show the mean±s.e.m. (n = 30–40 junctions were quantified from two or three independent experiments per condition); *P<0.05; ***P<0.001. (G) Linearity index was quantified with ImageJ software as the ratio of the length of VE-cadherin junction staining and the distance between junction vertices in non-transfected, control-siRNA-transfected and EMMPRIN-knockdown human endothelial cells. Data show the mean±s.e.m. (n = 40–50 junctions per condition in three independent experiments); ***P<0.0001. (H) Tugging forces were quantified in EMMPRIN-siRNA-transfected HUVECs plated on elastomer plates coated with fibronectin (red) and immunostained for EMMPRIN (green). Representative images with the force vectors (yellow arrows) are shown on the left (vector scale bars: 50 nN). The graph showing the average of tugging forces for each condition is shown on the right. Data show the mean±s.e.m.; n = 14, 8, 14 for negative siRNA, siRNA#1 and siRNA#2, respectively.
Fig. 5.
Fig. 5.
EMMPRIN interacts with γ-catenin at endothelial cell junctions. (A) Left, representative western blot (IB) analysis for γ-catenin and VE-cadherin in EMMPRIN immunoprecipitates (IP) from HUVECs. Right, representative black and white images of immunofluorescence staining for EMMPRIN (red in merge) and γ-catenin (green in merge) in VE-cadherin-null mouse endothelial cells; insets show details of the staining pattern at junctions from the boxed areas. Scale bar: 10 µm. (B) Representative confocal fluorescence images of EMMPRIN (green in merge), F-actin (phalloidin; red in merge) and γ-catenin (blue in merge) in HUVECs, showing colocalization of EMMPRIN and γ-catenin at 48 h after seeding. Scale bar: 10 µm. (C) Representative black and white confocal immunofluorescence images of staining for EMMPRIN (green in merge) and γ-catenin (red in merge) in control-siRNA-transfected (Neg) and EMMPRIN-knockdown (EMMP#1) HUVECs at 48 h after seeding. Scale bars: 10 µm. (D) Left, representative western blot of γ-catenin protein levels in RIPA lysates from control-siRNA-transfected and EMMPRIN-knockdown cells; right, graph shows the fold induction (FI) of γ-catenin in EMMPRIN-knockdown versus control cells. Data show the mean±s.e.m. (three independent experiments); ns, non-significant. (E) Representative images showing whole-mount staining of PECAM-1 (green) and γ-catenin (red) in the ears of wild-type and EMMPRIN-null mice. Scale bars: 20 µm. (F) Representative black and white images of staining for γ-catenin (blue in merge), pMLC (green in merge) and F-actin (phalloidin; red in merge) in non-transfected control (Cn), control-siRNA-transfected and γ-catenin-knockdown HUVECs. Scale bars: 20 µm. (G) Quantification of mean fluorescence intensities (MFI) for pMLC and F-actin at junctions of control versus γ-catenin-knockdown HUVECs. Data show the mean±s.e.m. (n = 30–40 junctions were quantified in two or three independent experiments per condition); *P<0.05; **P<0.01.
Fig. 6.
Fig. 6.
Nm23 is associated with the EMMPRIN–γ-catenin complex at endothelial junctions. (A) Representative western blot analysis for Nm23 in EMMPRIN immunoprecipitates (IP) from HUVECs. (B) Upper panels, representative black and white confocal fluorescence images of staining for EMMPRIN (blue in merge), γ-catenin (red in merge) and Nm23 (green in merge) in HUVECs at 48 h after seeding. Magnified views of the boxed areas are shown below the main images. Lower panels, representative brightfield and merged images of DAPI (blue) and proximity ligation assay (PLA, green) for EMMPRIN and γ-catenin (left) and for γ-catenin and Nm23 (right) in HUVECs fixed with methanol. Scale bars: 20 µm. (C) Upper panels, representative black and white confocal fluorescence images of EMMPRIN (red in merge) and Nm23 (green in merge) in non-transfected control (Cn), control-siRNA-transfected (Neg) and EMMPRIN-knockdown HUVECs at 48 h after seeding. Lower panel, quantification of mean fluorescence intensity (MFI) for Nm23 at the junctions of control and EMMPRIN-knockdown HUVECs. Data show the mean±s.e.m. (30–40 junctions were quantified in three independent experiments per condition); ***P<0.001; ns, non-significant. (D) Upper panel, representative black and white confocal images of the staining of γ-catenin (red in merge) and Nm23 (green in merge) in control and γ-catenin-knockdown HUVECs. Lower panel, quantification of mean fluorescence intensity for Nm23 at the junctions of control and γ-catenin-knockdown HUVECs. Data show the mean±s.e.m. (n = 30–40 junctions were quantified in two independent experiments per condition); **P<0.01. Scale bars: 20 µm.
Fig. 7.
Fig. 7.
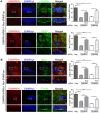
The EMMPRIN cytosolic tail mediates γ-catenin and Nm23 recruitment and actomyosin contractility at endothelial junctions. Representative images are shown of EMMPRIN (red), γ-catenin (green) or Nm23 (green) (A) and of EMMPRIN (red), pMLC (green) or F-actin (phalloidin; green) (B) in EMMPRIN-knockdown HUVECs (EMMP#1 and EMMP#2) transfected with a GFP-tagged myristoylated EMMPRIN cytosolic tail construct (EMMPcyt; blue). Boxed areas are shown at a higher magnification below the main images. Graphs on the right show the quantification of mean fluorescence intensity (MFI) for γ-catenin and Nm23 (A) or pMLC and F-actin (B) at the junctions of cells transfected with siRNA against EMMPRIN, either with or without the GFP–myr-EMMPRIN cytosolic tail. Neg, control-siRNA-transfected cells. Data show the mean±s.e.m. (30–50 junctions were analyzed in two independent experiments per group); *P<0.05; **P<0.01; ***P<0.001. Scale bars: 20 µm.
Fig. 8.
Fig. 8.
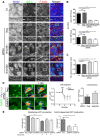
The presence of Nm23 at endothelial junctions is required for MLC phosphorylation and ATP production at these sites. (A) Representative black and white images of staining for Nm23 (blue in merge), pMLC (green in merge) and F-actin (phalloidin; red in merge) and the merged images are shown in non-transfected control (Cn), control-siRNA-transfected (Neg) and Nm23-knockdown (Nm23#1 and Nm23#2) HUVECs. Boxed regions are shown in the magnified views below the images; dotted lines mark the junction in Nm23-knockdown cells. Scale bars: 20 µm. (B) Quantification of mean fluorescence intensities (MFI) for pMLC and F-actin at junctions of control versus Nm23-knockdown HUVECs. Data show the mean±s.e.m. (n = 15 junctions were quantified in two independent experiments per condition); ***P<0.001; ns, non-significant. (C) Quantification of VE-cadherin linearity index in control versus Nm23-knockdown HUVECs. Data show the mean±s.e.m. (n = 20–30 junctions were quantified per condition in two independent experiments); ***P<0.0001. (D) Left, representative images of human endothelial cells stained for EMMPRIN and visualized for Perceval fluorescent signal (ATP∶ADP ratio shown in pseudo-color scale) in the absence or presence of metabolic inhibitors (Inh) in control-siRNA-transfected and EMMPRIN-knockdown (EMMP#1) endothelial cells. Scale bars: 20 µm. Middle, ATP∶ADP ratios quantified in the cell periphery (junctional area) are plotted for the time scale over which pH was stable (around 3 min before and after the addition of inhibitors). Data show the mean±s.e.m. Right, graph shows the relative drop in the ATP∶ADP ratio after inhibitor treatment, normalizing basal levels to 1. Data show the mean±s.e.m. (n = 6 cells analyzed for each condition). (E) ATP production in cell membranes from control and EMMPRIN-knockdown HUVECs (n = 3). Graphs show ATP generated by enzymatic reaction after the addition of reaction buffer in the absence or presence of the inhibitory antibody (Ab) anti-Nm23; Nm23-dependent ATP production was calculated from the difference in ATP levels produced in the presence or absence of the antibody. Data show the mean±s.e.m.; *P<0.05, **P<0.01.

References

    1. Abraham S., Yeo M., Montero-Balaguer M., Paterson H., Dejana E., Marshall C. J., Mavria G. (2009). VE-Cadherin-mediated cell-cell interaction suppresses sprouting via signaling to MLC2 phosphorylation. Curr. Biol. 19, 668–674 10.1016/j.cub.2009.02.057 - DOI - PubMed
    1. Aguado-Velasco C., Véron M., Rambow J. A., Kuczmarski E. R. (1996). NDP kinase can modulate contraction of Dictyostelium cytoskeletons. Cell Motil. Cytoskeleton 34, 194–205 10.1002/(SICI)1097-0169(1996)34:3<194::AID-CM3>3.0.CO;2-A - DOI - PubMed
    1. Aktary Z., Chapman K., Lam L., Lo A., Ji C., Graham K., Cook L., Li L., Mackey J. R., Pasdar M. (2010). Plakoglobin interacts with and increases the protein levels of metastasis suppressor Nm23-H2 and regulates the expression of Nm23-H1. Oncogene 29, 2118–2129 10.1038/onc.2009.495 - DOI - PubMed
    1. Ando K., Fukuhara S., Moriya T., Obara Y., Nakahata N., Mochizuki N. (2013). Rap1 potentiates endothelial cell junctions by spatially controlling myosin II activity and actin organization. J. Cell Biol. 202, 901–916 10.1083/jcb.201301115 - DOI - PMC - PubMed
    1. Aprodu I., Redaelli A., Soncini M. (2008). Actomyosin interaction: mechanical and energetic properties in different nucleotide binding states. Int. J. Mol. Sci. 9, 1927–1943 10.3390/ijms9101927 - DOI - PMC - PubMed

Publication types

MeSH terms