. 2014 Jun 19:5:269.
doi: 10.3389/fimmu.2014.00269. eCollection 2014.

Induction of Split Anergy Conditions Natural Killer Cells to Promote Differentiation of Stem Cells through Cell-Cell Contact and Secreted Factors

Affiliations

Induction of Split Anergy Conditions Natural Killer Cells to Promote Differentiation of Stem Cells through Cell-Cell Contact and Secreted Factors

Han-Ching Tseng et al. Front Immunol. .

Abstract

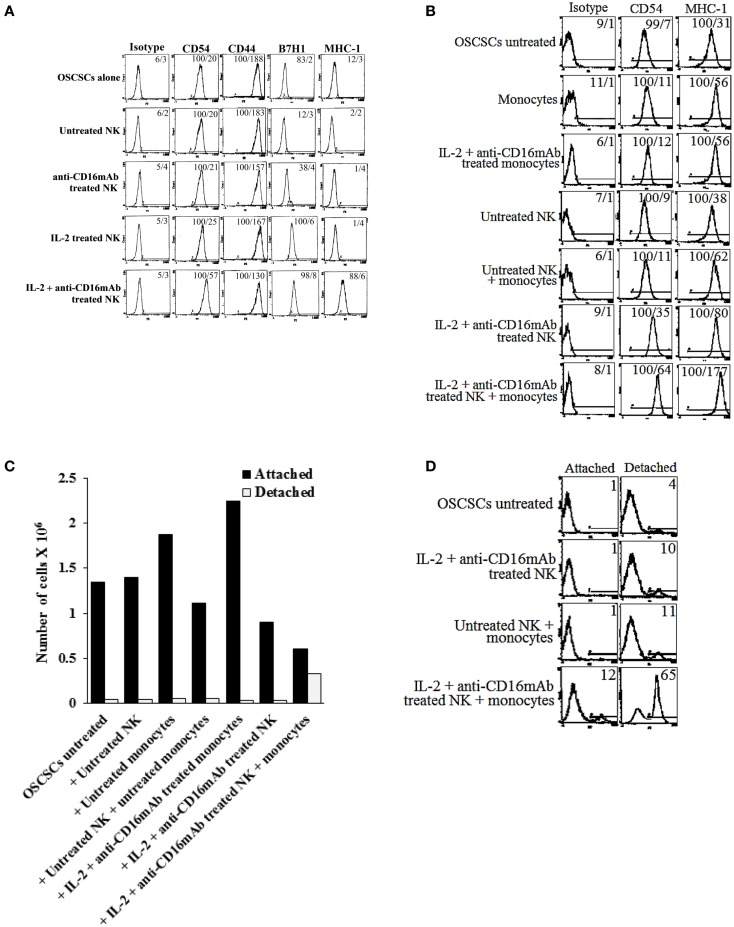
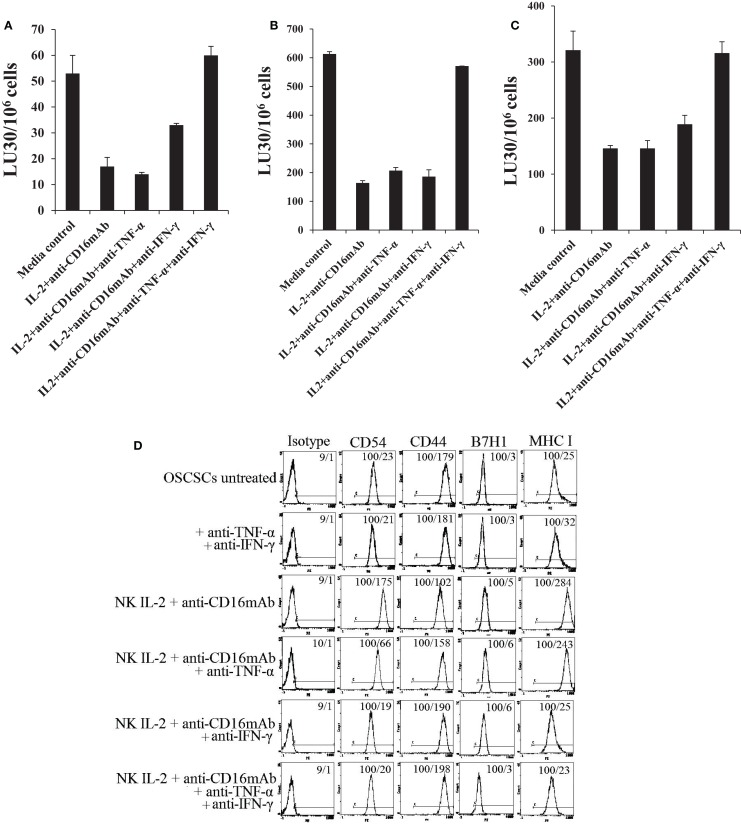
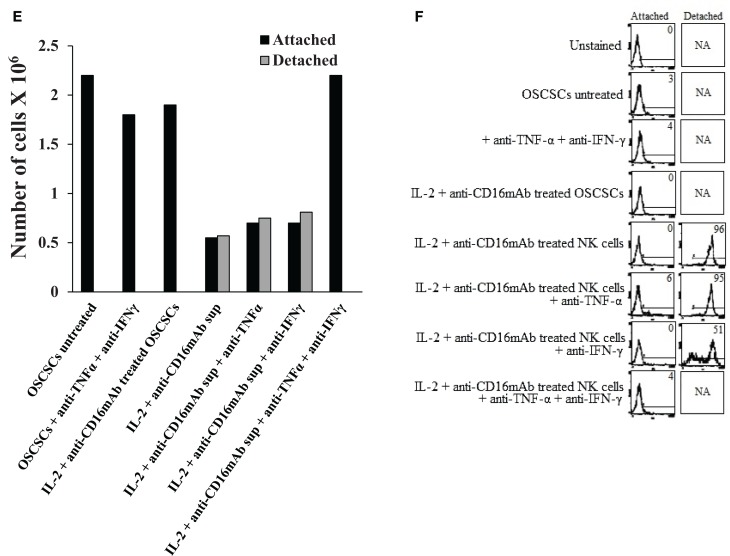
In this paper, we provide evidence that anergized NK cells through secreted factors and direct cell-cell contact have the ability to induce differentiation of healthy dental pulp stem cells and stem cell of apical papillae as well as transformed oral squamous cancer stem cell (OSCSC) and Mia-Paca-2, poorly differentiated stem-like pancreatic tumors, resulting in their resistance to NK cell-mediated cytotoxicity. Induction of NK cell resistance and differentiation in the stem cells correlated with the increased expression of CD54, B7H1, and MHC class I, and mediated by the combination of membrane-bound or secreted IFN-γ and TNF-α from the NK cells since antibodies to both cytokines and not each one alone were able to inhibit differentiation or resistance to NK cells. Similarly, antibodies to both TNF-α and IFN-γ were required to prevent NK-mediated inhibition of cell growth, and restored the numbers of the stem cells to the levels obtained when stem cells were cultured in the absence of anergized NK cells. Interestingly, the effect of anti-IFN-γ antibody in the absence of anti-TNF-α antibody was more dominant for the prevention of increase in surface receptor expression since its addition abrogated the increase in CD54, B7H1, and MHC class I surface expression. Antibodies to CD54 or LFA-1 was unable to inhibit differentiation whereas antibodies to MHC class I but not B7H1 increased cytotoxicity of well-differentiated oral squamous carcinoma cells as well as OSCSCs differentiated by the IL-2 + anti-CD16 mAb-treated NK cells whereas it inhibited the cytotoxicity of NK cells against OSCSCs. Thus, NK cells may inhibit the progression of cancer by killing and/or differentiation of cancer stem cells, which severely halt cancer growth, invasion, and metastasis.

Keywords: IFN-γ; MP2; NK; OSCCs; OSCSCs; cytotoxicity; regulatory NK.


Figures

Figure 1
Figure 1
Resistance of differentiated DPSCs and OSCCs but not stem-like OSCSCs or DPSCs to untreated, IL-2-treated, and IL-2 + anti-CD16-treated NK cell cytotoxicity; loss of NK cell cytotoxicity and gain in secretion of IFN-γ after NK cell receptor signaling. OSCCs or OSCSCs were seeded at 1 × 105 cells/well in 24-well plate for 24 h prior to the addition of highly purified NK cells pre-treated with IL-2 (1000 units/ml) for 24 h. NK cells were added to tumor cells at 2:1 effector to target ratio. At time 0 when NK cells were added to the tumor culture, a final concentration of 10 μg/ml of propidium iodide (PI) was also added. The cells were then subsequently tracked for over 72 h using time-lapse microscopy with Nikon Eclipse Ti-E inverted microscope fitted with a culture chamber to provide cells with a stable temperature of 37°C with 5% CO2. An image was taken every 15 min and a representation is shown at day 1, day 1½, and day 3. OSCSCs but not OSCCs which are lysed take up PI and appear orange in the time-lapse (A). The surface expression of CD26, CD44, CD166, and CD326 on OSCCs and OSCSCs were assessed with flow cytometric analysis after staining with the respective PE-conjugated antibodies. Isotype control antibodies were used as control. The numbers on the right hand corner are the percentages and the mean channel fluorescence intensities for each histogram (B). The surface expression of CD338 on OSCCs and OSCSCs was assessed by flow cytometric analysis after staining with PE-conjugated CD338 (right graphs in the histogram). Isotype control antibodies were used as control (left graphs in the histograms) (C). OSCCs and OSCSCs were left untreated or treated with 10–80 μg/ml of cisplatin for 18 h, after which the tumor cells were washed with 1× PBS, detached, and stained with propidium iodide (PI) and percent cell death was determined using flow cytometric analysis (D). NK cells were left untreated or treated with IL-2 (1000 units/ml), anti-CD16 mAb (3 μg/ml), or a combination of IL-2 (1000 units/ml) and anti-CD16 mAb (3 μg/ml) for 18 h before they were added to 51Cr-labeled OSCSCs and OSCCs (E) or undifferentiated and differentiated DPSCs (G). NK cell-mediated cytotoxicity was determined using a standard 4 h 51Cr release assay and the lytic units 30/106 cells were determined using inverse number of NK cells required to lyse 30% of the target cells × 100. NK cells were treated as described in (E) and each NK sample was either cultured in the absence or presence of OSCSCs and OSCCs (F) or undifferentiated and differentiated DPSCs (H) at an NK cell to target cell ratio of 0.5:1. After an overnight incubation, the supernatant was removed from the co-cultures and the levels of IFN-γ secretion were determined using specific ELISAs. One of minimum three representative experiments is shown in each of (B–H).
Figure 1
Figure 1
Resistance of differentiated DPSCs and OSCCs but not stem-like OSCSCs or DPSCs to untreated, IL-2-treated, and IL-2 + anti-CD16-treated NK cell cytotoxicity; loss of NK cell cytotoxicity and gain in secretion of IFN-γ after NK cell receptor signaling. OSCCs or OSCSCs were seeded at 1 × 105 cells/well in 24-well plate for 24 h prior to the addition of highly purified NK cells pre-treated with IL-2 (1000 units/ml) for 24 h. NK cells were added to tumor cells at 2:1 effector to target ratio. At time 0 when NK cells were added to the tumor culture, a final concentration of 10 μg/ml of propidium iodide (PI) was also added. The cells were then subsequently tracked for over 72 h using time-lapse microscopy with Nikon Eclipse Ti-E inverted microscope fitted with a culture chamber to provide cells with a stable temperature of 37°C with 5% CO2. An image was taken every 15 min and a representation is shown at day 1, day 1½, and day 3. OSCSCs but not OSCCs which are lysed take up PI and appear orange in the time-lapse (A). The surface expression of CD26, CD44, CD166, and CD326 on OSCCs and OSCSCs were assessed with flow cytometric analysis after staining with the respective PE-conjugated antibodies. Isotype control antibodies were used as control. The numbers on the right hand corner are the percentages and the mean channel fluorescence intensities for each histogram (B). The surface expression of CD338 on OSCCs and OSCSCs was assessed by flow cytometric analysis after staining with PE-conjugated CD338 (right graphs in the histogram). Isotype control antibodies were used as control (left graphs in the histograms) (C). OSCCs and OSCSCs were left untreated or treated with 10–80 μg/ml of cisplatin for 18 h, after which the tumor cells were washed with 1× PBS, detached, and stained with propidium iodide (PI) and percent cell death was determined using flow cytometric analysis (D). NK cells were left untreated or treated with IL-2 (1000 units/ml), anti-CD16 mAb (3 μg/ml), or a combination of IL-2 (1000 units/ml) and anti-CD16 mAb (3 μg/ml) for 18 h before they were added to 51Cr-labeled OSCSCs and OSCCs (E) or undifferentiated and differentiated DPSCs (G). NK cell-mediated cytotoxicity was determined using a standard 4 h 51Cr release assay and the lytic units 30/106 cells were determined using inverse number of NK cells required to lyse 30% of the target cells × 100. NK cells were treated as described in (E) and each NK sample was either cultured in the absence or presence of OSCSCs and OSCCs (F) or undifferentiated and differentiated DPSCs (H) at an NK cell to target cell ratio of 0.5:1. After an overnight incubation, the supernatant was removed from the co-cultures and the levels of IFN-γ secretion were determined using specific ELISAs. One of minimum three representative experiments is shown in each of (B–H).
Figure 2
Figure 2
Monocytes induce split anergy in NK cells resulting in a significant loss of NK cell cytotoxicity against OSCSCs and DPSCs and increased secretion of IFN-γ by the NK cells. NK cells were purified from healthy donors and left untreated or treated with IL-2 (1000 units/ml), anti-CD16 mAb (3 μg/ml), or the combination of IL-2 (1000 units/ml) and anti-CD16 mAb (3 μg/ml) in the presence or absence of autologous monocytes (1:1 ratio of NK:monocytes) for 24 h, after which they were washed and added to 51Cr-labeled OSCSCs in a 4-h chromium release assay. Percent cytotoxicity was obtained at different effector to target ratio, and the lytic units 30/106 cells were determined using inverse number of NK cells required to lyse 30% of the tumor cells × 100 (A). NK cells were treated as described in Figure 2A and either cultured in the absence or presence of OSCSCs. After an overnight incubation, supernatants were removed from co-cultures and the levels of IFN-γ secretion were determined using specific ELISAs (B). Highly purified NK cells were left untreated or treated as described in Figure 2A. After 1, 4, 6, and 8 days post-treatment, supernatants were removed from NK cell cultures and the levels of IFN-γ (C) release were determined using specific ELISAs. NK cells were purified from healthy donors and left untreated or treated with IL-2 (1000 units/ml), anti-CD16 mAb (3 μg/ml), or the combination of IL-2 (1000 units/ml) and anti-CD16 mAb (3 μg/ml) in the presence or absence of autologous and allogeneic monocytes (1:1 ratio of NK:monocytes) for 24 h, after which they were washed and added to 51Cr-labeled autologous and allogeneic DPSCs in a 4-h chromium release assay (D). Percent cytotoxicity was obtained at different effector to target ratio, and the lytic units 30/106 cells were determined using inverse number of NK cells required to lyse 30% of the tumor cells × 100. NK cells were treated as described in Figure 2D and either cultured in the absence or presence of autologous and allogeneic DPSCs (NK:DPSC of 0.2:1). After an overnight incubation, supernatants were removed from the co-cultures and the levels of IFN-γ secretion were determined using specific ELISAs (E). One of minimum three representative experiments is shown in each of (A–E).
Figure 3
Figure 3
Supernatants and paraformaldehyde-fixed NK cells treated with IL-2 in combination with anti-CD16 mAb with and without monocytes increased resistance of OSCSCs and DPSCs to NK cell-mediated cytotoxicity. NK cells were purified from healthy donors and left untreated or treated with IL-2 (1000 units/ml), anti-CD16 mAb (3 μg/ml), or the combination of IL-2 (1000 units/ml) and anti-CD16 mAb (3 μg/ml) in the presence or absence of autologous monocytes (1:1 ratio of NK:monocytes) for 24 h, after which the same amounts of supernatants from different treatments of NK cells were removed and added to OSCSCs for a period of 5 days (A) or DPSCs for a period of 7 days (B). NK supernatant-treated OSCSCs or DPSCs were then washed with 1× PBS, detached and labeled with 51Cr, and used in the cytotoxicity assay against freshly isolated NK cells. Untreated or IL-2-treated (1000 units/ml) NK cells were used to assess cytotoxicity against NK supernatant-treated target cells using a standard 4 h 51Cr release assay. Percent cytotoxicity was determined at different effector to target ratio, and the lytic units 30/106 cells were determined using inverse number of NK cells required to lyse 30% of the tumor cells × 100. NK cells were purified from healthy donors and left untreated or treated with IL-2 (1000 units/ml), anti-CD16 mAb (3 μg/ml), or the combination of IL-2 (1000 units/ml) and anti-CD16 mAb (3 μg/ml) in the presence or absence of monocytes (1:1 ratio of NK:monocytes) for 24 h. Treated NK samples were then washed and fixed with 2% paraformaldehyde for 15 min before they were either added to OSCSCs at 0.75:1 for 5 days (C) or DPSCs at 2:1 for 7 days (D). The fixed NK cells were then completely removed from OSCSCs and DPSCs and the target cell sensitivity to NK cell-mediated lysis were determined using a standard 4 h 51Cr release assay using freshly isolated and untreated or IL-2-treated (1000 units/ml) NK cells. Removal of fixed NK cells from stem cell cultures were assessed using microscopic observation. Percent cytotoxicity was determined at different effector to target ratio, and the lytic units 30/106 cells were determined using inverse number of NK cells required to lyse 30% of the tumor cells × 100. One of minimum three representative experiments is shown in each of (A–D).
Figure 4
Figure 4
Induction of resistance to NK cell-mediated cytotoxicity and inhibition of growth in OSCSCs correlated with the increased expression of CD54, B7H1, MHC class I, and decreased expression of CD44 on OSCSCs treated with supernatants from IL-2 + anti-CD16 mAb-treated NK cells with and without monocytes. NK cells were purified from healthy donors and left untreated or treated with IL-2 (1000 units/ml), anti-CD16 mAb (3 μg/ml), or the combination of IL-2 (1000 units/ml) and anti-CD16 mAb (3 μg/ml) for 24 h. Thereafter, the same amounts of supernatants from different treatments of NK cells were removed and added to OSCSCs for 5 days. OSCSCs were then washed, and the expression of CD54, CD44, B7H1, and MHC class I were assessed after staining with the PE-conjugated antibodies using flow cytometry (A). NK cells were purified from healthy donors and left untreated or treated with IL-2 (1000 units/ml), anti-CD16 mAb (3 μg/ml), or the combination of IL-2 (1000 units/ml) and anti-CD16 mAb (3 μg/ml) in the presence or absence of autologous monocytes (1:1 ratio of NK:monocytes) for 24 h. Thereafter, the same amounts of supernatants from different treatments of NK cells were removed and added to OSCSCs. After 5 days of incubation with the NK cell supernatants, OSCSCs were washed with 1× PBS, and the expression of CD54 and MHC-1 were assessed after staining with the PE-conjugated antibodies using flow cytometry (B). Isotype control antibodies were used as controls. The numbers on the right hand corner are the percentages and the mean channel fluorescence intensities for each histogram. At the end of the incubation of OSCSCs with NK cell supernatants, OSCSCs which were remained attached to the plate and those which detached during the incubation period were collected separately, and the number of cells (C) and their viability (D) were assessed using microscopy and propidium iodide staining followed by flow cytometric analysis, respectively. One of minimum three representative experiments is shown in each of (A–D).
Figure 5
Figure 5
Induction of resistance of OSCSCs to NK cell-mediated cytotoxicity and inhibition of growth in OSCSCs by IL-2 + anti-CD16 mAb-treated NK cells is mediated by the combination of IFN-γ and TNF-α and not each cytokine alone. Highly purified NK cells were treated with the combination of IL-2 (1000 units/ml) and anti-CD16 mAb (3 μg/ml) for 24 h, after which supernatant was removed and added to OSCSCs in the presence and absence of anti-TNF-α (1:100) and/or anti-IFN-γ (1:100) or isotype control antibodies for a period of 5 days. The cytotoxicity against untreated and NK supernatant-treated OSCSCs in the presence of antibodies to untreated NK cells (A), IL-2-treated NK cells (B), or IL-2 and anti-CD16 mAb-treated NK cells (C) were assessed using a standard 4 h 51Cr release assay. Percent cytotoxicity was obtained at different effector to target ratio, and the lytic units 30/106 cells were determined using inverse number of NK cells required to lyse 30% of the tumor cells × 100. The surface expression of CD54, CD44, B7H1, and MHC class I on untreated, anti-TNF-α (1:100) and anti-IFN-γ (1:100) in the absence of NK supernatant, IL-2 + anti-CD16 mAb treated NK supernatants in the presence and absence of anti-TNF-α and/or anti-IFN-γ as shown in the figure were assessed were assessed after PE-conjugated antibody staining using flow cytometric analysis. Isotype control antibodies were used as controls. The numbers on the right hand corner are the percentages and the mean channel fluorescence intensities in each histogram (D). At the end of the incubation of OSCSCs with NK cell supernatants, OSCSCs which were remained attached to the plate and those which detached during the incubation period were collected separately, and the number of cells (E) and their viability (F) were assessed using microscopy, and propidium iodide staining followed by flow cytometric analysis, respectively. One of minimum three representative experiments is shown in each of (A–F).
Figure 5
Figure 5
Induction of resistance of OSCSCs to NK cell-mediated cytotoxicity and inhibition of growth in OSCSCs by IL-2 + anti-CD16 mAb-treated NK cells is mediated by the combination of IFN-γ and TNF-α and not each cytokine alone. Highly purified NK cells were treated with the combination of IL-2 (1000 units/ml) and anti-CD16 mAb (3 μg/ml) for 24 h, after which supernatant was removed and added to OSCSCs in the presence and absence of anti-TNF-α (1:100) and/or anti-IFN-γ (1:100) or isotype control antibodies for a period of 5 days. The cytotoxicity against untreated and NK supernatant-treated OSCSCs in the presence of antibodies to untreated NK cells (A), IL-2-treated NK cells (B), or IL-2 and anti-CD16 mAb-treated NK cells (C) were assessed using a standard 4 h 51Cr release assay. Percent cytotoxicity was obtained at different effector to target ratio, and the lytic units 30/106 cells were determined using inverse number of NK cells required to lyse 30% of the tumor cells × 100. The surface expression of CD54, CD44, B7H1, and MHC class I on untreated, anti-TNF-α (1:100) and anti-IFN-γ (1:100) in the absence of NK supernatant, IL-2 + anti-CD16 mAb treated NK supernatants in the presence and absence of anti-TNF-α and/or anti-IFN-γ as shown in the figure were assessed were assessed after PE-conjugated antibody staining using flow cytometric analysis. Isotype control antibodies were used as controls. The numbers on the right hand corner are the percentages and the mean channel fluorescence intensities in each histogram (D). At the end of the incubation of OSCSCs with NK cell supernatants, OSCSCs which were remained attached to the plate and those which detached during the incubation period were collected separately, and the number of cells (E) and their viability (F) were assessed using microscopy, and propidium iodide staining followed by flow cytometric analysis, respectively. One of minimum three representative experiments is shown in each of (A–F).
Figure 6
Figure 6
Induction of differentiation, inhibition of cell growth, and resistance to NK cell-mediated cytotoxicity in OSCSCs induced by IL-2 + anti-CD16 mAb-treated and paraformaldehyde-fixed NK cells is mediated by the combination of IFN-γ and TNF-α and not each cytokine alone. Highly purified NK cells were left untreated or treated with the combination of IL-2 (1000 units/ml) and anti-CD16 mAb (3 μg/ml) for 24 h, after which the NK cells were fixed with 2% paraformaldehyde and added to OSCSCs (0.75:1 NK:OSCSC ratio) in the presence and absence of anti-TNF-α (1:100) and/or anti-IFN-γ (1:100) or isotype control antibodies for a period of 5 days. The media containing the fixed NK cells were removed and extensively washed from each treated OSCSCs and the cytotoxicity against OSCSCs were assessed using freshly isolated untreated NK cells or those treated with IL-2 using a standard 4 h 51Cr release assay. The complete removal of fixed NK cells from OSCSCs was determined by microscopy. Percent cytotoxicity was obtained at different effector to target ratio, and the lytic units 30/106 cells were determined using inverse number of NK cells required to lyse 30% of the tumor cells × 100 (A). The lack of cytotoxic function of 2% paraformaldehyde-fixed untreated and IL-2-treated NK cells were assessed against OSCSCs and OSCCs. NK cells were left untreated or treated with IL-2 for 24 h before they were fixed with 2% paraformaldehyde (B). NK cells were purified from healthy donor and left untreated or treated with IL-2 (1000 units/ml) and the combination of IL-2 (1000 units/ml) and anti-CD16 mAb (3 μg/ml). After an overnight treatment, NK cells were fixed with freshly prepared 2% paraformaldehyde and washed twice with 1× PBS. After 24 h post fixation, supernatants were then collected and the levels of IFN-γ were measured with specific ELISA (C). NK cells purified from healthy donors were left untreated or treated with a combination of IL-2 (1000 units/ml) and anti-CD16 mAb (3 μg/ml) for 24 h, after which the NK cells were washed extensively and stained with PE-conjugated anti-TNF-α mAb followed by flow cytometric analysis. IFN-γ expression was assessed using purified mouse anti-human IFN-γ antibody followed by PE-conjugated goat anti-mouse IgG. Isotype control antibodies were used as controls. The numbers on the right hand corner are percentage positive for each histogram. The histogram overlay for the anti-TNF-α or anti-IFN-γ stained untreated (left) and IL-2 + anti-CD16 mAb-treated NK cells (right) are also shown in this figure. (D) The surface expression of CD54, CD44, B7H1, and MHC class I on untreated and fixed NK-treated OSCSCs as described above were assessed after PE-conjugated antibody staining followed by flow cytometric analysis. Isotype control antibodies were used as controls. The numbers on the right hand corner are the percentages and the mean channel fluorescence intensities for each histogram (E). At the end of the incubation of OSCSCs with fixed NK cells, OSCSCs which were remained attached to the plate were collected, and the number of cells (F) and their viability (G) were assessed using microscopy, and propidium iodide staining followed by flow cytometric analysis, respectively. Highly purified NK cells were left untreated or treated with the combination of IL-2 (1000 units/ml) and anti-CD16 mAb (3 μg/ml) in the presence and absence of monensin (1:1300) for 24 h, after which each sample of NK cells were extensively washed and fixed with 2% paraformaldehyde and added to OSCSCs (0.75:1 NK:OSCSC) for a period of 5 days. Inhibition of IFN-γ release in monensin-treated NK cells before fixation with 2% paraformaldehyde were assessed by ELISA (H). The results were compared to OSCSCs in the absence of fixed NK cells. The media containing the fixed NK cells were removed and extensively washed from each treated OSCSCs and the cytotoxicity against each condition of OSCSCs were assessed using freshly isolated untreated NK cells (I), those treated with IL-2 (J) or treated with the combination of IL-2 + anti-CD16 mAb (K) using a standard 4 h 51Cr release assay. The complete removal of fixed NK cells from OSCSCs was determined by microscopy. Differentiated OSCCs were used as control for the differentiation of OSCSCs. Percent cytotoxicity was obtained at different effector to target ratio, and the lytic units 30/106 cells were determined using inverse number of NK cells required to lyse 30% of the tumor cells × 100. The surface expression of CD54, CD44, and MHC class I on untreated and fixed NK-treated OSCSCs as described above were assessed after PE-conjugated antibody staining followed by flow cytometric analysis. Isotype control antibodies were used as controls. The numbers on the right hand corner are the percentages and the mean channel fluorescence intensities for each histogram (L). At the end of the incubation of OSCSCs with fixed NK cells, the media containing the fixed NK samples were removed from OSCSCs and the viability of the cells were assessed using propidium iodide staining followed by flow cytometric analysis (M). One of minimum three representative experiments is shown in each of (A–M).
Figure 6
Figure 6
Induction of differentiation, inhibition of cell growth, and resistance to NK cell-mediated cytotoxicity in OSCSCs induced by IL-2 + anti-CD16 mAb-treated and paraformaldehyde-fixed NK cells is mediated by the combination of IFN-γ and TNF-α and not each cytokine alone. Highly purified NK cells were left untreated or treated with the combination of IL-2 (1000 units/ml) and anti-CD16 mAb (3 μg/ml) for 24 h, after which the NK cells were fixed with 2% paraformaldehyde and added to OSCSCs (0.75:1 NK:OSCSC ratio) in the presence and absence of anti-TNF-α (1:100) and/or anti-IFN-γ (1:100) or isotype control antibodies for a period of 5 days. The media containing the fixed NK cells were removed and extensively washed from each treated OSCSCs and the cytotoxicity against OSCSCs were assessed using freshly isolated untreated NK cells or those treated with IL-2 using a standard 4 h 51Cr release assay. The complete removal of fixed NK cells from OSCSCs was determined by microscopy. Percent cytotoxicity was obtained at different effector to target ratio, and the lytic units 30/106 cells were determined using inverse number of NK cells required to lyse 30% of the tumor cells × 100 (A). The lack of cytotoxic function of 2% paraformaldehyde-fixed untreated and IL-2-treated NK cells were assessed against OSCSCs and OSCCs. NK cells were left untreated or treated with IL-2 for 24 h before they were fixed with 2% paraformaldehyde (B). NK cells were purified from healthy donor and left untreated or treated with IL-2 (1000 units/ml) and the combination of IL-2 (1000 units/ml) and anti-CD16 mAb (3 μg/ml). After an overnight treatment, NK cells were fixed with freshly prepared 2% paraformaldehyde and washed twice with 1× PBS. After 24 h post fixation, supernatants were then collected and the levels of IFN-γ were measured with specific ELISA (C). NK cells purified from healthy donors were left untreated or treated with a combination of IL-2 (1000 units/ml) and anti-CD16 mAb (3 μg/ml) for 24 h, after which the NK cells were washed extensively and stained with PE-conjugated anti-TNF-α mAb followed by flow cytometric analysis. IFN-γ expression was assessed using purified mouse anti-human IFN-γ antibody followed by PE-conjugated goat anti-mouse IgG. Isotype control antibodies were used as controls. The numbers on the right hand corner are percentage positive for each histogram. The histogram overlay for the anti-TNF-α or anti-IFN-γ stained untreated (left) and IL-2 + anti-CD16 mAb-treated NK cells (right) are also shown in this figure. (D) The surface expression of CD54, CD44, B7H1, and MHC class I on untreated and fixed NK-treated OSCSCs as described above were assessed after PE-conjugated antibody staining followed by flow cytometric analysis. Isotype control antibodies were used as controls. The numbers on the right hand corner are the percentages and the mean channel fluorescence intensities for each histogram (E). At the end of the incubation of OSCSCs with fixed NK cells, OSCSCs which were remained attached to the plate were collected, and the number of cells (F) and their viability (G) were assessed using microscopy, and propidium iodide staining followed by flow cytometric analysis, respectively. Highly purified NK cells were left untreated or treated with the combination of IL-2 (1000 units/ml) and anti-CD16 mAb (3 μg/ml) in the presence and absence of monensin (1:1300) for 24 h, after which each sample of NK cells were extensively washed and fixed with 2% paraformaldehyde and added to OSCSCs (0.75:1 NK:OSCSC) for a period of 5 days. Inhibition of IFN-γ release in monensin-treated NK cells before fixation with 2% paraformaldehyde were assessed by ELISA (H). The results were compared to OSCSCs in the absence of fixed NK cells. The media containing the fixed NK cells were removed and extensively washed from each treated OSCSCs and the cytotoxicity against each condition of OSCSCs were assessed using freshly isolated untreated NK cells (I), those treated with IL-2 (J) or treated with the combination of IL-2 + anti-CD16 mAb (K) using a standard 4 h 51Cr release assay. The complete removal of fixed NK cells from OSCSCs was determined by microscopy. Differentiated OSCCs were used as control for the differentiation of OSCSCs. Percent cytotoxicity was obtained at different effector to target ratio, and the lytic units 30/106 cells were determined using inverse number of NK cells required to lyse 30% of the tumor cells × 100. The surface expression of CD54, CD44, and MHC class I on untreated and fixed NK-treated OSCSCs as described above were assessed after PE-conjugated antibody staining followed by flow cytometric analysis. Isotype control antibodies were used as controls. The numbers on the right hand corner are the percentages and the mean channel fluorescence intensities for each histogram (L). At the end of the incubation of OSCSCs with fixed NK cells, the media containing the fixed NK samples were removed from OSCSCs and the viability of the cells were assessed using propidium iodide staining followed by flow cytometric analysis (M). One of minimum three representative experiments is shown in each of (A–M).
Figure 7
Figure 7
Combination of rTNF-α and rIFN-γ induce differentiation and resistance of OSCSCs and SCAP to NK cell-mediated cytotoxicity. OSCSCs (A) were left untreated or treated with recombinant human TNF-α (2 ng/ml), recombinant human IFN-γ (5 units/mL), or the combination of human TNF-α (2 ng/ml) and recombinant human IFN-γ (5 units/ml) in the presence or absence of antibodies against TNF-α (1:100) and/or IFN-γ (1:100) for 24 h. Afterwards, the cells were detached from the tissue culture plates and labeled with 51Cr and used in a standard 4 h chromium release assay against untreated and IL-2-treated (1000 units/ml) NK cells. Pre-treatment of NK cells with IL-2 were carried out for 18–24 h. Percent cytotoxicity was determined at different effector to target ratio, and the lytic units 30/106 cells were determined using inverse number of NK cells required to lyse 30% of the tumor cells ×100. OSCSCs were treated as described in Figure 2A and their viability was assessed using propidium iodide staining followed by the flow cytometric analysis (B). Surface expressions of CD54, CD44, B7H1, and MHC-1 on OSCSCs (C) treated as described in Figure 2A were determined using staining with PE-conjugated antibodies followed by flow cytometric analysis. Isotype control antibodies were used as controls. The numbers on the right hand corner are the percentages and the mean channel fluorescence intensities in each histogram. One of minimum three representative experiments is shown in each of (A–C).
Figure 7
Figure 7
Combination of rTNF-α and rIFN-γ induce differentiation and resistance of OSCSCs and SCAP to NK cell-mediated cytotoxicity. OSCSCs (A) were left untreated or treated with recombinant human TNF-α (2 ng/ml), recombinant human IFN-γ (5 units/mL), or the combination of human TNF-α (2 ng/ml) and recombinant human IFN-γ (5 units/ml) in the presence or absence of antibodies against TNF-α (1:100) and/or IFN-γ (1:100) for 24 h. Afterwards, the cells were detached from the tissue culture plates and labeled with 51Cr and used in a standard 4 h chromium release assay against untreated and IL-2-treated (1000 units/ml) NK cells. Pre-treatment of NK cells with IL-2 were carried out for 18–24 h. Percent cytotoxicity was determined at different effector to target ratio, and the lytic units 30/106 cells were determined using inverse number of NK cells required to lyse 30% of the tumor cells ×100. OSCSCs were treated as described in Figure 2A and their viability was assessed using propidium iodide staining followed by the flow cytometric analysis (B). Surface expressions of CD54, CD44, B7H1, and MHC-1 on OSCSCs (C) treated as described in Figure 2A were determined using staining with PE-conjugated antibodies followed by flow cytometric analysis. Isotype control antibodies were used as controls. The numbers on the right hand corner are the percentages and the mean channel fluorescence intensities in each histogram. One of minimum three representative experiments is shown in each of (A–C).
Figure 8
Figure 8
Antibodies to CD54 or LFA-1 was unable to reverse differentiation but inhibited moderately the cytotoxicity of NKs against differentiated OSCSCs. Highly purified NK cells were left untreated or treated with the combination of IL-2 (1000 units/ml) and anti-CD16 mAb (3 μg/ml) for 24 h, after which the same amounts of supernatants were removed and added to the OSCSCs in the presence and absence of anti-CD54 mAb (10 μg/ml) (A) and anti-LFA-1 (1:100) (B) for 5 days. Treated OSCSCs were then washed extensively and used in a standard 4 h 51Cr release assay against IL-2-activated (1000 units/ml) NK cells. Pre-treatment of NK cells with IL-2 were carried out for 18–24 h. Percent cytotoxicity was determined at different effector to target ratio, and the lytic units 30/106 cells were determined using inverse number of NK cells required to lyse 30% of the tumor cells ×100.
Figure 9
Figure 9
Antibodies to MHC class I increased cytotoxicity of OSCSCs differentiated by IL-2 + anti-CD16 mAb-treated NK supernatants, whereas antibodies to B7H1 did not change cytotoxicity. OSCSCs were treated with supernatants harvested from untreated or IL-2 + anti-CD16 mAb-treated NK cells for 5 days. Treatment of NK cells with the combination of IL-2 + anti-CD16 mAb were carried out for 18–24 h before the supernatants were removed and added to OSCSCs. Thereafter, treated OSCSCs were washed and labeled with 51Cr and used in the cytotoxicity assay in the presence and absence of anti-B7H1 (5 μg/ml) before their addition to NK cells. Percent cytotoxicity was determined at different effector to target ratio, and the lytic units 30/106 cells were determined using inverse number of NK cells required to lyse 30% of the tumor cells ×100 (A). OSCSCs were left untreated or treated with the supernatants prepared from the IL-2 + anti-CD16 mAb-treated NK cells for 5 days before they were washed, 51Cr-labeled, and treated with either isotype control antibody or anti-MHC class I antibody (1:100) for 10 min prior to their use in the cytotoxicity assay against IL-2-treated (1000 units/ml) NK cells. OSCCs were also 51Cr-labeled and treated with and without isotype control or anti-MHC class I (1:100) antibodies before they were used in the cytotoxicity assay against IL-2-treated NK cells. To prepare NK cell supernatant for the treatment of OSCSCs, NK cells were treated with the combination of IL-2 (1000 units/ml) and anti-CD16 mAb (3 μg/ml) for 18–24 h before the supernatants were harvested and added to OSCSCs. The treatment of IL-2 (1000 units/ml) was also carried out for 18–24 h before their use in the cytotoxicity assay. Percent cytotoxicity was determined at different effector to target ratio, and the lytic units 30/106 cells were determined using inverse number of NK cells required to lyse 30% of the tumor cells ×100 (B).
Figure 10
Figure 10
Hypothetical model of induction of anergized NK cells by immune inflammatory cells and by the effectors of connective tissue to support differentiation of non-transformed stem cells and cancer stem cells resulting in their resistance to NK cell-mediated cytotoxicity. NK cell anergy in tumor microenvironment, as well as in non-transformed immune inflammatory microenvironment, is shown. Significant infiltration of immune effectors right beneath the epithelial layer can be seen in a connective tissue area where immune inflammatory cells are likely to anergize NK cells to lose cytotoxicity and gain the ability to secrete cytokines, a term which we previously coined “split anergy” in NK cells, and to support differentiation of the basal epithelial layer containing stem cells. NK cells are likely to encounter and interact with other immune effectors such as monocytes/macrophages or other myeloid-derived suppressor cells (MDSCs), or with connective tissue-associated fibroblasts (CAF), in order to be conditioned to form anergized/regulatory NK (NKreg) cells. NK cells may also directly interact with stem cells at the base of the epithelial layer, in which case by eliminating their bound stem cells, they can become conditioned to support differentiation of other stem cells. NK cell-differentiated epithelial cells will no longer be killed or induce cytokine secretion by the NK cells, resulting in the resolution of inflammation.

References

    1. Kolenko V, Wang Q, Riedy MC, O’Shea J, Ritz J, Cathcart MK, et al. Tumor-induced suppression of T lymphocyte proliferation coincides with inhibition of Jak3 expression and IL-2 receptor signaling: role of soluble products from human renal cell carcinomas. J Immunol (1997) 159(6):3057–67 - PubMed
    1. Mulder WM, Bloemena E, Stukart MJ, Kummer JA, Wagstaff J, Scheper RJ. T cell receptor-zeta and granzyme B expression in mononuclear cell infiltrates in normal colon mucosa and colon carcinoma. Gut (1997) 40(1): 113–9 - PMC - PubMed
    1. Camp BJ, Dyhrman ST, Memoli VA, Mott LA, Barth RJ., Jr In situ cytokine production by breast cancer tumor-infiltrating lymphocytes. Ann Surg Oncol (1996) 3(2):176–8410.1007/BF02305798 - DOI - PubMed
    1. Gimmi CD, Morrison BW, Mainprice BA, Gribben JG, Boussiotis VA, Freeman GJ, et al. Breast cancer-associated antigen, DF3/MUC1, induces apoptosis of activated human T cells. Nat Med (1996) 2(12):1367–7010.1038/nm1296-1367 - DOI - PubMed
    1. Bennett MW, O’Connell J, O’Sullivan GC, Brady C, Roche D, Collins JK, et al. The Fas counterattack in vivo: apoptotic depletion of tumor-infiltrating lymphocytes associated with Fas ligand expression by human esophageal carcinoma. J Immunol (1998) 160(11):5669–75 - PubMed