

Systemic and Cerebral Vascular Endothelial Growth Factor Levels Increase in Murine Cerebral Malaria along with Increased Calpain and Caspase Activity and Can be Reduced by Erythropoietin Treatment
- PMID: 24995009
- PMCID: PMC4062992
- DOI: 10.3389/fimmu.2014.00291
Systemic and Cerebral Vascular Endothelial Growth Factor Levels Increase in Murine Cerebral Malaria along with Increased Calpain and Caspase Activity and Can be Reduced by Erythropoietin Treatment
Abstract
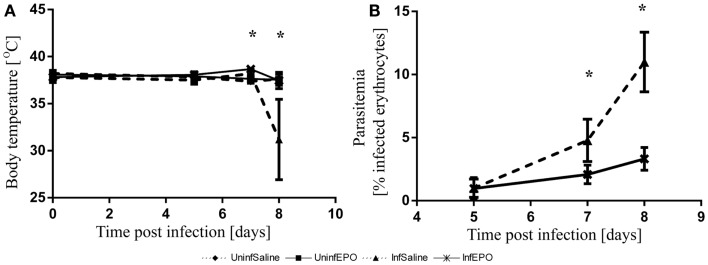
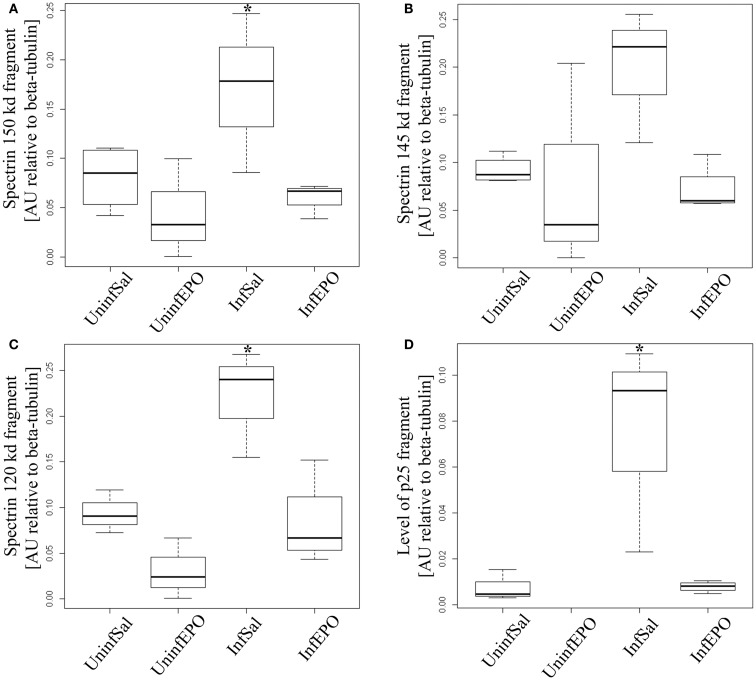
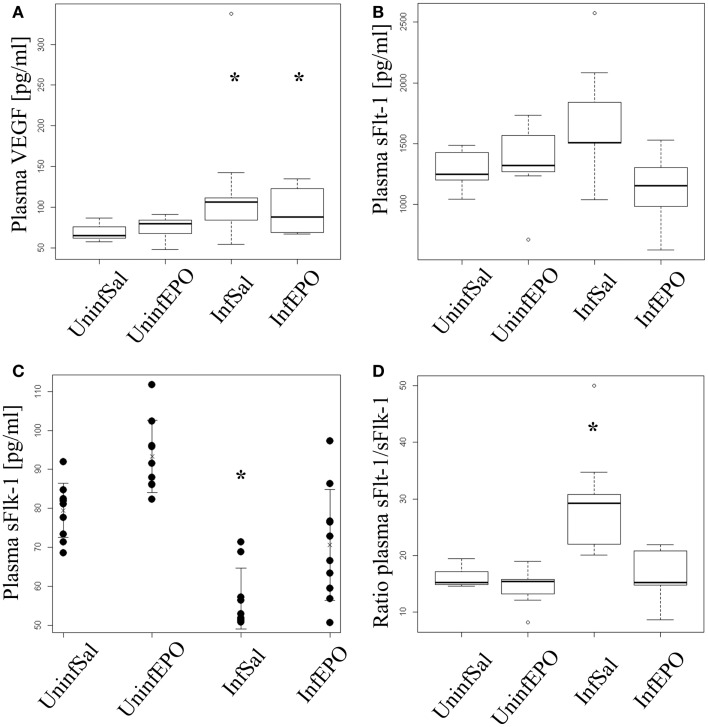
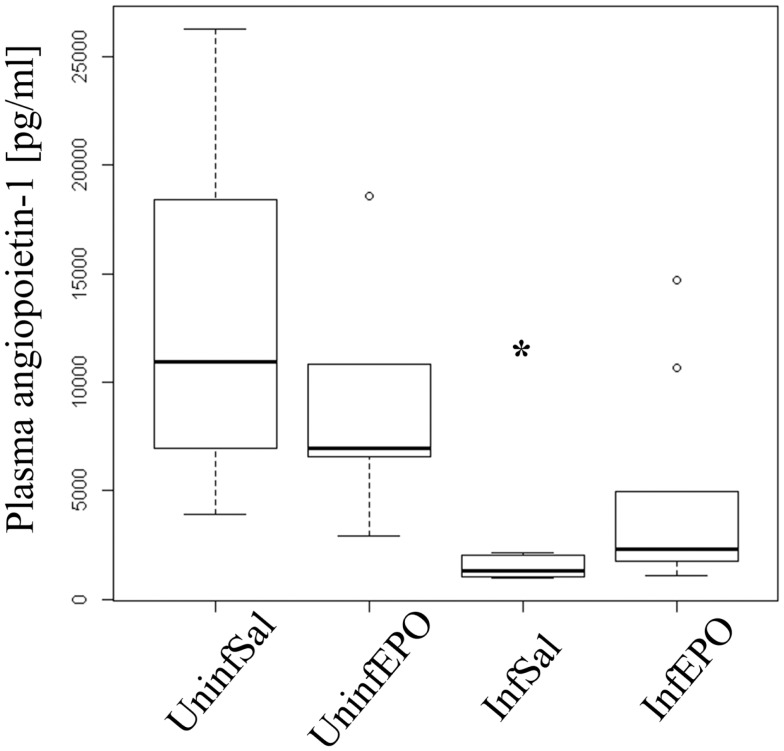
The pathogenesis of cerebral malaria (CM) includes compromised microvascular perfusion, increased inflammation, cytoadhesion, and endothelial activation. These events cause blood-brain barrier disruption and neuropathology and associations with the vascular endothelial growth factor (VEGF) signaling pathway have been shown. We studied this pathway in mice infected with Plasmodium berghei ANKA causing murine CM with or without the use of erythropoietin (EPO) as adjunct therapy. ELISA and western blotting was used for quantification of VEGF and relevant proteins in brain and plasma. CM increased levels of VEGF in brain and plasma and decreased plasma levels of soluble VEGF receptor 2. EPO treatment normalized VEGF receptor 2 levels and reduced brain VEGF levels. Hypoxia-inducible factor (HIF)-1α was significantly upregulated whereas cerebral HIF-2α and EPO levels remained unchanged. Furthermore, we noticed increased caspase-3 and calpain activity in terminally ill mice, as measured by protease-specific cleavage of α-spectrin and p35. In conclusion, we detected increased cerebral and systemic VEGF as well as HIF-1α, which in the brain were reduced to normal in EPO-treated mice. Also caspase and calpain activity was reduced markedly in EPO-treated mice.
Keywords: VEGF; brain; cerebral malaria; erythropoietin; hypoxia; inflammation; neuropathology.
Figures

Similar articles
-
The transcriptional activator hypoxia inducible factor 2 (HIF-2/EPAS-1) regulates the oxygen-dependent expression of erythropoietin in cortical astrocytes.J Neurosci. 2006 Sep 13;26(37):9471-81. doi: 10.1523/JNEUROSCI.2838-06.2006. J Neurosci. 2006. PMID: 16971531 Free PMC article.
-
Cerebral adaptations to chronic anemia in a model of erythropoietin-deficient mice exposed to hypoxia.Am J Physiol Regul Integr Comp Physiol. 2009 Mar;296(3):R801-11. doi: 10.1152/ajpregu.00119.2008. Epub 2008 Dec 24. Am J Physiol Regul Integr Comp Physiol. 2009. PMID: 19109375
-
Alteration in Downstream Hypoxia Gene Signaling in Neonatal Glutathione Peroxidase Overexpressing Mouse Brain after Hypoxia-Ischemia.Dev Neurosci. 2015;37(4-5):398-406. doi: 10.1159/000375369. Epub 2015 Mar 17. Dev Neurosci. 2015. PMID: 25792071 Free PMC article.
-
Erythropoietin and the hypoxic brain.J Exp Biol. 2004 Aug;207(Pt 18):3233-42. doi: 10.1242/jeb.01049. J Exp Biol. 2004. PMID: 15299044 Review.
-
Mystery Story about Erythropoietin (Epo) and Erythropoietin Receptor (EpoR) are Disguised?Hepatogastroenterology. 2015 May;62(139):585-9. Hepatogastroenterology. 2015. PMID: 26897933 Review.
Cited by
-
Hormones in malaria infection: influence on disease severity, host physiology, and therapeutic opportunities.Biosci Rep. 2024 Nov 27;44(11):BSR20240482. doi: 10.1042/BSR20240482. Biosci Rep. 2024. PMID: 39492784 Free PMC article. Review.
-
A comprehensive rhythmicity analysis of host proteins and immune factors involved in malaria pathogenesis to decipher the importance of host circadian clock in malaria.Front Immunol. 2023 Aug 10;14:1210299. doi: 10.3389/fimmu.2023.1210299. eCollection 2023. Front Immunol. 2023. PMID: 37638001 Free PMC article.
-
Binding of Plasmodium falciparum to CD36 can be shielded by the glycocalyx.Malar J. 2017 May 10;16(1):193. doi: 10.1186/s12936-017-1844-6. Malar J. 2017. PMID: 28486940 Free PMC article.
-
Perivascular Arrest of CD8+ T Cells Is a Signature of Experimental Cerebral Malaria.PLoS Pathog. 2015 Nov 12;11(11):e1005210. doi: 10.1371/journal.ppat.1005210. eCollection 2015. PLoS Pathog. 2015. PMID: 26562533 Free PMC article.
-
Expanding the antimalarial toolkit: Targeting host-parasite interactions.J Exp Med. 2016 Feb 8;213(2):143-53. doi: 10.1084/jem.20151677. Epub 2016 Feb 1. J Exp Med. 2016. PMID: 26834158 Free PMC article. Review.
References
LinkOut - more resources
Full Text Sources
Other Literature Sources
Research Materials