. 2014 May 15;7(5):1214-22.
eCollection 2014.

Dual effects of ouabain on the regulation of proliferation and apoptosis in human umbilical vein endothelial cells: involvement of Na(+)-K(+)-ATPase α-subunits and NF-κB

Affiliations

Dual effects of ouabain on the regulation of proliferation and apoptosis in human umbilical vein endothelial cells: involvement of Na(+)-K(+)-ATPase α-subunits and NF-κB

Yan-Ping Ren et al. Int J Clin Exp Med. .

Abstract

Purpose: To elucidate the effect of ouabain on the regulation of proliferation and apoptosis of HUVECs and involvement of different Na(+)-K(+)-ATPase α-subunits and NF-κB.

Methods: HUVECs were isolated by collagenase perfusion, and MTT assays and cell cycle analysis were performed to study proliferation. NF-κB expression and function were examined by immunohistochemical staining and western blotting. Na(+)-K(+)-ATPase activity was determined by measuring released ouabain inhibitable inorganic phosphate (Pi). The expression of different α-subunits was investigated by real RT-PCR, western blotting and cell immunofluorescence.

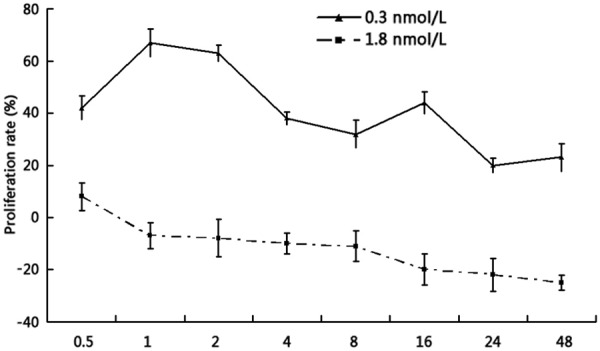
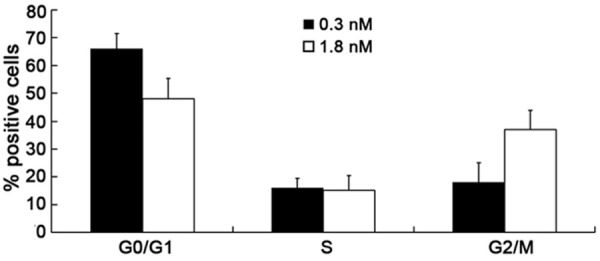
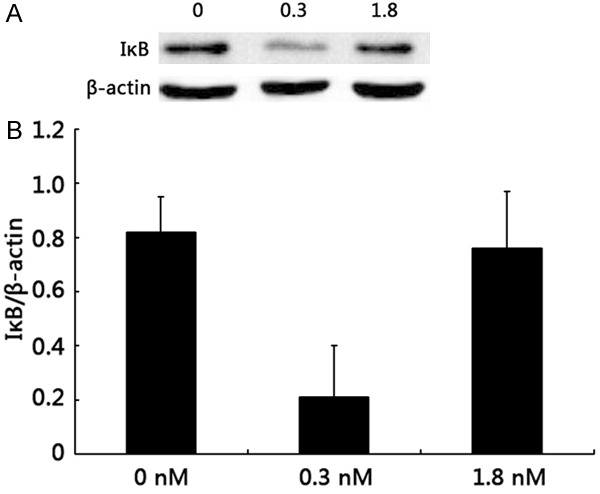
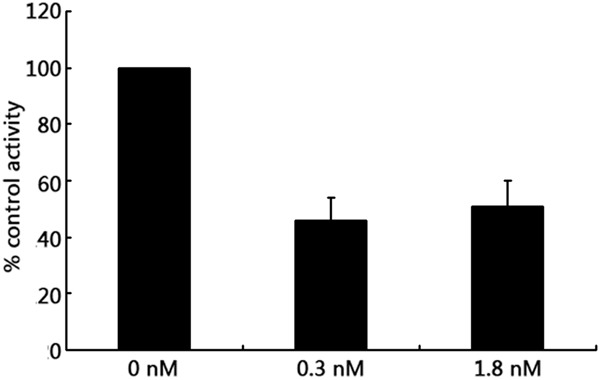
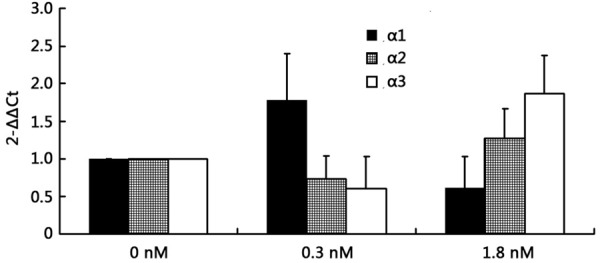
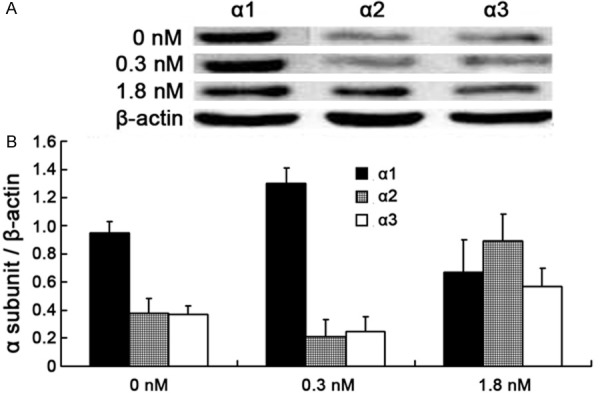
Results: 0.3 nM ouabain treatment for 0.5 h triggered the proliferation of HUVECs, peaking at 1-2 h. At 1.8 nM for 0.5 h, ouabain induced an increase of cell proliferation for a short time, and then triggered a decrease after 1 h. Cell cycle analysis show that 37% of HUVECs were in G2/M phase of the cell cycle following incubation with 1.8 nM ouabain, compared with 18% with 0.3 nM ouabain. NF-κB activity was assessed by western blot analysis of IκB expression, which was significantly reduced with 0.3 nM ouabain treatment; there was no different between 1.8 nM ouabain treatment and untreated cells. Na(+)-K(+)-ATPase activity in HUVECs was markedly reduced after treatment with 0.3 nM and 1.8 nM ouabain. Real RT-PCR and western blotting indicated that Na(+)-K(+)-ATPase α1-subunit mRNA expression levels increased after 0.3 nM ouabain treatment and decreased after 1.8 nM ouabain treatment. However, α2- and α3-subunit mRNA decreased after 0.3 nM ouabain treatment and increased after 1.8 nM ouabain treatment.

Conclusion: Ouabain at different concentrations caused dual effects on proliferation and apoptosis in HUVECs.

Keywords: NF-κB; Ouabain; endothelium; α subunit.


Figures

Figure 1
Figure 1
Ouabain affected the proliferation of HUVECs in a time-dependent manner. HUVECS were treated with 0.3 nmol/L or 1.8 nmol/L ouabain over a period of 48 h (n = 4; mean ± SEM). Ouabain at 0.3 nM triggered the proliferation of HUVECs from 0.5 h, and the most prominent increases were observed at 1-2 h. However, 1.8 nM ouabain treatment for 0.5 h induced an increase in cell proliferation for a short time, and then triggered a decrease from 1 h.
Figure 2
Figure 2
Effect of ouabain on cell cycle distribution. The results show that 37% of HUVECs were in G2/M phase after 1.8 nM ouabain treatment, compared with 18% of those treated with 0.3 nM ouabain (P < 0.01) after 2 h incubation. The data are expressed as a percentage of positive cells in the respective cell cycle phase. Bars correspond to the mean ± SEM. Data are representative of three samples.
Figure 3
Figure 3
NF-κB activity determination by western blot analysis of IκB expression. (A) Western blot and (B) densitometric analysis of IκB expression. The expression of IκB was significantly reduced after 0.3 nM ouabain treatment (0.82 ± 0.13 versus 0.21 ± 0.19, P < 0.01). No effects were observed for 1.8 nM ouabain treatment or the control group (0.82 ± 0.13 versus 0.76 ± 0.21, p > 0.05). Bars not sharing a common letter are significantly different from each other (P < 0.01).
Figure 4
Figure 4
Effects of different concentrations of ouabain on Na+-K+-ATPase activity in HUVECs. The activity of Na+-K+-ATPase in HUVECs was significantly reduced after treatment with either 0.3 nM or 1.8 nM ouabain (46 ± 8%, 51 ± 9% versus 100%, P < 0.01), and there was no difference between the two groups (46 ± 8% versus 51 ± 9%, P > 0.05). Values shown are means ± SEM of three observations assayed in triplicate. Bars not sharing a common letter are significantly different from each other (P < 0.01).
Figure 5
Figure 5
Effect of different concentrations of ouabain on Na+-K+-ATPase α-subunit mRNA expression in HUVECs. The expression level of α1-subunit mRNA increased after 0.3 nM ouabain treatment (1.78 ± 0.61 versus 1, P < 0.01) and decreased after 1.8 nM ouabain treatment (0.62 ± 0.41 versus 1, P < 0.01). However, α2- and α3-subunit mRNA expression decreased after 0.3 nM ouabain treatment (0.73 ± 0.31 and 0.61 ± 0.42 versus 1, respectively; P < 0.01) and increased after 1.8 nM ouabain treatment (1.27 ± 0.39 and 1.87 ± 0.50 versus 1, respectively; P < 0.01). Values shown indicate means ± SEM of three observations assayed in triplicate. In each α-subunit group, bars not sharing a common letter are significantly different from each other (P < 0.01).
Figure 6
Figure 6
Analysis of α1-, α2- and α3-subunits expression. (A) Western blot and (B) densitometric analysis of α1-, α2- and α3-subunits expression. α1-subunit protein expression levels were increased after 0.3 nM ouabain treatment (1.3 ± 0.11 versus 0.95 ± 0.08, P < 0.01) and decreased after 1.8 nM ouabain treatment (0.67 ± 0.23 versus 0.95 ± 0.08, P < 0.01). But α2 and α3-subunit protein decreased after 0.3 nM ouabain treatment (0.21 ± 0.12 versus 0.38 ± 0.10, and 0.25 ± 0.10 versus 0.37 ± 0.06, respectively; P < 0.01) and increased after 1.8 nM ouabain treatment (0.89 ± 0.19 versus 0.38 ± 0.10, and 0.57 ± 0.13 versus 0.37 ± 0.06, respectively; P < 0.01) Values shown are means ± SEM of three observations assayed in triplicate. In each α-subunit group, bars not sharing a common letter are significantly different from each other (P < 0.01).

References

    1. Trevisi L, Pighin I, Luciani S. Vascular endothelium as a target for endogenous ouabain: studies on the effect of ouabain on human endothelial cells. Cell Mol Biol (Noisy-le-grand) 2006;52:64–70. - PubMed
    1. Hamlyn JM, Blaustein MP, Bova S, DuCharme DW, Harris DW, Mandel F, Mathews WR, Ludens JH. Identification and characterization of a ouabain-like compound from human plasma. Proc Natl Acad Sci U S A. 1991;88:6259–6263. - PMC - PubMed
    1. Hamlyn JM, Hamilton BP, Manunta P. Endogenous ouabain, sodium balance and blood pressure: a review and a hypothesis. J Hypertens. 1996;14:151–167. - PubMed
    1. Schoner W, Scheiner-Bobis G. Endogenous cardiac glycosides: hormones using the sodium pump as signal transducer. Semin Nephrol. 2005;25:343–351. - PubMed
    1. Hamlyn JM, Blaustein MP. Salt sensitivity, endogenous ouabain and hypertension. Curr Opin Nephrol Hypertens. 2013;22:51–58. - PMC - PubMed

LinkOut - more resources