. 2014 Sep;281(18):4263-79.
doi: 10.1111/febs.12904. Epub 2014 Aug 4.

Crystal structures of apparent saccharide sensors from histidine kinase receptors prevalent in a human gut symbiont

Affiliations

Crystal structures of apparent saccharide sensors from histidine kinase receptors prevalent in a human gut symbiont

Zhen Zhang et al. FEBS J. 2014 Sep.

Abstract

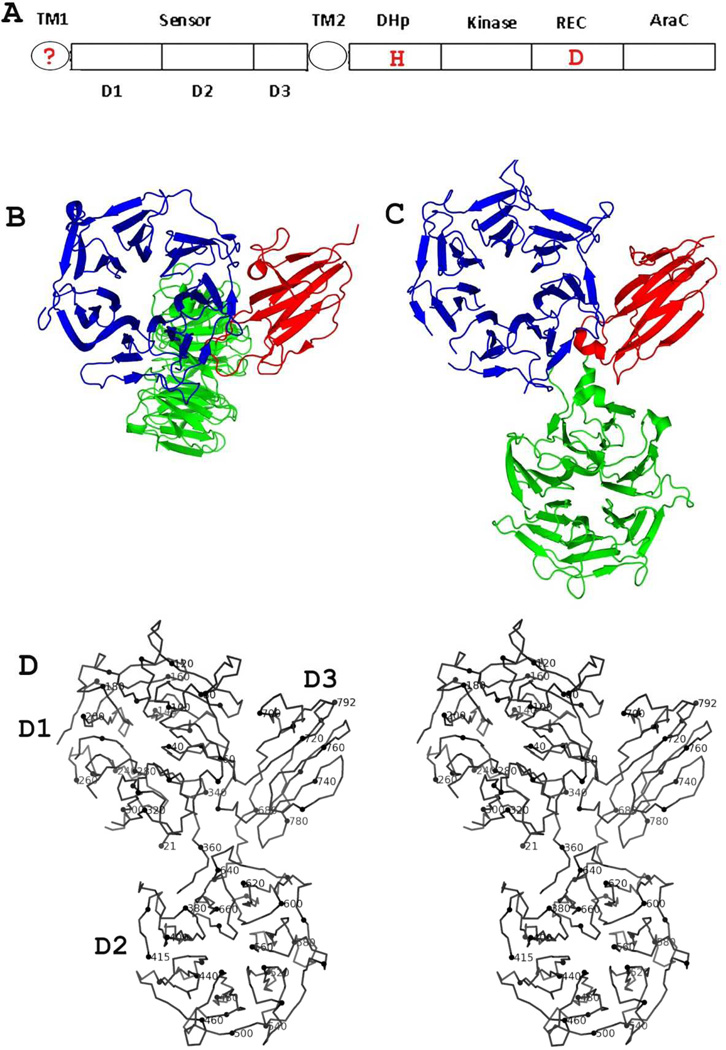
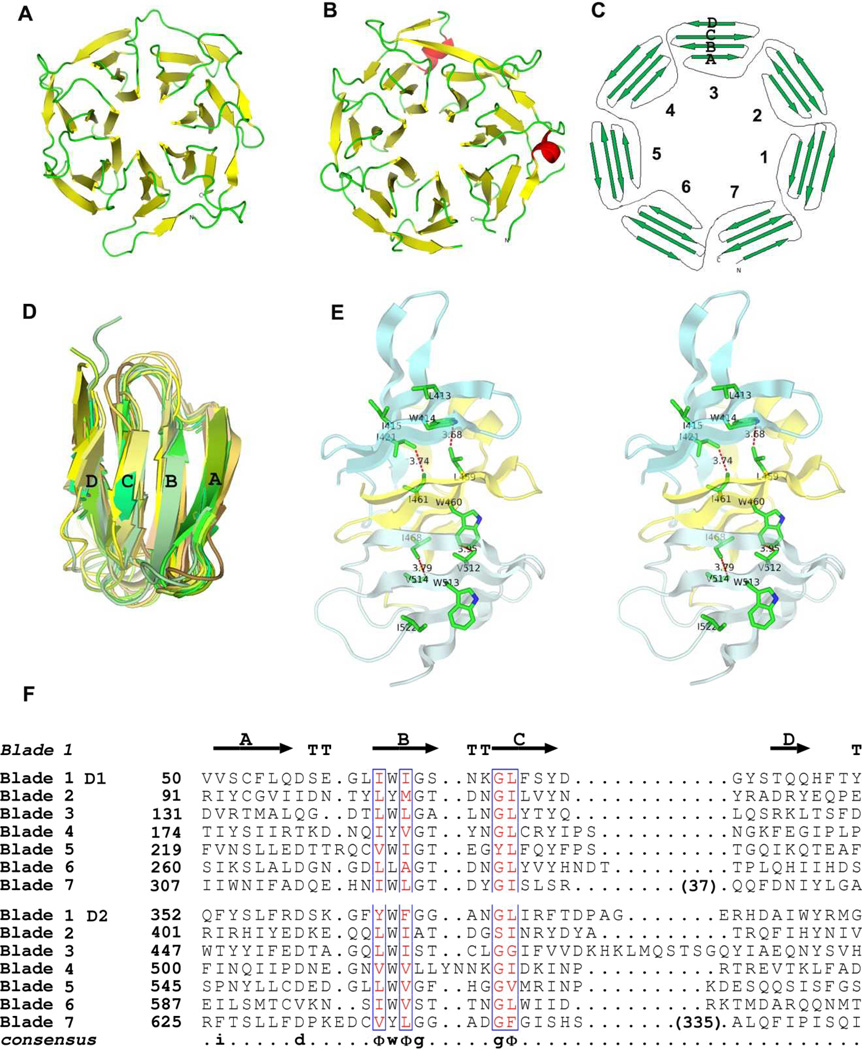
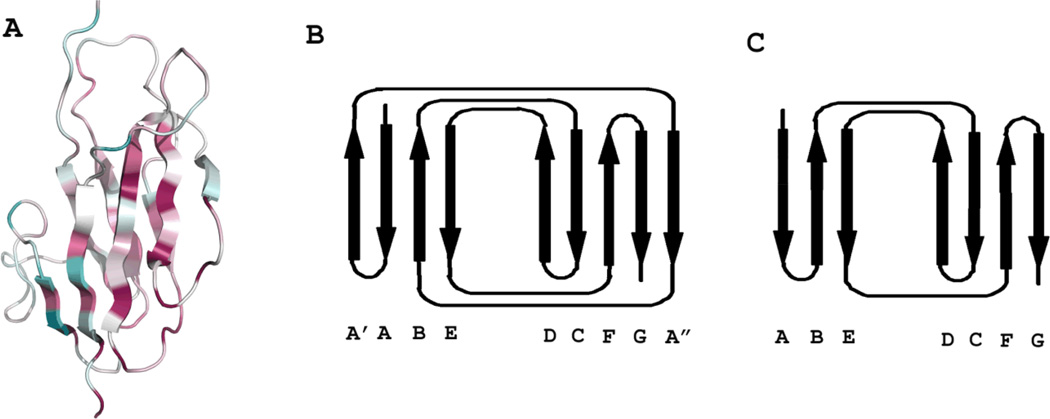
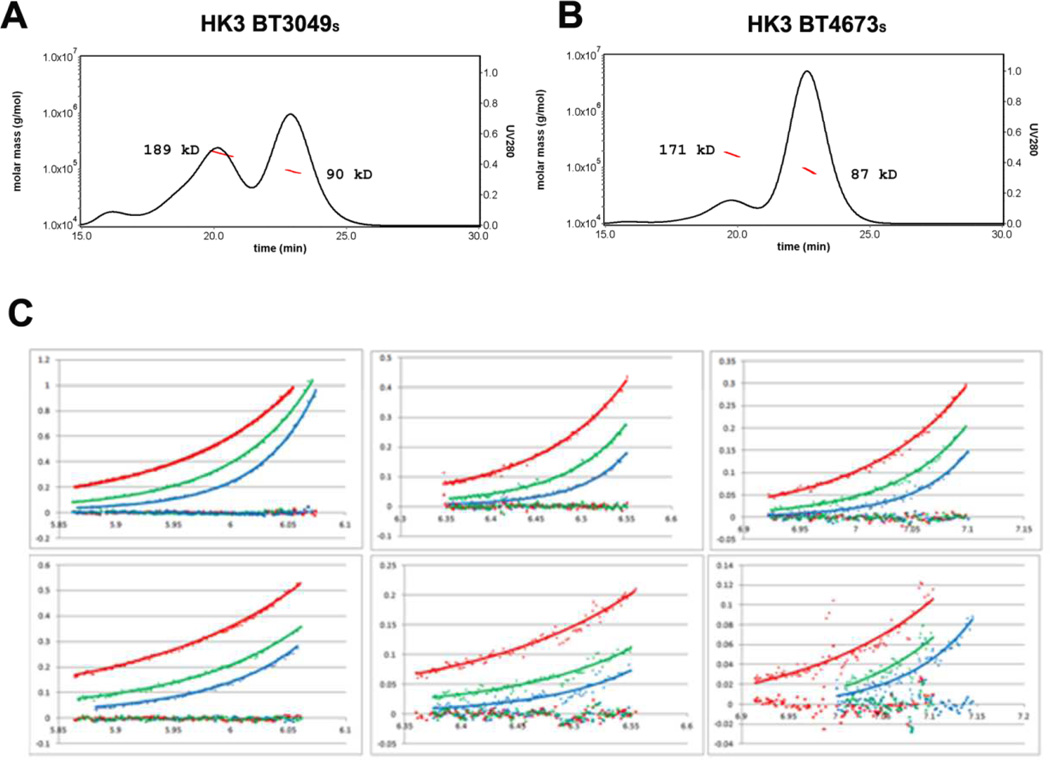
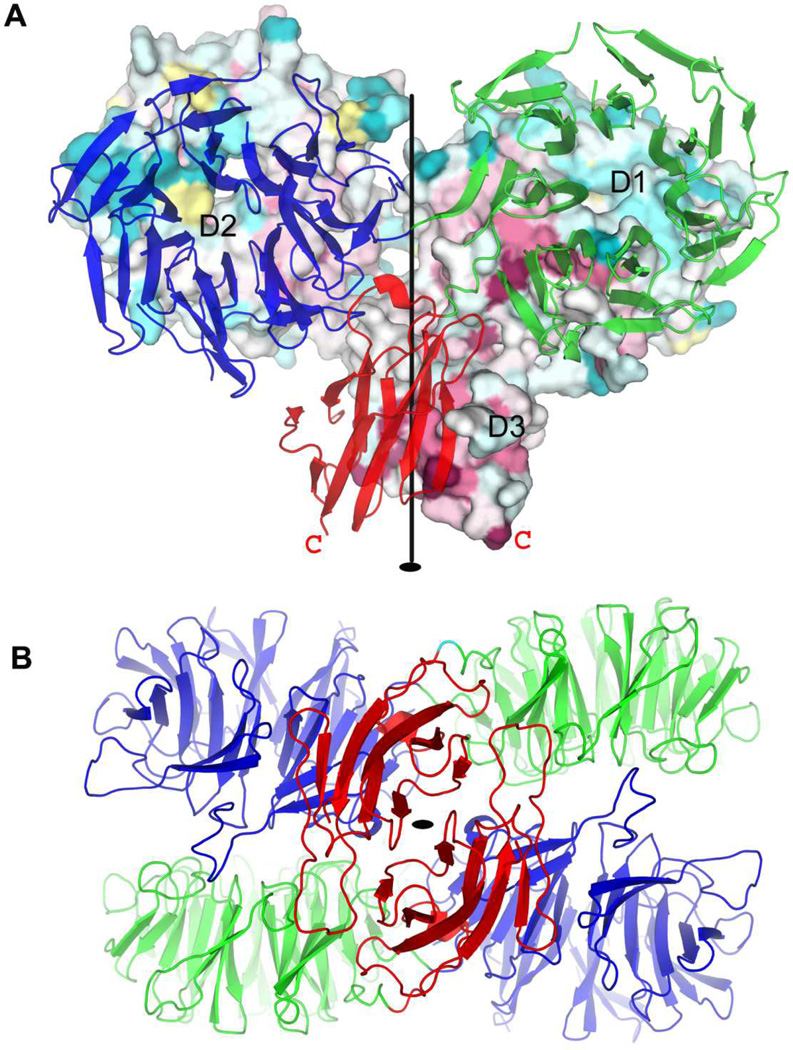
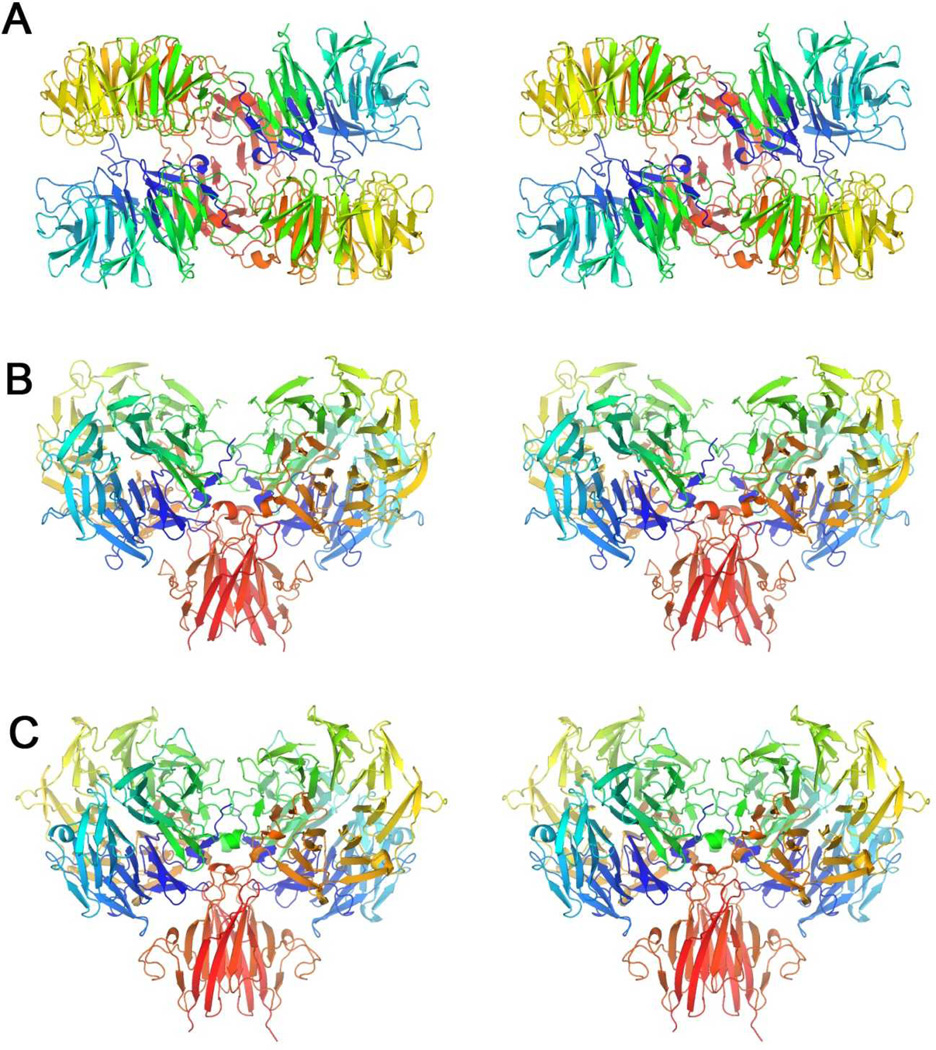
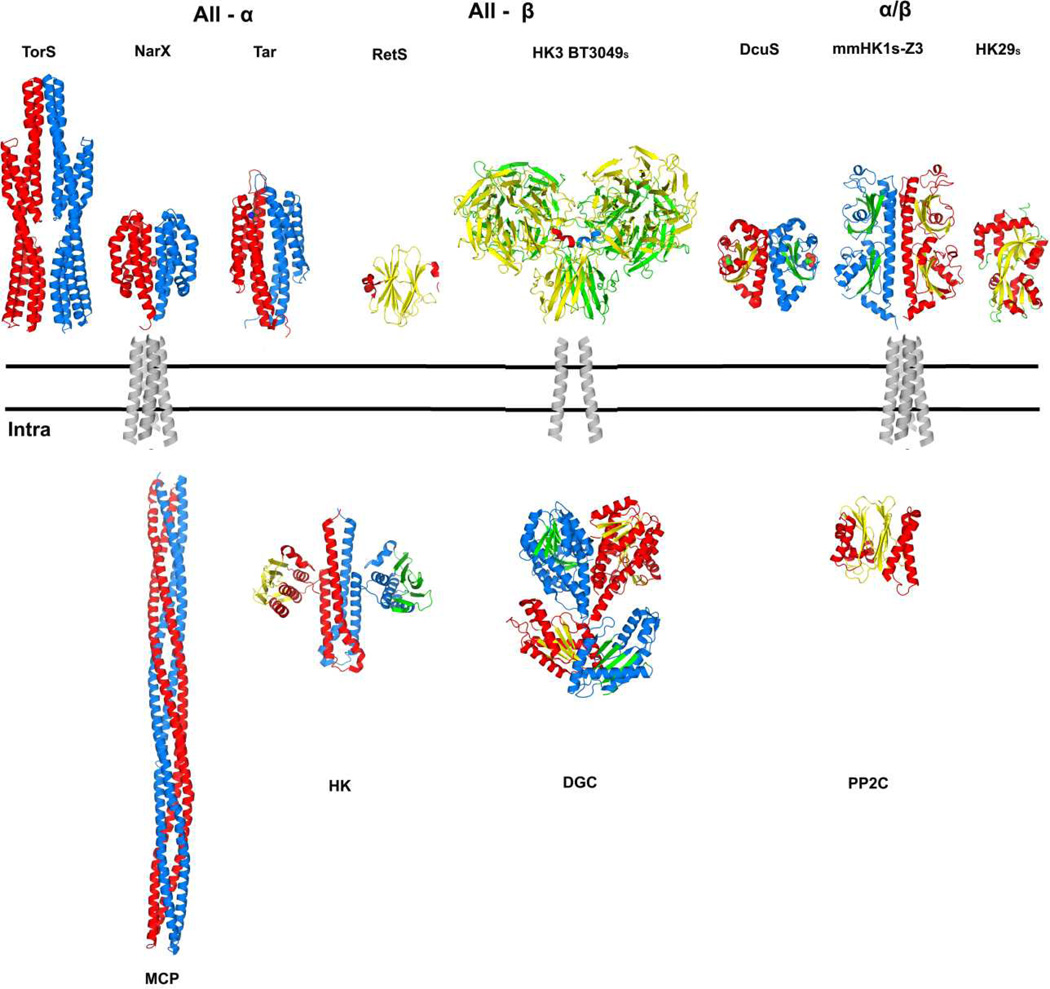
The adult human gut is a complicated ecosystem in which host-bacterium symbiosis plays an important role. Bacteroides thetaiotaomicron is a predominant member of the gut microflora, providing the human digestive tract with a large number of glycolytic enzymes. Expression of many of these enzymes appears to be controlled by histidine kinase receptors that are fused into unusual hybrid two-component systems that share homologous periplasmic sensor domains. These sensor domains belong to the third most populated (HK3) family based on a previous unpublished bioinformatics analysis of predicted histidine kinase sensors. Here, we present the crystal structures of two sensor domains representative of the HK3 family. Each sensor is folded into three domains: two-seven-bladed β-propeller domains and one β-sandwich domain. Both sensors form dimers in crystals, and one sensor appears to be physiologically relevant. The folding characteristics in the individual domains, the domain organization, and the oligomeric architecture are all unique to HK3 sensors. Sequence analysis of the HK3 sensors indicates that these sensor domains are shared among other signaling molecules, implying combinatorial molecular evolution.

Database: The structural data for the crystallographic results for HK3 BT4673S and HK3 BT3049S have been deposited in the Protein Data Bank under accession numbers 3OTT and 3V9F, respectively.

Structured digital abstract: HK3BT3049S and HK3BT3049S bind by x-ray crystallography (View interaction) HK3BT3049S and HK3BT3049S bind by molecular sieving (View interaction) HK3BT3049S and HK3BT3049S bind by cosedimentation through density gradient (View interaction) HK3BT4673s and HK3BT4673s bind by cosedimentation through density gradient (View interaction) HK3BT4673s and HK3BT4673s bind by molecular sieving (View interaction).

Keywords: hybrid two-component system; saccharide sensing; signal transduction; β-propeller domain; β-sandwich domain.


Figures

Figure 1
Figure 1. Structure of family 3 (HK3) histidine kinase receptors
(A) Prototypical domain organization of HK3-type receptors. The question mark in TM1 indicates that it may not be present as a TM helix (see Supplemental Figure S1). Positions of signature two-component phosphorylation sites at histidine (H) and aspartic acid (D) residues are marked in red. (B) Ribbon diagram of HK3 sensor domain BT4673S. The orientation views domain D1 into the top view [38] of the β-propeller domain. The coloring is done by domain: D1 (blue), D2 (green) and D3 (red). (C) Ribbon diagram of HK3 sensor domain BT3049S. The orientation of the D1/D3 unit is as in Fig. 1B. The coloring is as in (B). Figs. 1C and 1D were generated using PyMol [69]. (D) Stereodiagram of the α-carbon backbone trace of HK3 BT3049S. Every 10th residue (modulo 10) is highlighted and every 20th residue is labeled.
Figure 2
Figure 2. Structure and sequence characteristics of HK3 β-propeller domains
(A) Ribbon diagram of the D1 domain of HK3 BT4673S viewing the top side [38]. Strands are colored yellow and loops are green. (B) Ribbon diagram of the D2 domain of HK3 BT4673S oriented and colored as in A except that two short helices are in red. (C) Topology diagram of the β-propeller domains. (D) Superimposition of ribbon diagrams of all 14 propeller blades from HK3 BT4673S. (E) Stereodiagram showing the interactions between three adjacent propeller blades. Blades 9–11 from D2 of HK3 BT4673S are shown as ribbon diagrams with contact residues drawn in stick representation. Hydrophobic contacts are shown as red dotted lines with the shortest distance labeled. (F) The structure-based sequence alignment of all 14 blades of HK3 BT4673S. The ribbon figures were generated using PyMol [69], and the sequence alignment figure was drawn using ESPript [–72]. Strand and turn residues in blade 1 of D1 are shown as arrows or by T, respectively.
Figure 3
Figure 3. Overall fold of HK3 β-sandwich domains
(A) Stereodiagram of the β-sandwich domain D3 of HK3 BT4673S. Coloring is based on the conservation of residues through all HK3 homologs in B. thetaiotaomicron using the ConSurf scheme [73] whereby degree of conservation are reflected in increasing saturations of purple and degree of variability is reflected in increase saturations of cyan. The figure was generated using PyMol [69]. (B) Topology diagram of HK3 domain D3, opened as a book to view the two sheets from inside the β-sandwich. (C) Topology diagram of tenascin (modified from [37]).
Figure 4
Figure 4. Solution analyses of dimerization by HK3 sensor proteins
(A, B) Dimerization analysis by SEC coupled with MALS for HK3 BT3049S and HK3BT4673S, respectively. Continuous black lines show the ultraviolet absorption at 280 nm and the red dotted lines show the molecular weights calculated from MALS. Both pictures were made by Astra V (Wyatt). Data were measured within 24 hours of purification. (C) Analytical ultracentrifugation data and fittings for BT4673S (upper panels) and BT3049S (lower panels), showing measurements made at 2.00, 1.33 and 0.67 mg/mL in panels at left, middle and right, respectively. The colored diamonds represent measured absorbance (280 nm) at equilibrium after runs at 13000 (blue), 11000 (green), and 9000 (red) rpm. The colored squares represent the residues between measured absorbance (280 nm) and fitted data at 13000 (blue), 11000 (green), and 9000 (red) rpm, all of which are near baseline. Data were measured within three days of purification.
Figure 5
Figure 5. Dimeric structure of HK3 sensor protein BT3049S
(A) View of the HK3 BT3049S dimer from within the plane of the membrane. The orientation is such that both β-propeller domains are viewed down their propeller axes. Propeller top sides [37] are in apposition at the reciprocal D1:D2′ interfaces. One protomer is shown as surface representation with residues colored based on its conservation through all HK3 homologs in B. thetaiotaomicron [73] and with domains D1, D2, and D3 labeled. The other protomer is shown as a ribbon diagram colored by domain: D1 (blue), D2 (green) and D3 (red). The C-terminus of each protomer is labeled as a red letter C. The quasi two-fold rotation axis is shown as a black line. (B) View of the HK3 BT3049S dimer out from the membrane surface, from bottom of (A). The structure is shown as a ribbon diagram with coloring as for the ribbon protomer in C: D1 (blue), D2 (green) and D3 (red). The quasi two-fold rotation axis is shown as a black oval. The picture was made using PyMol [69].
Figure 6
Figure 6. Stereoviews of productive B. thetaiotaomicron HK3 dimers
(A) BT3049S dimer CD (PDBid 3V9F) viewed looking toward the membrane surface along the diad axis. (B) BT3049S dimer CD viewed from the side, 90° from (A), with the putative membrane below. (C) BT4663S dimer AB (PDBid 4A2L) viewed as in (B). Each polypeptide chain is drawn in ribbon representation with spectral coloring, blue/green (N-D1) to yellow/orange (D2) to red (D3-C).
Figure 7
Figure 7. Summary of diverse, variably associated transmembrane receptor systems
The double lines represent the plasma membrane. Alternative extracellular / periplasmic sensor domains are shown above the membrane and alternative cytoplasmic signaling portions are shown below the membrane. A transmembrane domain connects the outside to the inside in diverse combinations. Structure figures were generated PyMol [69] from PDB files as indicated: TorSS (3O1H; [22]), NarXS (3EZH; [15]), TarS (2LIG; [74]), RetSS (3JYB; [45]), HK3 BT3049S (3V9F; this work), DcuSS (3BY8; [75]), HK1S-Z3 (3LIB; [29]), HK29s (3H7M; [76]), transmembrane domains (1H2S; [39]), MCP (2CH7; [77]), HK (2C2A; [23]), DGC (2WB4; [78]) and PP2C (2XZV; [79]). All structures are shown as dimers except for RetSS, PP2C and HK29S. The coloring for one protomer has helix (red) and sheet (yellow); that for the partner protomer has helix (blue) and sheet (green). The four-helix bundle transmembrane domain is shown as representative for conventional all-helix (e.g. NarX or Tar) and PDC-domain (e.g. DcuS or HK1) receptors; a two-helix transmembrane domain is shown for the unconventional HK3 receptors, which connect to various signaling components in the cytoplasm.

References

    1. Hooper LV, Gordon JI. Commensal host-bacterial relationships in the gut. Science. 2001;292:1115–1118. - PubMed
    1. Hooper LV, Midtvedt T, Gordon JI. How host-microbial interactions shape the nutrient environment of the mammalian intestine. Annu Rev Nutr. 2002;22:283–307. - PubMed
    1. Savage DC. Microbial ecology of the gastrointestinal tract. Annu Rev Microbiol. 1977;31:107–133. - PubMed
    1. Eckburg PB, Bik EM, Bernstein CN, Purdom E, Dethlefsen L, Sargent M, Gill SR, Nelson KE, Relman DA. Diversity of the human intestinal microbial flora. Science. 2005;308:1635–1638. - PMC - PubMed
    1. Martens EC, Chiang HC, Gordon JI. Mucosal glycan foraging enhances fitness and transmission of a saccharolytic human gut bacterial symbiont. Cell Host Microbe. 2008;4:447–457. - PMC - PubMed

Publication types

LinkOut - more resources